It’s only August, but voting is already underway for the March 2016 South By Southwest (SxSW) Interactive conference. Long thought of as the breeding ground for new ideas and creative technologies, we can gleam industry insights from the SXSW Interactive Festival. This year, I decided not to wait until the conference to delve into the veritable buffet of groundbreaking panels vying for festival space. This year’s PanelPicker interface received more than 4,000 proposals, which is an all-time record!
While a quick search of infographics yields only 11 results, a mere TWO actually have the word “Infographics” in the title. The industry discourse has shifted away from “how-to” models to “how to do it right.” Infographics have become a key format of the larger conversation: Visual Storytelling.
A quick search for “Visual Storytelling” yields over 200 talks in PanelPicker, along with hundreds more for “data visualization” and “visual content”. Infographics are now used as one of many effective tools in the Marketer’s toolbox, and an accepted part of the larger conversation happening in the content marketing industry.
Visual storytelling is vital to content marketing success. The following types of visual content are at the forefront of the proposals for next year’s SXSW Interactive Festival.
1. Animated GIFs
Source: Animagraffs by Jacob O'Neal
The social media world has been slow to adopt GIFs, with Facebook only just embracing the truncated clips this year. The average human attention span in 2015 is 8.25 seconds, so these bite-sized animations are the perfect for telling a complete story in a short amount of time. The motion in the image also captures attention on an already crowded news feed.
Check out these GIF-centric presentations, “Why GIFs are turning into the New Emojis on Mobile” and “Visual Storytelling - GIFs, Graphs, and Napoleon.”
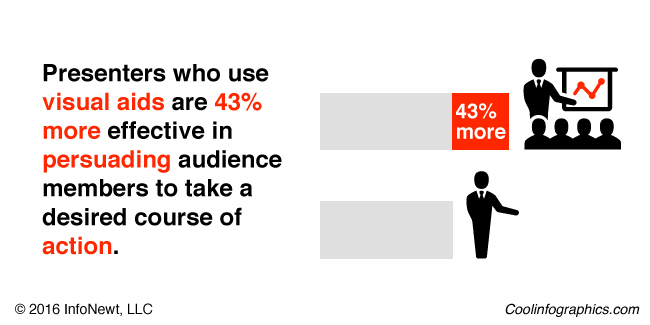
2. Visual Presentations
Slideshare and other presentation-style platforms provide a visual and interactive way to share lots of information. With millions of visitors per month, Slideshare is an easy way to have your presentations seen by a large audience.
Perfect your visual presentations with “Sucking Less When Presenting Creative” and “The Power of Poise: Chi for Pitch and Presentation.”
3. Real-time storytelling
Real-time storytelling has increased in popularity with the rise of live feed social platforms like Periscope and Meerkat. The ease of execution and the sheer scope of the audience made these two platforms instantly successful. While Meerkat took the prize for most buzzed app at last year’s SXSW, Periscope has the weight of Twitter behind it and has become the more successful of the two.
Use these two tools to live broadcast your events, host a Q&A, or even share professional tips to a larger audience. Perfect your live-streaming with the “Live Streaming Killed Cable TV Star” and “Igniting Creativity with Periscope” PanelPicker proposals.
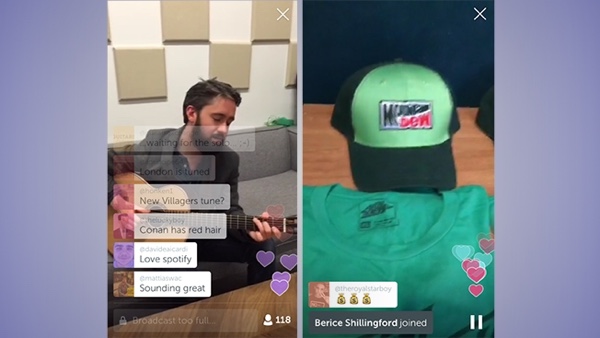
Source: AdWeek
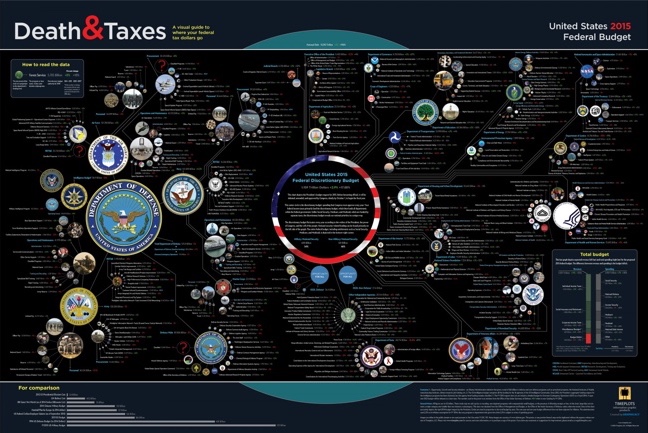
4. Infographics
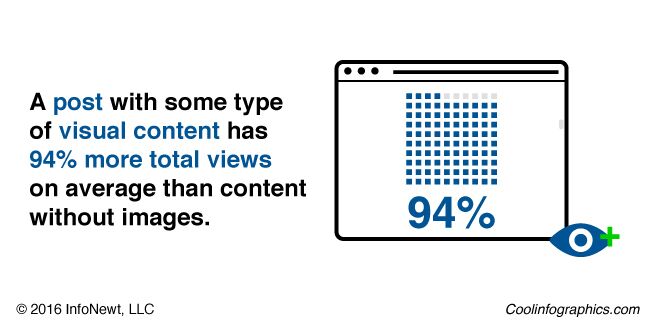
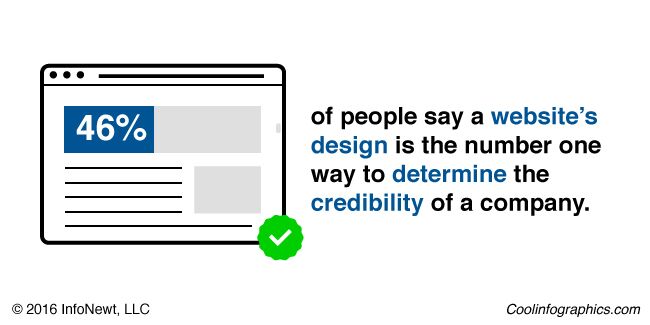
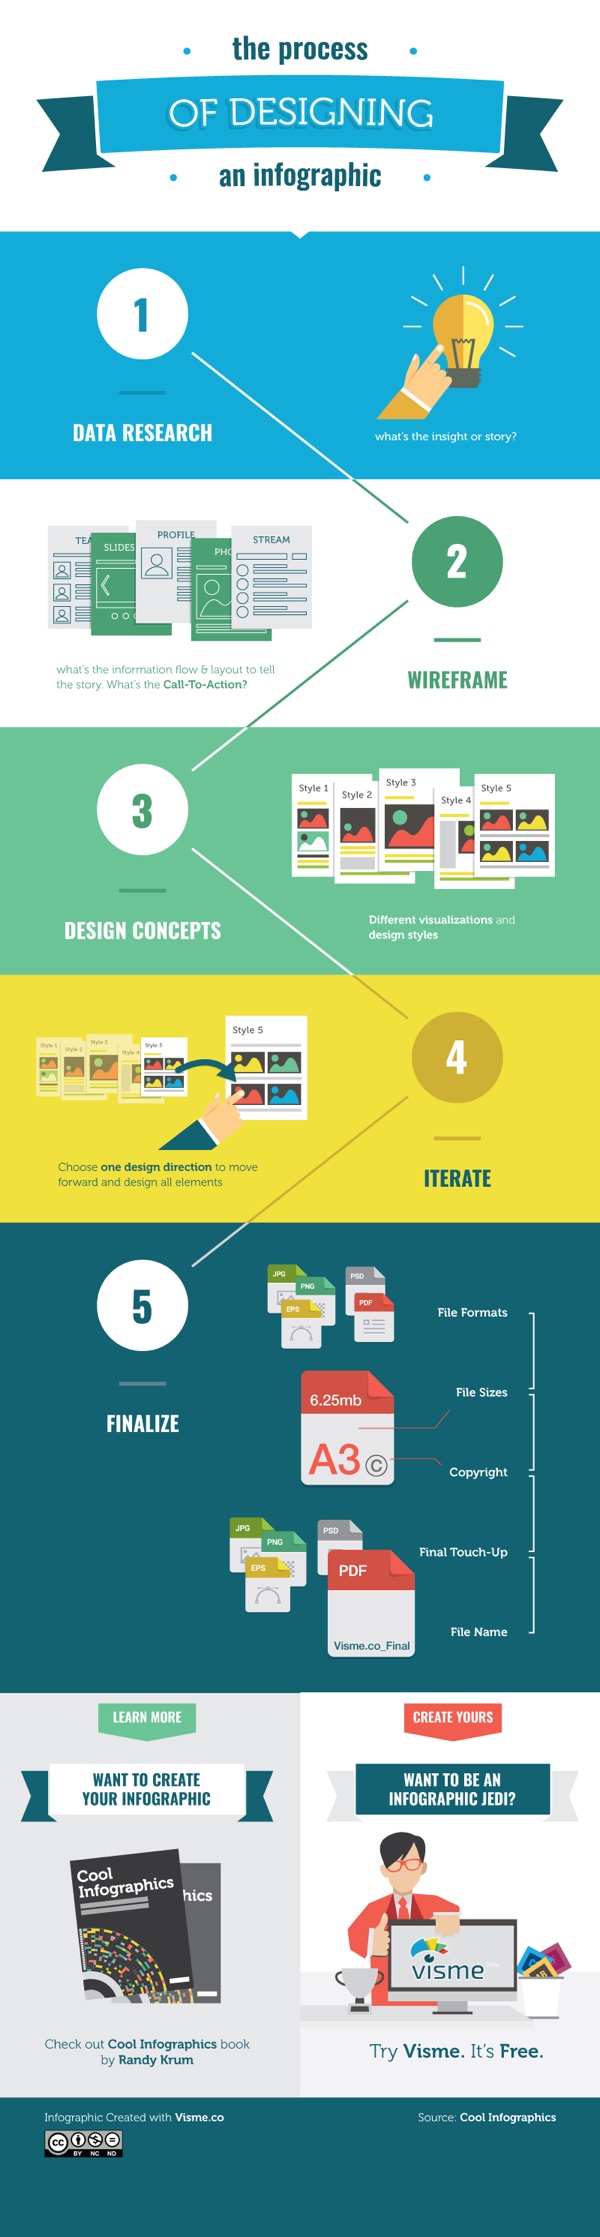
I couldn’t get through my list without mentioning infographics. Still one of the best ways to convey complex information in a shareable and visually appealing format, infographics should be worked into your content marketing strategy. While they are no longer the only way to tell a visual story, they remain a marketing industry staple.
Round out your visual storytelling prowess with great infographics. Learn how to rock your next infographic with my own proposal, “7 Deadly Sins of Infographics Design and How to Fix Them.”
Source: Visme
Buzzword or not, visual storytelling is something we’ve all been doing since we first snapped a picture with a polaroid camera, we’re just getting better at it. Judging by PanelPicker entries alone, the 2016 SXSW Interactive Festival will be another great year for the content marketing industry.
Update on Thursday, August 27, 2015 at 7:47AM by
 Randy
Randy
This post also appeared on The Huffington Post