About
Randy Krum
President of InfoNewt.
Data Visualization and Infographic Design

Infographic Design

Infographics Design | Presentations
Consulting | Data Visualizations

DFW DataViz Meetup

Join the DFW Data Visualization and Infographics Meetup Group if you're in the Dallas/Fort Worth area!

Search the Cool Infographics site

Custom Search

Subscriptions:


Feedburner

The Cool Infographics® Gallery:

How to add the
Cool Infographics button to your:

Cool Infographics iOS icon

- iPhone
- iPad
- iPod Touch


Read on Flipboard for iPad and iPhone

Featured in the Tech & Science category

Flipboard icon

Twitter Feed
From the Bookstore

Caffeine Poster

The Caffeine Poster infographic

Entries in Big Data (8)

Thursday
Nov292018

Big Data & Infographics eBook Bundle

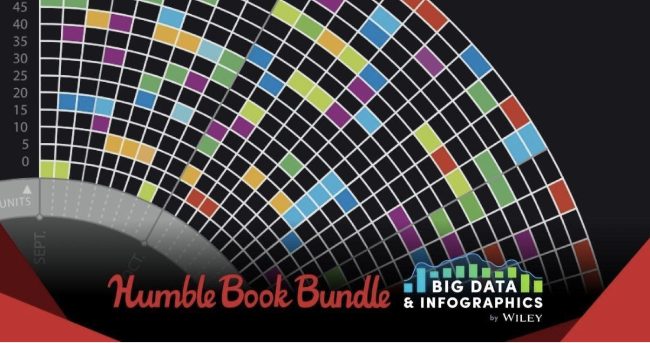
Humble Bundle and Wiley Tech have teamed up to offer the Big Data & Infographics Book Bundle! This is a limited-time offer, and EXPIRES on Monday December 3rd, 2018 at 2pm EDT! I love that this deal is supporting Doctors Without Borders!

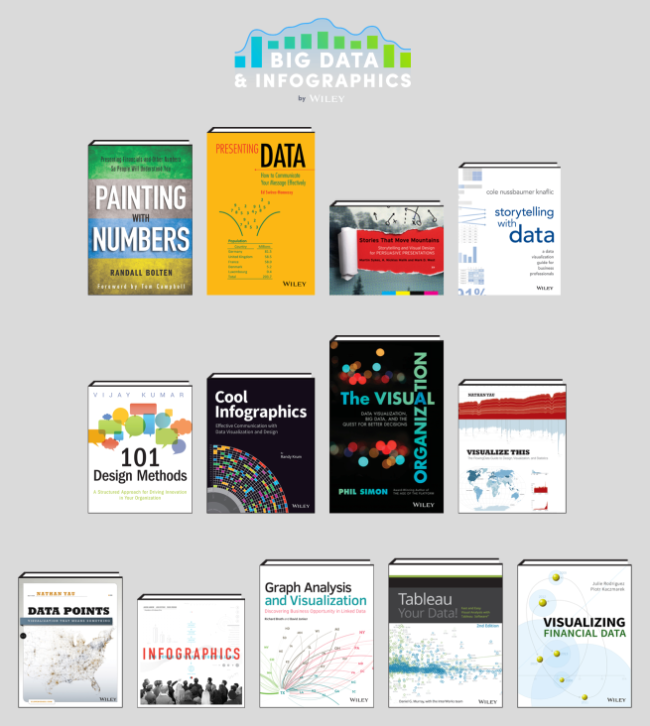
HUMBLE BOOK BUNDLE: BIG DATA & INFOGRAPHICS BY WILEY

We've teamed up with Wiley for our newest bundle! Get titles like 101 Design Methods: A Structured Approach for Driving Innovation in Your Organization, Cool Infographics: Effective Communication with Data Visualization and Design, and The Visual Organization: Data Visualization, Big Data, and the Quest for Better Decisions. Plus, your purchase will support Doctors Without Borders!

My book, Cool Infographics, is part of the deal, but I'm not getting a portion of the bundles. No affiliate link, no sponsorship fee, no kickbacks. I didn't even know about the deal until I noticed other people talking about it on Twitter! I'm just excited for my book to be included in the bundle for promotion!

(I did notice they used the dataviz design from my book cover for their promotional graphics)

It is a fantastic collection of books, and you should grab it while it's available! I have most of these on my shelf!


Tuesday
Apr182017

Big Data Bootcamp in Dallas May 5-7

I'll be giving my talk "What is Good DataViz Design?" at the Big Data Bootcamp in Dallas, May 5-7, 2017 at the Irving Convention Center. There will be other fantastic speakers as well, including Barrret Clark, author of the Data Visualization Toolkit, which is this month's giveaway!

For anyone interested in attending the entire event, get $200 OFF your registration cost by using the discount code DFWDATAVIZ and this LINK. The discount is good for registrations until April 27th.

Monday
Aug082016

23 Reasons to Get Excited About Data (Free eBook)

23 Reasons to Get Excited About Data IBM eBook

The team at IBM Watson Analytics has released a free, new eBook 23 Reasons to Get Excited About Data that explores the latest trends, practical applications and predictions about big data. I'm honored to have been included in the book as an expert on data visualization, along with all of the other IBM Watson Analytics applications!

These days, everyone’s tossing around the term “big data.” The term is nothing new – businesses have been collecting and analyzing data since the 1950s, before the two words were ever even uttered. Take a look back in time and you’re likely to see someone laboriously poring over a sheaf of spreadsheets, manually going through row after row to identify trends and gain insights.

More people are doing more things – personally and professionally – with data, and best practices will continue to develop. Self-serve, more democratized data analytics will Get Bigger, Get Faster and Get Cloudier!

I participated in an IBM video series about big data and visualization that you can see HERE. Data visualization is such an important conponent for humans to the analyze data, discover insights and communicate our findings to others! I'm very passionate about helping people understand how important data visualization truly is! Here are a couple of the thoughts I contributed to the ebook:

Humans are visual creatures. We can process visual information extremely fast, and are 6.5 times more likely to remember visual information than text. These are incredibly important facts when you are trying to communicate data to others. Use data visualizations to help your audience understand your information, and remember it later when it could influence their decisions or behavior. - Randy Krum

Data visualization is a language of context. You dramatically improve comprehension of your data when you design a visualization that puts your data into context for the audience. This can be a series of data points over time, or comparing your data to reference data to give the audience the perspective of how your data fits into a bigger picture. Storytelling with data is more than designing a chart, it’s the art of communicating specific insights from your data. - Randy Krum

Are you doing everything you could with your data? The future of data, along with predictive analytics and data visualization, is very exciting! Grab the free ebook now!

23 Reasons to Get Excited About Data IBM eBook Randy Krum Quote

Tuesday
Feb092016

O'Reilly Strata Conference Discount & Giveaway

The O'Reilly Strata+Hadoop World conference is coming up quickly on March 28-31 in San Jose, CA.

First, I have a discount code from O'Reilly that will get you 20% OFF the registration cost! Click this link, and use the code AFF20 during checkout to get the 20% discount.

Second, this month's giveaway is one free Bronze pass to the Strata conference! Register on the GIVEAWAYS page before 11:59pm CT on February 29, 2016 to be entered. I will randomly chose a winner on March 1st.

Monday
Dec212015

The Data Science Industry: Who Does What?

The Data Science Industry: Who Does What? infographic

Where's the "Data Visualizer"?!? The data science occupation is a very popular new career field that many companies are hiring; however, many of these titles are mistakenly used interchangeably. The Data Science Industry: Who Does What? infographic from The Data Camp Blog introduces some of the positions in this upcoming field.

In this infographic we compare the roles of data scientists, data analysts, data architects, data engineers, statisticians and many more. We have a look at their roles within companies and the data science process, what technologies they have mastered, and what the typical skill set and mindset is for each role. Furthermore, we look at the top employers that are currently hiring these different data science roles and how the average national salaries of these roles map out against each other.

Good, thorough source reference links. Needs a copyright statement and the URL to the infographic landing page on the DataCamp site so readers can find the original full-size version.

Found on MarketingProf

Monday
Oct202014

DFW Data Visualization & Infographics Meetup Group

DFW Data Visualization & Infographics Meetup Group

Announcing the launch of the local DFW Data Visualization & Infographics Group through Meetup.com. The group is free to join, and I’m partnering with SMU CAPE to provide us with a location to meet in the Dallas-Fort Worth area. If you’re in the area, please join and share the group with your friends and coworkers!  We strive to be a group of visualizers that includes a mix of marketers, entrepreneurs, managers, researchers, teachers, scientists and of course designers. Anyone that deals with presenting or communicating data.

I’m also looking for potential speakers and future event ideas, so let me know if you, or anyone you know, would be interested in engaging with this group. I would love to schedule a full range of beginner to advanced topics covering data visualization, data communication, infographics, data analysis, charts and graphs, presenting data, visual marketing, infographic resumes, content marketing and more!

Our first event will be November 12th in the SMU CAPE building (Continuing and Professional Education). I’ll give a presentation sharing many Innovative Ways Companies are Using Infographics, and the group will have an open discussion about the kinds of speakers, topics and events that we would like to see from this group in the future.

We are also looking for interested partner companies to help sponsor the group by providing refreshments, event locations or funding for future group events and speakers.

If you love the idea, but aren’t in the DFW area, check out these other great DataViz Meetup Groups across the country:

Also, check out The Universe of Data Visualization Meetups infographic which a great visualization design by Voilà Information Design in Montréal, Canada to find many more active groups.

The Universe of Data Visualization Meetups infographic


Tuesday
Oct222013

Strata Conf London Nov 11-13 - 20% Discount Code

O'Reilly Strata Conference: London, England


If you have any thoughts of attending the 2013 Strata Conference in London, England, the discount code “AFF20” will cut 20% off the registration price for readers of Cool Infographics!  Big data, visualization, privacy, science and business!  What’s not to love?!?

This is an expensive conference, so the 20% discount is a BIG deal; saving hundreds of dollars!  The 2013 conference will run from November 11-13, 2013 in London, England.

The future will be data-driven.  But who’s driving the data?

If it’s you—or it should be you—join us at Strata Conference to explore the opportunities made possible by the latest state-of-the-art data tools and analytic approaches.

Get the skills, tools, and technologies to make your data work successfully today—and the insights to plan for a data-driven future.


Tuesday
Apr302013

Drowning in Big Data [infographic video]

Infographic video from 2011 by The Economist that uses animated data visualizations to tell the story about growing Big Data.

Digital data will flood the planet—and help us understand it better

Found on Visual Loop