About
Randy Krum
President of InfoNewt.
Data Visualization and Infographic Design

Infographic Design

Infographics Design | Presentations
Consulting | Data Visualizations

DFW DataViz Meetup

Join the DFW Data Visualization and Infographics Meetup Group if you're in the Dallas/Fort Worth area!

Search the Cool Infographics site

Custom Search

Subscriptions:


Feedburner

The Cool Infographics® Gallery:

How to add the
Cool Infographics button to your:

Cool Infographics iOS icon

- iPhone
- iPad
- iPod Touch


Read on Flipboard for iPad and iPhone

Featured in the Tech & Science category

Flipboard icon

Twitter Feed
From the Bookstore

Caffeine Poster

The Caffeine Poster infographic

Entries in explanation (22)

Monday
Aug062018

An Introduction to Hydroponics

An Introduction to Hydroponics infographic

Hydroponics is a method of growing plants without soils. An Introduction to Hydroponics infographic goes over the benefits of using the technique, and a couple of different methods you could use. It is a great visual explanation of each setup and could really come in handy for any newbies interested in the field. Just make sure you read the section on what plants are best for hydroponics! You can find the full details at Green and Vibrant

Hydroponics is a dirt-free, space-saving, water-effective method of growing soilless.

This practice is not new. In fact, the earliest records of Hydroponics dated back to the ancient civilizations. And modern Hydroponics has been used widely in the commercial greenhouses as well as at home for over 30 years.

If you're just getting started with Hydroponics, or you're looking to hone and your knowledge and skills.

You come to the right place.

In this guide, you'll learn about the most important details about Hydroponics and all the basic knowledge to set up a year-round hydroponic garden of your own.

Read more at https://www.greenandvibrant.com


Found on Green and Vibrant

Monday
Jun042018

The Family Banners of Westeros

The Family Banners of Westerns infographic

The Family Banners of Westeros infographic from UK Feather Flags describes the meaning behind the designs on the flags from the popular HBO television show Game of Thrones.

Here is an excellent infographic that we have designed which takes a look at the meanings of the family banners of Westeros from the amazing television show called Game of Thrones. Learn all about the House Lannister banner, the House Stark banner, the House Targaryen banner and more by checking out this piece.

Thanks to Dave for sending in the infographic!

Monday
Jun132016

Choosing the Right Explainer Video

Choosing the Right Explainer Video infographic

Are you choosing the right explainer video? Infographic from Yudle takes a close look at the different types of videos that can be used to explain your business or product to audiences.

We all love an explainer video whether we’re informing ourselves on the mechanics of black holes, looking for an easier way to recruit new staff, or finding out how to fix that leaky tap. The question is, if you’re looking at creating an explainer video for your global organisation or startup company, do you know what you’re looking for?

This helpful infographic from our team here at Yudle Animation provides a guide for anyone who wants to get an animated explainer video made.

Great information, but too much text in this design. A few stats are also only shown in text, and should have been visualized to make a bigger impact on the readers.

The URL directly to the infographic landing page should be included in the footer of the infographic itself so readers can find the original, full-size version when people share smaller images of the infographic without linking back to the original.

Thanks to David for sending in the link!

Tuesday
Sep012015

How to Think Visually

How to Think Visually Using Visual Analogies infographic

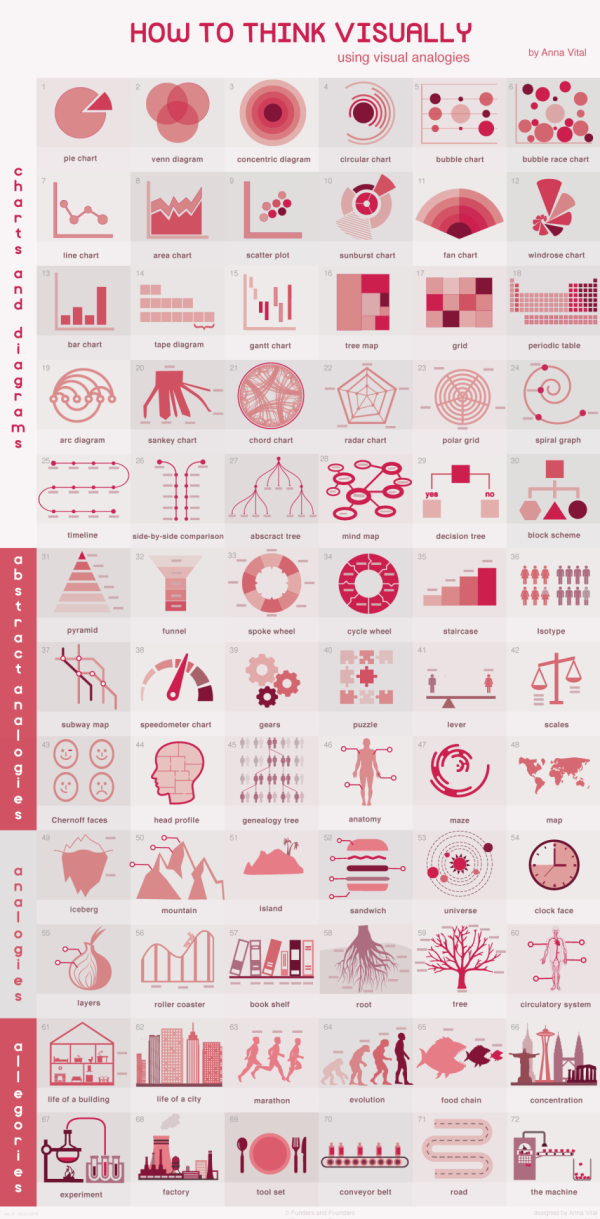
How to Think Visually Using Visual Analogies infographic from Anna Vital gives a great variety of examples for anyone to use when you create your own graphics. It begins with the most recognizable visuals, circle graphs and diagrams. Further down are abstract analogies. They are reminiscent of physical objects, but they are simplified and abstract. Next, we have regular analogies that look like the physical objects you are familiar with. The final category are allegories. These are stories, or a series of analogies. The key is that these stories are familiar enough that we don’t have to retell them, but we should analogize every part of them.

Most research in cognitive science explores how we see things but little research is done on how we understand what we see.

Understanding is the ultimate test of how good your visualization is. So how can you make people understand? Show something familiar and analogize. If you know nothing else about visualization but pick the right analogy you are more than half way there. This is what a professional designer does - and there is no substitute for analogies.

How do you choose the right analogy? In this grid I organized analogies from the abstract down to the more detailed. I grouped them by similarity in shape. The goal is to enable you to quickly see the possibilities and “try them on” your information. With time you’ll be able to do all of this in your head. But for now this is a shortcut. 

As part of the infographic landing page, Anna has included a text description of each visual analogy. For the story on each graphic, read more at anna.vc

Thanks to @DR4WARD for sharing on Twitter!

Tuesday
Jun032014

What the Heck is a Bitcoin

What the Heck is a Bitcoin infographic

The Bitcoin is the first widely traded digital crypto-currency that is decentralized and unregulated. Find out more from the What the Heck is a Bitcoin infographic by SumAll.

Exchanges rising and falling, disputes over inventorship, wild accusations, rapid inflation and deflation, anger, confusion, and sadness. We’re talking about everyone’s favorite unicorn money: Bitcoin. Bitcoin’s six year road to the spotlight has been fraught with more turbulence than a flight through a hurricane in a Learjet, and since mid 2013 it’s only gotten more crazy.

SumAll has just added bitcoin exchanges, mining pools, and mining workers to our range of data platforms to allow our customers to keep tabs on the market and the progress of mining pools. For those who own or mine bitcoins, SumAll is now their one-stop-shop for keeping tabs on all things bitcoin, monitoring their mining efforts, and keeping a close watch over their investments.

For those who don’t own or mine bitcoins, chances are you have no idea what we’re talking about.

If you have an interest in bitcoins and don’t want to be that out-of-the-loop guy at the party who just keeps nodding his head in agreement and staring at your drink, we made this handy infographic to explain a few basic concepts to get you started. Soon you’ll be buying all your pizza–and rent–with bitcoins

Good design that tells a story to the audience, but this one uses too much text.  I wish they had included some data visualizations about the difficulty to mine bitcoins or the strength of the encryption.  The one dataset they did visualize was the value of bitcoins from Jan-Dec 2013.  The value changes so rapidly, including that one data visualization can quickly make the infographic feel old and out-of-date.  For a longer Online Lifespan, the design should focus more on the long-term, consistent information about bitcoins and not the most recent trending data.

This is a good example of the company, SumAll, using an infographic as part of their email marketing campaign.  The infographic was included as the highlight in one of their email blasts to customers with a link back to the full design on their website!

Thursday
Dec122013

How To Boost Recovery After An Injury

How To Boost Recovery After An Injury infographic

How To Boost Recovery After An Injury from BodyHeal.com.au is a visual explanation infographic that uses illustrations and icons to explain the R.I.C.E. injury treatment process.

R.I.C.E. treatment is an acronym for: rest, ice, compression, elevation. It is commonly used to speed up healing and reduce pain and swelling caused by mild-to-moderate injuries, such as sprains, strains, and bruises.

The design uses a good combination of text explanations, character illustrations, icons and story layout to educate the audience about injury treatment.  Short text explanations effectively keep the information consumption quick and easy.

Some of the text is too small when reduced to fit on a blog (like this one), so the design should have included the URL back to the infographic landing page so readers can easily find the full-size original version.


Tuesday
Oct012013

What Are Anxiety Disorders?

What Are Anxiety Disorders? infographic

What Are Anxiety Disorders? is a very detailed infographic from Global Medical Education to help people understand the history, issues and treatments of anxiety disorders.

Anxiety disorders are the commonest psychiatric illnesses globally. There is no test for anxiety disorders like panic disorder, PTSD,OCD or social anxiety disorder and the diagnosis is based on a good history and examination. The signs and symptoms of anxiety disorders are often missed or explained away. Anxiety disorders are also commonly comorbid with other psychiatric disorders particularly mood disorders.

There is no cure for anxiety disorders but very effective treatments are available with a good evidence base. The treatments for anxiety disorders include medications like benzodiazepines, SSRIs or SNRIs or other new generation antidepressants, atypical antipsychotics, as well as augmentation therapies.  Several proven therapies are also efficacious in patients with anxiety disorders. These include cognitive behavior therapy, relaxation training, and prolonged exposure therapy. Yoga and meditation have also demonstrated benefits.

There is a lot of information in this design.  It’s all good, but packing this much information into one infographic is a risk.  On one hand, all of the major information in included in one place.  On the other hand, an infographic this big with this much text will discourage many readers that are looking for a fast and easy explanation.  The overall design can be intimidating to readers that are evaluating the amount of time they would need to invest in understand the information before they start reading.  Many will leave before reading any of the infographic.

Thanks to David for sending in the link!

Friday
Aug302013

Infographic Cookbook - Picture Cook

Picture Cookbook infographic

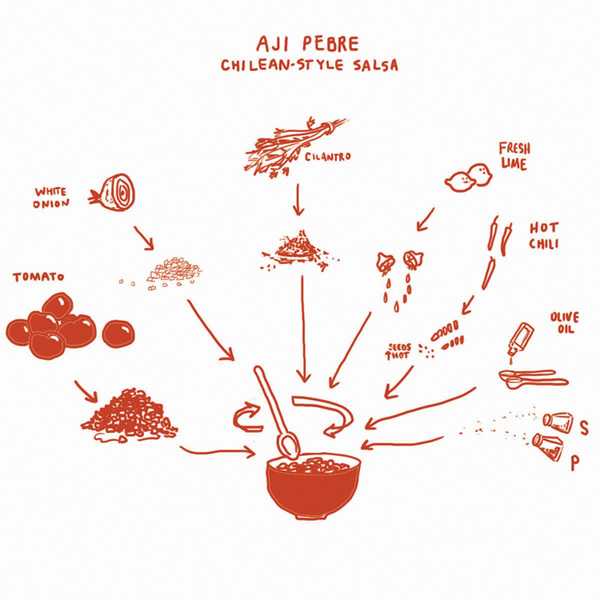
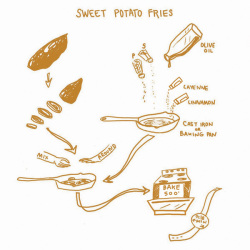
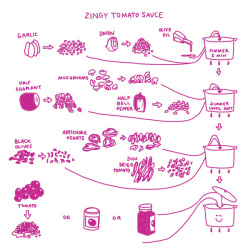
A new way to take directions for cooking, the Picture Cookbook infographic from Katie Shelly. It is an easy step by step visual explanation design that will get you to the desired tasty product, with very little use of words!

The following recipes are not intended as precise culinary blueprints. Instead they are meant to inspire experimentation, improvisation and play in the kitchen.

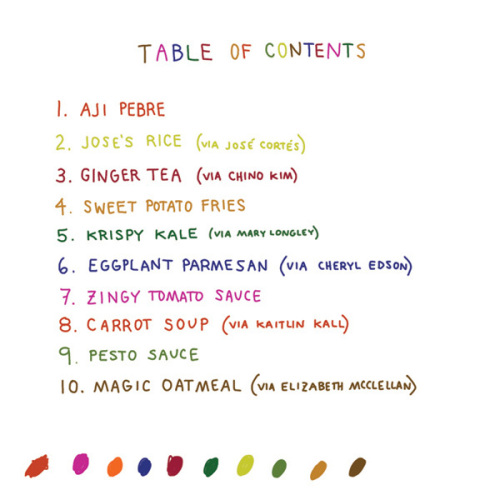
Great design work by Katie to create recipes as visual explanations.  The hand-drawn style also helps reinforce the flexible methods.  They aren’t strict, rigid recipes with sharp images and corners, but instead are more casual which allows for interpretation and change.  I love the color-coding for easy navigation within the book too.

Found on Fast Company

Available soon for purchase in print in October 2013.  I’ve already pre-ordered my copy.

Thursday
Aug222013

Worldwide ATM Cyber Attack

World Wide ATM Cyber Attack infographic

The Worldwide ATM Cyber Attack infographic from 41st Parameter talks about the international internet heist that stole $45 Million in May 2013. The infographic centers around how they did it, what they took, and then how it could of been stopped.

Most people gasped at today’s headlines about the massive, $45 million ATM heist, which was engineered by a highly-organized gang of cybercriminals. Consumers and banking executives alike have the same worry today: Is their money and account information safe?

Here at 41st Parameter, the news simply highlighted what we already knew – financial institutions are extremely vulnerable to increasingly sophisticated cyber criminals who, as in this case, are able to steal data from pre-paid ATM cards and then quickly loot machines across the globe.

Most banking systems today are connected directly or in-directly to the Internet. This brings about a multitude of unintentional exposures, all of which allows criminals to exploit them to their advantage.

Given the scale of the global credit card networks, it is almost impossible to detect every kind of attack. Similar to fighting terrorism, you can be successful in preventing something 100 times, but the bad guys only need to be successful once.

Banks and financial institutions should use all of the available data and fraud detection solutions to fight fire with fire – and build better defenses for the 21st Century. Indeed, the shocking $45M price tag for banks should be a call to action to put better protections in place. This attack is NOT the last one, and if the modus operandi proves to be successful, crooks will exploit it time and again.

Good use of an infographic as a step-by-step visual explanation.  Good source listing with the URL directly to the detailed news article.  The footer should include a copyright statement and the URL to the original infographic landing page so people can find the full-size version after seeing the infographic on other sites. 

Thanks to Caroline for sending in the link!

Thursday
Jul252013

Inside the Courtroom

Inside the Courtroom infographic

Going to court is no laughing matter. But the Inside the Courtroom infographic from Livesay & Meyers balances seriousness with humor as it lays out the blueprint of a courtroom, then tells some funny stories about actual things said in court.

Going to court for the first time can be an intimidating experience. Whether you are facing criminal charges or find yourself in court in a divorce or custody case, remaining calm in court can really help you make your most effective case. We put together the infographic below to help you understand all the different parts of the courtroom, so you can feel at ease on your day in court. This infographic explains who people are, what they do, and where they sit. We’ve also included some interesting facts about courtrooms, and funny quotes from actual court cases.

Our experienced attorneys feel right at home in the courtroom– hopefully this information will allow you to also be at ease in front of the judge or jury.

Thanks to James for sending in the link!