About
Randy Krum
President of InfoNewt.
Data Visualization and Infographic Design

Infographic Design

Infographics Design | Presentations
Consulting | Data Visualizations

DFW DataViz Meetup

Join the DFW Data Visualization and Infographics Meetup Group if you're in the Dallas/Fort Worth area!

Search the Cool Infographics site

Custom Search

Subscriptions:


Feedburner

The Cool Infographics® Gallery:

How to add the
Cool Infographics button to your:

Cool Infographics iOS icon

- iPhone
- iPad
- iPod Touch


Read on Flipboard for iPad and iPhone

Featured in the Tech & Science category

Flipboard icon

Twitter Feed
From the Bookstore

Caffeine Poster

The Caffeine Poster infographic

Entries in data visualization (16)

Friday
Jan262018

Top Reasons Startups Fail

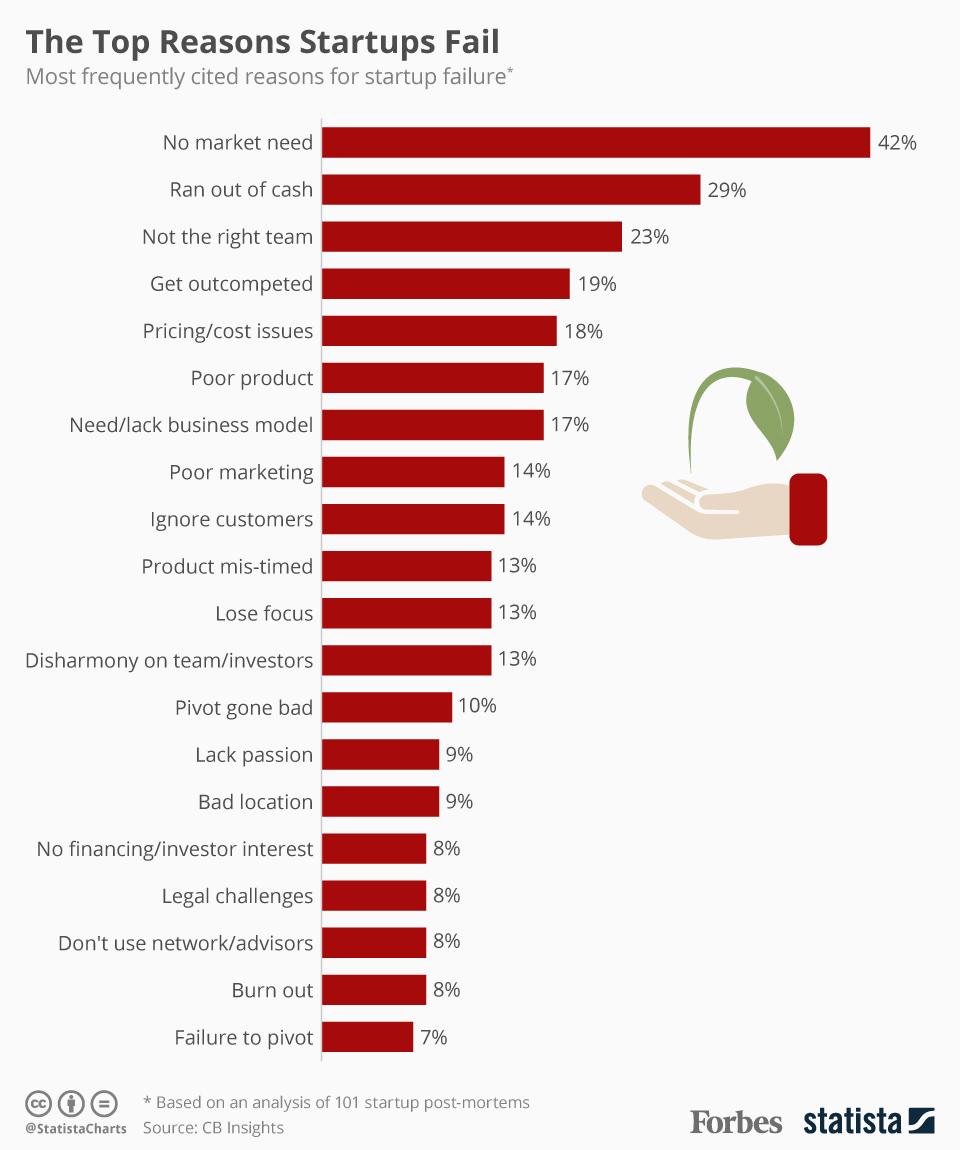
The Top Reasons Startups Fail infographic

It takes more than just a good idea for a startup to succeed. Forbes analyzed 101 failed startups and found that The Top Reason Startups Fail, was the lack of need for their product. Launching a startup takes a lot of preparation and research. Make sure you are fully prepared before starting your own.
Down through the years, some startups really struck gold. When Accel Partners invested $14.8 million in a website called "thefacebook.com" back in 2005, they made a return of $5.6 billion - 378 times their original outlay. More often than not, however, startups tend to fail brutally. According to CB Insights, 70 percent of upstart tech companies fail, usually about 20 months after first raising financing. The failure rate is even worse for consumer hardware startups with 97 percent of seed crowdfunded companies failing or turning into "zombies".

CB Insights delved into a compilation of startup failure post-mortems by founders and investors to shed light on why many ventures grind to a halt. The following infographic shows the top-20 cited reasons for failure with products or services that do not serve a market need in first position. Not all startups are lucky enough to attract financial backing as lucrative as Accel Partners' investment in Facebook; in 29 percent of cases, they simply run out of cash. Having the right people onboard from the outset can make a massive difference when it comes to success and ploughing ahead without the right team is the third most frequently cited reason for a startup ending in failure.

For a good infographic, sometimes all you need is a nice clean chart. This design uses a simple bar chart to clearly visualize the data. No gridlines. No axis titles. No value axis labels. No chart legend! It's a horizontal bar chart to allow room for the text labels to be easily read by the audience. All of the information needed is displayed directly in the chart itself.

Found on Forbes.

Monday
Apr032017

The Data Visualization Toolkit signed book giveaway

For the April Giveaway, I have a signed copy of the Data Visualization Toolkit by Barrett Clark.  Register on the Giveaways Page by April 30th to be entered. 

From Amazon:
Data Visualization Toolkit is your hands-on, practical, and holistic guide to the art of visualizing data. You’ll learn how to use Rails, jQuery, D3, Leaflet, PostgreSQL, and PostGIS together, creating beautiful visualizations and maps that give your data a voice and to make it “dance.”
 
Barrett Clark teaches through real-world problems and examples developed specifically to illuminate every technique you need to generate stunningly effective visualizations. You’ll move from the absolute basics toward deep dives, mastering diverse visualizations and discovering when to use each. Along the way, you’ll build three start-to-finish visualization applications, using actual real estate, weather, and travel datasets.
 
Clark addresses every component of data visualization: your data, database, application server, visualization libraries, and more. He explains data transformations; presents expert techniques in JavaScript, Ruby, and SQL; and illuminates key concepts associated with both descriptive statistics and geospatial data. Throughout, everything is aimed at one goal: to help you cut through the clutter and let your data tell all it can.

Barrett recently gave a talk called "Making Data Dance" at the DFW DataViz Meetup event, and I had a chance to ask him a few quesitons:

What does it mean to make your data "Dance”?

Barrett Clark: I think data wants to tell a story. Our job is to figure out what that story is and how to best present it. Seeing the data in a visual way can make it come to life and dance.


Who is the book written for?

Barrett Clark: Data Visualization Toolkit focuses on looking at data from the perspective of a web developer. More specifically, I speak from the perspective of a developer writing Ruby on Rails apps. There is a fair amount of JavaScript and SQL throughout the book, and I try to explain what I am doing throughout the text. My goal was to make a book that is accessible to anyone while still giving more experienced developers something valuable.


Can readers get all of the data and code you reference in the book?

Barrett Clark: Absolutely! There are 3 different applications that readers will build throughout the book. The code and data for the applications are available on GitHub at http://DataVisualizationToolkit.com. I also have checkpoints throughout the text where you can see what the application should look like at that point. Those are enumerated in the README for each application.


Why do you prefer PostgreSQL as your database platform of choice?

Barrett Clark: I have worked with several databases. PostgreSQL, or Postgres as it is often called, is by far my favorite. It is a robust database that is easy to use, has a wide array of functions and data types, and is also extendable. You can easily add to the functionality of a Postgres database with an extension. In fact, the core database ships with dozens of extensions that you don't need to install. PostGIS, which allows you to store geospatial data and perform geospatial queries, is one of my favorite extensions.


Why is the database and transforming your data before your create the visualizations so important?

Barrett Clark: I have seen very few data sets where you can take data directly from the database into a chart -- especially with transactional data. You can perform the data transformations in the database using SQL, in the application server using the application's prorgamming language, or in the browser using JavaScript. Databases are really good at dealing with data, so I encourage people to not be afraid to write SQL to pull out the data in the format that you need it.


What are the challenges for visualizing data on websites?

Barrett Clark: Speed. When you have a lot of data you need to be thoughtful about how quickly you can get the data and display it in a meaningful way. This may require some additional setup to store data for reporting in a separate format so that you don't have to do the transformations in real time. Another challenge is that you have no control over the end user's viewing experience. Something that you think looks brilliant on your laptop may look awful on someone else's screen.


What’s different about visualizing geospatial data?

Barrett Clark: Geospatial data is a lot of fun! When you add location to the mix you open up a whole new arena of things that you can do visually with your data, and questions that you can ask of the data. I love maps. I take readers through the creation of one of my favorite types of map -- the choropleth. That's where you color areas (counties, states, etc) in a map based on the data.


Are your visualizations mostly static or interactive data visualizations?

Barrett Clark: There are some mouseover effects in my visualizations that help add more context to the graph or highlight something.


What are your thoughts on D3.js and its future?

Barrett Clark: I love D3, and I also love what Mike Bostock has done to build such a deep assortment of examples. Between the examples and the documentation I find D3 really fun to work with. The library is also very actively maintained. As soon as I shipped Data Visualization Toolkit a new version of D3 dropped. There are branches in all 3 sample project repositories on GitHub with the updates required for D3v4.


Are you speaking at any upcoming presentations or webinars?

Barrett Clark: In the past few months I've spoken at PGConf Silicon Valley in San Francisco and RubyConf Australia in Melbourne. I'll be taking a break from travel for a bit and focusing on local meetups. I try to get out to the Dallas Ruby meetups whenever possible.


What’s the best place to follow you online?

Barrett Clark: I'm @barrettclark on Twitter.

Wednesday
Mar012017

A Visual Explanation of Gerrymandering

A Visual Explanation of Gerrymandering

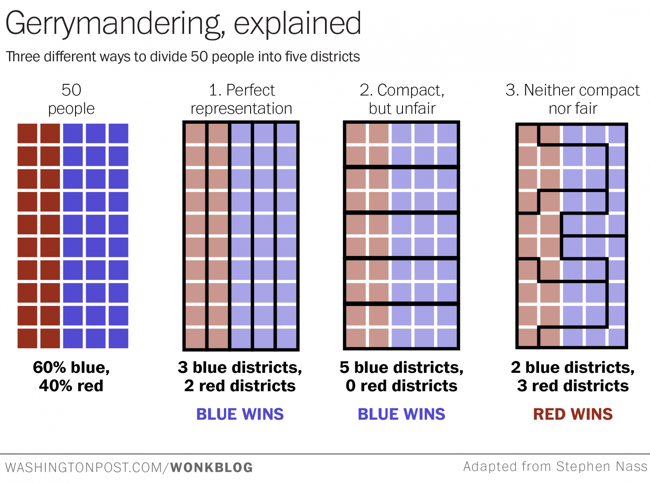
The Washington Post recently published this simple but very effective visual explanation of Gerrymandering: How to steal an election: a visual guide

Gerrymandering -- drawing political boundaries to give your party a numeric advantage over an opposing party -- is a difficult process to explain. If you find the notion confusing, check out the chart above --  adapted from one posted to Reddit this weekend -- and wonder no more.

Suppose we have a very tiny state of fifty people. Thirty of them belong to the Blue Party, and 20 belong to the Red Party. And just our luck, they all live in a nice even grid with the Blues on one side of the state and the Reds on the other.

Now, let's say we need to divide this state into five districts. Each district will send one representative to the House to represent the people. Ideally, we want the representation to be proportional: if 60 percent of our residents are Blue and 40 percent are Red, those five seats should be divvied up the same way.

This is a great example of using data visualization to explain a complex process. The use of the matrix of squares to represent people simplifies the context and keeps the audience attention focused on the groupings.


Wednesday
Nov232016

Better Presentations by Jon Schwabish: Interview & Giveaway

Better Presentations by Jon Schwabish: Interview & Giveaway

Better Presentations: A Guide for Scholars, Researchers, and Wonks is a great new book by Jon Schwabish from the newly redesigned PolicyViz! I'm especially excited about the chapter all about data visualization in presentations!

This December, I am giving away one signed copy of Better Presentations! Register on the Giveaways Page by December 31st to be entered.

 Whether you are a university professor, researcher at a think tank, graduate student, or analyst at a private firm, chances are that at some point you have presented your work in front of an audience. Most of us approach this task by converting a written document into slides, but the result is often a text-heavy presentation saddled with bullet points, stock images, and graphs too complex for an audience to decipher―much less understand. Presenting is fundamentally different from writing, and with only a little more time, a little more effort, and a little more planning, you can communicate your work with force and clarity.

Designed for presenters of scholarly or data-intensive content, Better Presentations details essential strategies for developing clear, sophisticated, and visually captivating presentations. Following three core principles―visualize, unify, and focus―Better Presentations describes how to visualize data effectively, find and use images appropriately, choose sensible fonts and colors, edit text for powerful delivery, and restructure a written argument for maximum engagement and persuasion. With a range of clear examples for what to do (and what not to do), the practical package offered in Better Presentations shares the best techniques to display work and the best tactics for winning over audiences. It pushes presenters past the frustration and intimidation of the process to more effective, memorable, and persuasive presentations.

Everyone should follow Jon Schwabish on Twitter (@jschwabish) and check out all the great resources on PolicyViz!


Jon answered a bunch of questions I sent him about visualizing data and the new book:

Who is the book intended for?

Jon Schwabish: I wrote the book for people who deliver data-rich content—researchers, scholars, analysts—anyone who works with data and who needs to present it to an audience. In my experience, many people who work with data and conduct research simply take their written reports and convert them to presentations—they copy their graphs and tables and paste them into a slide, and turn their text into bullet points. But there is a better way and it starts with recognizing that a written report and a presentation are two fundamentally different forms of communication. The goal of this book is to help presenters all the way through the process: From presentation construction and design, to building the presentation, to ultimately delivering the presentation.

What makes presenting so different from writing?

Jon Schwabish: The differences between writing and presenting are clearest when you think carefully about the audience. When your reader sits down with your paper, she has the opportunity to read the notes and footnotes, decipher the labels on your charts, even perhaps work through your equations. When you present, however, your audience does not have that opportunity: They are bound to your pace and content. If you fill your slides with text and bullet points, equations, and complex, detailed graphs, your audience will strain to follow you and understand your message.

There are also (or at least there should be) similarities between the two—at least when it comes to your preparation. We are all taught in grade school to set out an outline when we write a book report. Yet, we rarely do this when it comes to presentations. In the book, I propose that presenters develop their presentation before they start making slides. I walk through this outlining process and provide a worksheet that readers can use to help them outline and develop their presentation.

What should readers expect to learn and apply to their own presentations?

Jon Schwabish: The book takes you through the entire process of planning, designing, and delivering your presentation by following three guiding principles:

  • Visualize your content. We are better able to grasp and retain information through pictures than through just words, so visualize your content when you can; this includes text, statistics, and numbers whenever possible.
  • Unify the elements of your presentation. This means consistency in your use of colors and fonts, format of your slides, and integrating what you say with what you show.
  • Focus your audience’s attention where you want it at all times. Instead of putting up as much information as possible on every slide, keep your slides simple and free of clutter so that you can direct your audience’s attention. Here, I demonstrate a technique I call Layering—presenting each piece of information on its own. Together, the points come back to the original, but are now presented in more effective way for the audience. 

These three guidelines are applied to different slide elements such as text, images, and data visualizations. in the latter sections of the book, I talk about tools and technologies to create and deliver presentations.

What are the key mistakes people make in their presentations?

Jon Schwabish: I think many people view their presentation as a simple translation of their written report to slides, but again, a presentation is a fundamentally different form of communication than a report. Presenters need to put their audience first—think about how difficult it’s going to be for them to absorb your content and buy into your message as you zip through bullet after bullet, slide after slide, dense table after table.

The other big mistake people make is to not practice their presentation before they deliver it. You can practice your 15-minute conference presentation four times in an hour, which is probably four more times than anyone else at the conference. And it will show! The more you practice—actually, rehearse is probably a better term—the more familiar you will be with your content, which will reduce the need for text- and bullet-point heavy presentation. Practicing moves you away from the natural inclination to include lots of text on your slides. 

 Why is visualizing data and information in a presentation so important?

Jon Schwabish: There is a long research history that demonstrates we are more likely to grasp and retain information through pictures than just through words (typically known as the “Picture Superiority Effect”). By visualizing information, you make it easier for your audience to grasp your content and remember it. Visualizing data may be even more important in a presentation because, again, your audience is bound to your pace and how you present your data through graph choice, color, and layout.

There is a long chapter in the book on how to create effective data visualizations for presentations. I walk through basic data visualization principles and outline ways to effective communicate those data in a presentation. I demonstrate ways you can apply the Layering technique to graphs, by showing one data series at a time. But you don’t need to just Layer data—if you’re showing a more complex graph (or perhaps a graph type that is new for your audience), for example, you can start by just showing and defining the axes, and then sequentially add your data. In this way, you have defined the graphic space for the audience so they are prepared for what comes next.

What are your thoughts on animated slide transitions and/or clicking to reveal different pieces of information on a slide? 

Jon Schwabish: I’m generally not a big fan of animated slide transitions, especially the good ol’ Blinds and Checkerboard in PowerPoint and other tools. They tend to look cheesy and immature. That being said, I have found some of the “morphing” animations—Magic Move in Keynote and Morph in the newest versions of PowerPoint—to be quite useful. Say, for example, you want to walk your audience through an infographic. With these morphing animations, you can show the entire infographic and then seamlessly zoom in and scroll through the infographic on the screen. These sorts of techniques can be especially useful when you need to show the audience the full visual and then zoom in so they can see the details.

You also recently gave your presentation at a TED event. Can you share your experience?

Jon Schwabish: I spoke at the TEDxJNJ (Johnson & Johnson) event in Philadelphia. I was invited months earlier and even though I basically knew what I wanted to present right off the bat, it was a long haul to get the message just right and get the slides in great shape. I spent countless hours refining my message (especially the beginning and end), tweaking the slides, and practicing the talk.

When you’re invited to give a TEDx talk, you’re assigned a ‘coach’ who helps you develop your talk and design your visuals. We had weekly calls as I kept tweaking my message, content, and slides; I would send her audio recordings of my practice runs; and we would walk through slide design options. Just having someone who knew my content, my slides, and my struggles was invaluable. I typically try to rehearse my presentations in front of a live audience (and many of my co-workers at the Urban Institute sat in as I practiced the TEDx talk), but this experience really made me realize how valuable it is to have someone to help bounce ideas, concepts, and design off of.

Standing on that big red circle with the TEDx sign behind me was an incredible experience, and I’m thankful that people find my message value and of interest, and that I can communicate that to them in an engaging way.

Is there a website to go along with the book?

Jon Schwabish: Yes, my newly-redesigned website PolicyViz, has a whole section dedicated to the book (http://policyviz.com/better-presentations/).In that section of the site, you will find presentation, design, and data visualization resources including blogs, books, and tools. I’ve also included a section of Book Materials that you can download for your own use. In that section, I’ve included a Better Presentations Supplies Checklist that includes the technical things you may need when you go out and present. I’ve also included a Better Presentations Worksheet (the focus of Chapter 1), which will help guide your outline and organization. I’ve also included downloadable slides, icons, color palettes, and more.

Where’s the best place to follow you online?

Jon Schwabish: You can follow me on my newly-redesigned website, PolicyViz.com, which now hosts my blog, podcast, shop, and HelpMeViz project. I’m also active on the Urban Institute blog, Urban Wire, and have a researcher page there as well. I’m most active on Twitter, and you can easily find me there @jschwabish.


Jon's Bio

Jon Schwabish is an economist, writer, teacher, and creator of policy-relevant data visualizations. He is considered a leading voice for clarity and accessibility in how researchers communicate their findings. His new book Better Presentations: A Guide for Scholars, Researchers, and Wonks helps people improve the way they prepare, design, and deliver data-rich content. He is on Twitter @jschwabish


Thursday
Oct272016

9 Great DataViz & Infographics Tools with Education Discounts

Data visualization and data literacy are necessary life skills, and you should start developing them now! Whether you need to make a diagram for a Science project, a presentation for your History class, or a chart to solve that Math problem, you should start learning how to use data visualization tools while you’re in school. These tools are being used in classrooms from elementary school up through colleges and universities. While many online design tools offer free trials, these tools offer exclusive educational prices for students, teachers and educators to give them the means to more easily visualize information at a great price.

Here I share some of today’s most popular online data visualization and infographic tools, all offering educational prices. Because these are all online tools, they are all cross-platform, making them great for any computer a student may have; Windows, Mac or Linux. Follow the links to find the current education pricing deals!

I love that all of these online tools are helping to improve data literacy for students and educators all over the world! Which are you favorites? Any more online tools with education pricing plans for students and teachers that I missed?


Visme

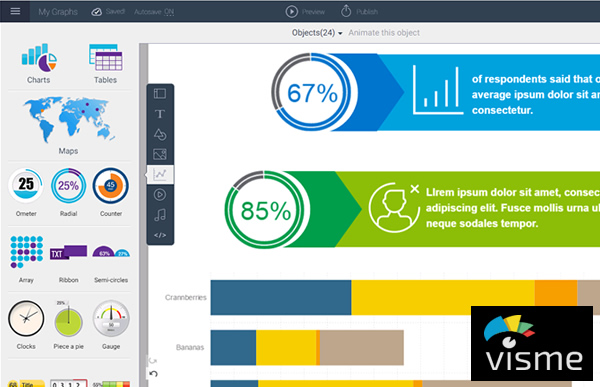
Visme is an online tool used to visually present your ideas in the form of infographics, presentations, reports, and much more. Visme has a built-in charting tool gives you the power to easily transform your data into visual content and with their easy-to-use editor. Hundreds of fonts, millions of free images, and thousands of quality icons for use in your designs. Share your designs online with a direct link, post on social media, embed on a website, or download for offline use.

Contact for educational pricing: http://support.visme.co/


Infogram Education Pricing

Infogr.am

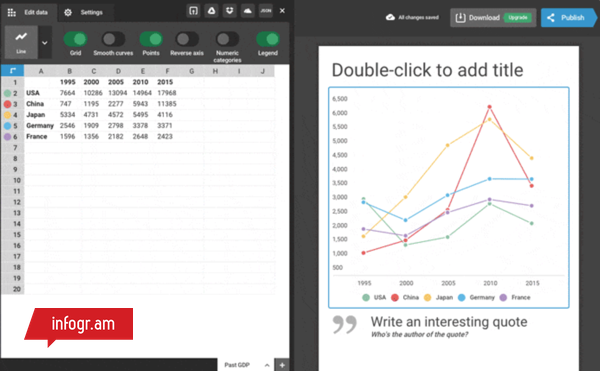
With Infogr.am, you have the power to make your data look its best. Users can easily create interactive charts and graphics that require zero coding. And to make sure your data is always up-to-date, you have the option to connect your chart to live sources like Google Sheets a Dropbox file, or a JSON feed. Educators can create a team account for an entire class.

Contact for educational pricing: https://infogr.am/education


Piktochart Education Pricing

Piktochart

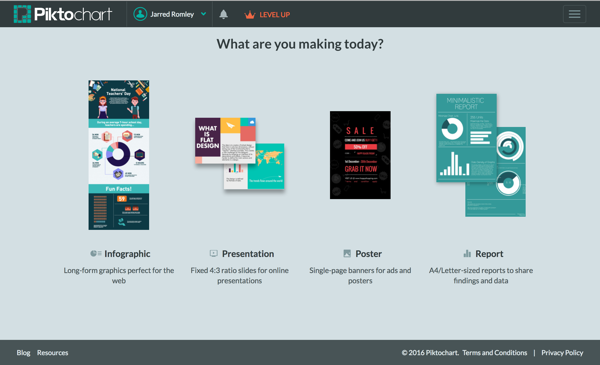
Take your visual communication to the next level with Piktochart, an easy-to-use infographic maker. Create your charts by importing your data from a Microsoft Excel file or a Google spreadsheet. With a library of hundreds of professionally-designed templates, creating infographics, reports, posters, and presentations has never been easier. Educational pricing for individuals or whole classrooms.

Individual and classroom prices: https://piktochart.com/pricing/education/


Creately Education Pricing

Creately

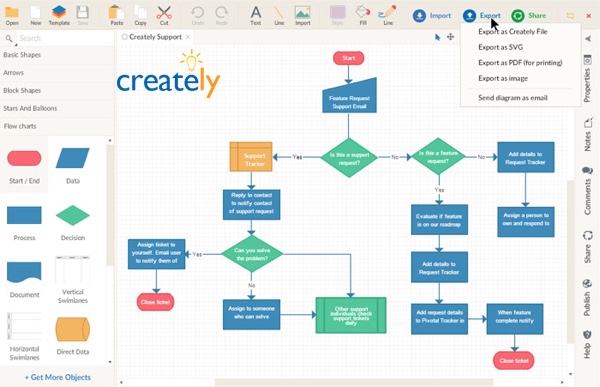
With Creately, you can easily make beautiful diagrams in no time. Flow charts, mind maps, organization charts, Venn diagrams, Gantt charts, network diagrams and more. Thousands of ready-made subject-specific templates and over 40 types of diagrams with specialized shape sets are available to make sure your diagram looks its best. And real-time online collaboration allows you to work with fellow students.

Contact for educational pricing: http://creately.com/diagram-products#education


Venngage Education Pricing

Venngage

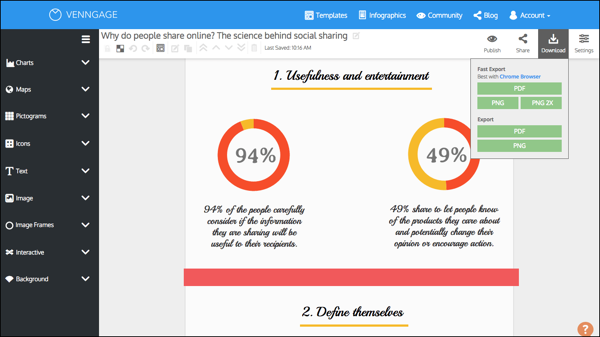
Venngage allows users to create infographics in just three easy steps: choose a template, add charts and visuals, and customize your design. In just minutes you can create a visual story in the form of posters, social media posts, and infographics. Post your final designs on social media, embed on websites, or download as an image or PDF file.

Register for a classroom Education account, includes 35 users: https://venngage.com/education-pricing/


Prezi Education Pricing

Prezi

Prezi is the tool for creating engaging and memorable presentations with the charting tool, editable images, and embedded videos. Give your presentations online or offline, using the library of templates as your starting point. Prezi presentations are built on an open canvas and spatial movement transitions that are unique and easy-to-use.  

Choose an educational pricing package: https://prezi.com/pricing/edu/


Lucidchart Education Pricing

Lucidchart

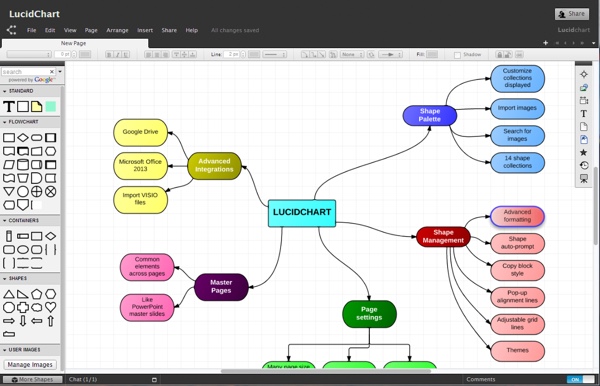
Lucidchart is an online diagramming tool for everyone. You  can create flow charts, Venn diagrams, mobile app mockups, network diagrams and more using the extensive shape libraries, or perform a Google image search right in the editor. You can even add a YouTube video to your diagram!

FREE accounts for students and teachers: https://www.lucidchart.com/pages/usecase/education


Easelly Education Pricing

Easel.ly

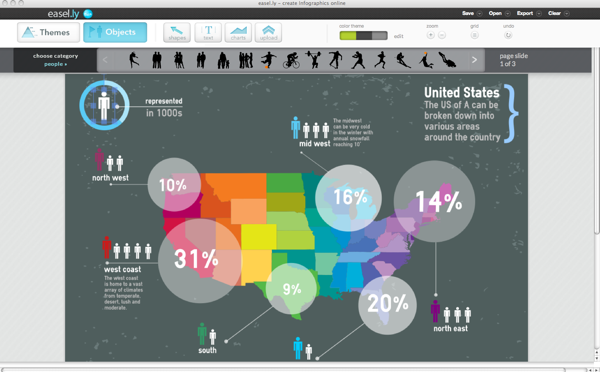
With over thousands of infographic templates to chose from, Easel.ly makes creating and sharing your visual ideas easy. The drag-and-drop interface helped Easel.ly win the Best Websites for Teaching and Learning Award from the American Association of School Librarians (AASL) in 2013. Create your infographic, and then publish online or download a high-resolution file for offline use. Check out their free ebook: How to Use Easel.ly in your Classroom (https://www.easel.ly/blog/infographicsforeducation)

Contact for educational pricing: https://www.easel.ly/contactus


Plotly Education Pricing

Plot.ly

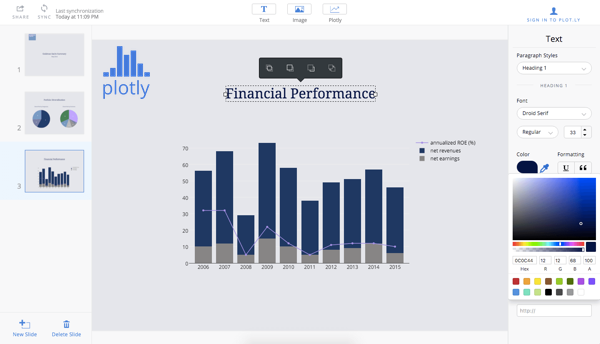
Plot.ly is a higher-level, advanced data visualization platform that helps data science, engineering, and analytics students create create informative graphics using an open source visualization library and an online chart creation tool. With Plotly, users can easily import data, create charts, and share their findings by embedding them on a website, exporting them, or creating presentations and dashboards. Create technical visuals using tools and APIs for D3.js, Python, R, MATLAB, Excel and more.

Student pricing for Professional features: http://marketing.plot.ly/education.html


Article was reposted by The Huffington Post

Friday
Sep162016

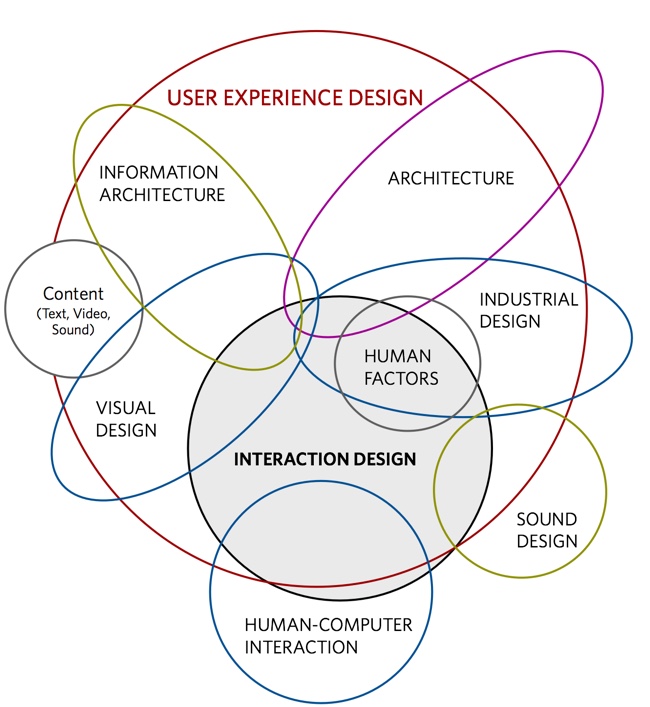
Mapping the Disciplines of User Experience Design

Mapping the Disciplines of User Experience Design infographic

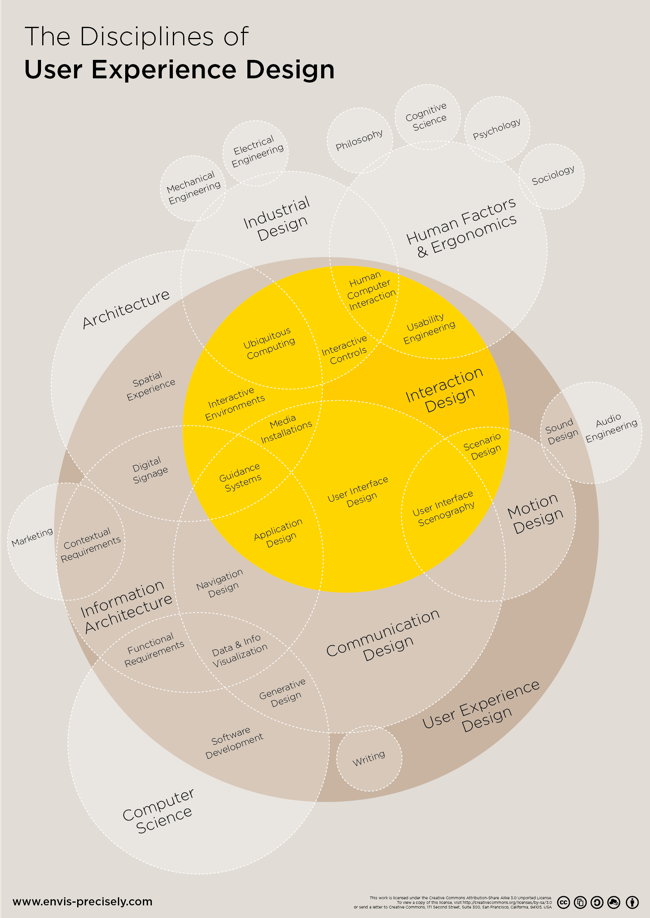
Mapping the Disciplines of User Experience Design is an uber-complex Venn Diagram. The original concept by Dan Saffer at KickerStudio was given a clean DataViz overhaul by Thomas Gläser who was with envis precisely at the time.

An infographic approach to visualize all players of the interactive field

. It shows the different areas and how they connect and overlap.

The diagram is based on the work of Dan Saffer

It's a couple years old, but all of the files were published on Github under Creative Commons 3.0 Attribution-ShareAlike so anyone can Adpapt or Improve the design going froward.

You can see the original concept from Dan Shaffer here:

Found on FastCoDesign

Monday
Aug222016

Customizing 360 Photos - I Need Your Votes

Customizing 360 Photos for Digital Marketing

I NEED YOUR VOTES!

SxSW 2017 PanelPicker is open until September 2nd, and this is the community voting portion of the SxSW conference. This is a big part of getting accepted to speak at SxSW, and I need your votes to help support two proposals. My talks proposed for the 2017 conference relate to editing and publishing 360° photos with data visualizations and graphic elements for digital marketing. This is a new content format that can also take advantage of data visualizations and infographics!

Now that Facebook natively displays immersive 360° photos, you can use 360 photography to promote your product, service, and/or brand. However, just publishing raw images is already behind the curve. In this presentation I will teach you how to embrace this technology and harness its reach. You will learn how to inject your brand, call outs, data visualizations and graphic elements to make your 360 photos a full experience for your audience. This presentation will also cover how to optimize a 360 image file, adjust the metadata, demonstrate different editing tools, and help your brand take its marketing to the next level.

You'll need to sign in or create an account to vote. Here's the Login Page

Optimizing 360 Photos for Marketing Your Brand is my Solo talk proposal

Customizing 360 Photos for Digital Marketing is my Workshop proposal

You can help in three ways:

1. Click the links above and vote for my proposal.
2. Leave a positive comment about the talk or your experience with me.
3. Share this proposal on your social pages using the buttons from the SXSW website.

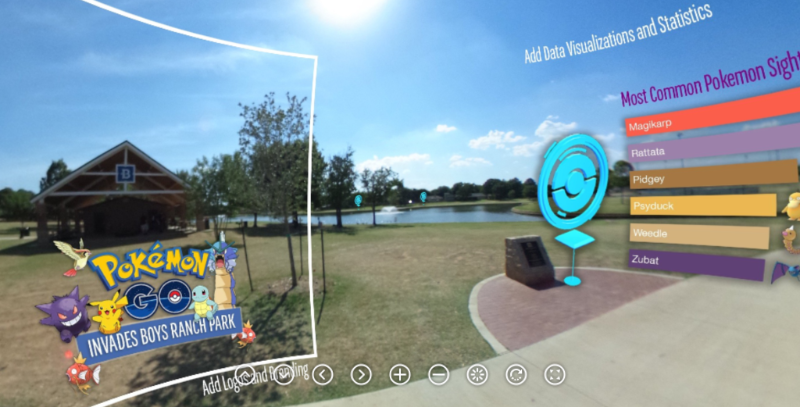
Below you can see a sample edited 360° image embedded here. This example image shows the potential for branding, callouts, data visualziations and other graphic elements that can be added before a company publishes a 360° photo. For example, the white square represents the original view when posted onto Facebook. 

Demonstration of adding graphics to Bedford Boys Ranch Pokemon GO Event 360 photo - Spherical Image - RICOH THETA

You can also see the original 360° photo here, before any of the graphic elements were added.

Monday
Aug082016

23 Reasons to Get Excited About Data (Free eBook)

23 Reasons to Get Excited About Data IBM eBook

The team at IBM Watson Analytics has released a free, new eBook 23 Reasons to Get Excited About Data that explores the latest trends, practical applications and predictions about big data. I'm honored to have been included in the book as an expert on data visualization, along with all of the other IBM Watson Analytics applications!

These days, everyone’s tossing around the term “big data.” The term is nothing new – businesses have been collecting and analyzing data since the 1950s, before the two words were ever even uttered. Take a look back in time and you’re likely to see someone laboriously poring over a sheaf of spreadsheets, manually going through row after row to identify trends and gain insights.

More people are doing more things – personally and professionally – with data, and best practices will continue to develop. Self-serve, more democratized data analytics will Get Bigger, Get Faster and Get Cloudier!

I participated in an IBM video series about big data and visualization that you can see HERE. Data visualization is such an important conponent for humans to the analyze data, discover insights and communicate our findings to others! I'm very passionate about helping people understand how important data visualization truly is! Here are a couple of the thoughts I contributed to the ebook:

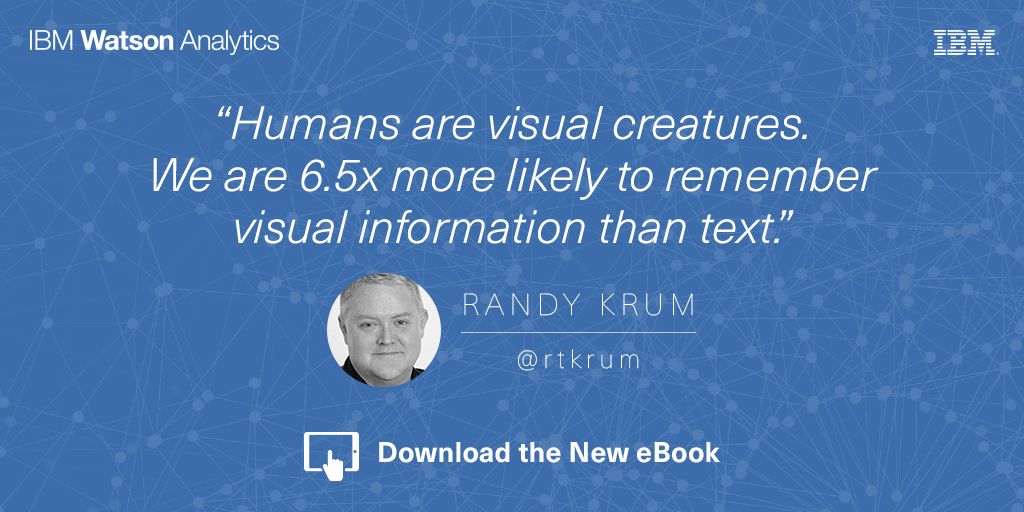
Humans are visual creatures. We can process visual information extremely fast, and are 6.5 times more likely to remember visual information than text. These are incredibly important facts when you are trying to communicate data to others. Use data visualizations to help your audience understand your information, and remember it later when it could influence their decisions or behavior. - Randy Krum

Data visualization is a language of context. You dramatically improve comprehension of your data when you design a visualization that puts your data into context for the audience. This can be a series of data points over time, or comparing your data to reference data to give the audience the perspective of how your data fits into a bigger picture. Storytelling with data is more than designing a chart, it’s the art of communicating specific insights from your data. - Randy Krum

Are you doing everything you could with your data? The future of data, along with predictive analytics and data visualization, is very exciting! Grab the free ebook now!

23 Reasons to Get Excited About Data IBM eBook Randy Krum Quote

Tuesday
May172016

Even Major News Outlets Get DataViz Wrong


Data visualization can be the most powerful, inspiring, and effective tool of a storyteller—as long as it’s accurate. However, a visualization can go horribly wrong if the designer uses the design tool incorrectly or gets the math wrong.

All too often, the underlying data is correct, but the visualization doesn’t accurately represent the corresponding values. Most of the time, it’s safe to chalk up the false visualization to an honest mistake by the designer, because it’s actually easier than you think.

Take a bubble chart, for example. A great visualization method, but it’s a common source of flawed dataviz. The reason is that design software only allows scaling or width and height adjustments to size shapes. So designers, upon reviewing the data, will sometimes mistakenly scale a circle's diameter instead of the circle’s area. This, in turn, produces radically incorrect sizes. The approach has logic to it (to some degree), but it’s inherently wrong. What should instead be done takes a bit of geometry and a spreadsheet.

“Just think about it: if you tell a software tool to scale something 200 percent, it will make it twice as tall and twice as wide. Therefore, you aren’t doubling the size of your original circle. You’re making it four time larger.”

- The Truthful Art, Alberto Cairo (@albertocairo)

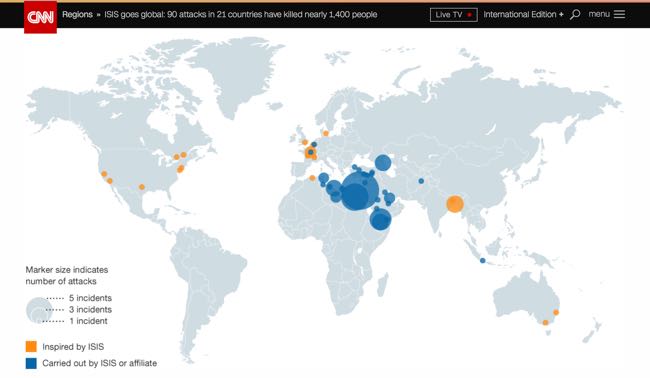
For a real-world example of this problem, take a look at CNN’s recent “ISIS goes global: 90 attacks in 21 countries have killed nearly 1,400 people,” an insightful article, serious topic, credible source with inaccurate data visualizations. Unsurprisingly, it’s a bubble chart at fault. Assuming the data gathered by CNN is accurate, the maps included in the article don’t match the data and are way off.

CNN ISIS Goes Global Incident Map Bad DataViz

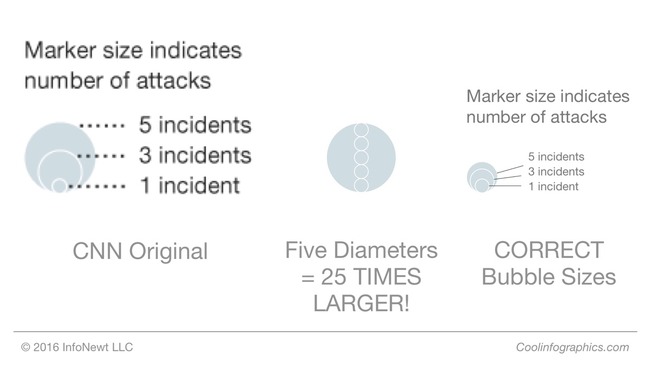
Take a close look and the size key. The circle size for five incidents is clearly shown as five times the diameter of the circle for only one incident, which creates a circle for “5 incidents” that is actually 25 TIMES LARGER, not five times larger. This drastically over emphasizes the locations on the map for the Middle East! I’ve designed the correct sizes so you can see what the bubble sizes should be.

CNN ISIS Circles DataViz Key Corrected

“It’s key for data visualization designers to understand that we visually compare the sizes of objects based on the their area (not their height). Numerical values are one-dimensional, but objects on a page or screen are two-dimensional. This is where designers need to remember to use the math learned from high-school geometry class. If you didn’t do well in geometry, it’s time to take another look.”

- Cool Infographics, Randy Krum (@rtkrum)

Bubble charts are in no way the only kind of dataviz that lends itself to mishaps. In print, broadcast, and online, you’ll see a variety of charts incorrectly showing the data — pie charts not adding up to 100%, logo sizes that don’t match the data, lines of icons with a different quantity than the data, etc.

Inaccurate dataviz certainly doesn’t always happen by accident either. Creating deceptive visual context is an unethical tactic employed by researchers, companies and publications alike, typically to promote a persuasive argument. Differences can be blown out of proportion or hidden by changing the axis scale or ignoring relevant data.

Once you start looking at data visualizations as a critical thinking reader, you’ll start notice many charts that don’t match the data. Always look to make sure the designer accurately represented the information before you take any data visualization at face value.

Thursday
May052016

Next Generation Interactive Scientific Poster

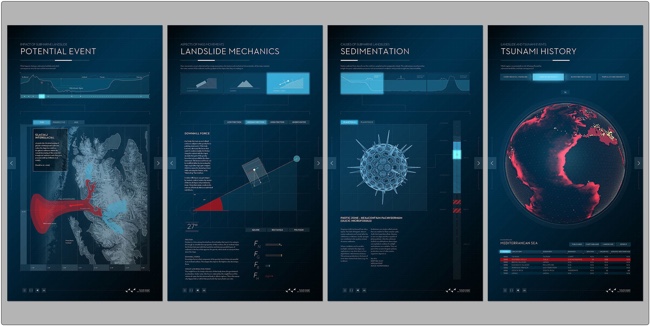
The Next Generation Scientific Poster project by The Muthesius Academy of Fine Arts and Design in Kiel, Germany takes scientific data visualization and designed a physical, interactive interface for audiences. As a result, they founded The Science Communication Lab as a spin-off from the academy so they could offer this expertise to researchers in the scientific community all over the world.

Check out this video demonstration on YouTube:

From their description:

The classical poster does often not offer enough space for the sheer complexity of the contents – texts, pictures, graphs and tables – used to convey scientific research today which causes inability to communicate contents and statements concisely. The classical poster also lacks an appropriate possibility for continuous updates which are necessary to include newer research results and would do justice to today‘s constant changes of information. 

The interactive poster is a a new method of presenting scientific topics in an attractive way, offering the user an easier access to the contents and a clearly improved possibility of comprehension. The illustrated topics are supposed to function self-explanatory and long-lasting which means that the viewer can decide on the depth and duration of the information process.

The interactive poster can be used for various purposes: For the internal demonstration of the research projects (poster sessions), on expert conferences and conventions in an international context. The newly developed technology -LED displays with a touch frame- can be used in a more reliable and long-lasting way than conventional projection technologies.

Thanks to Pieter Torrez from Scigrades for the link and his interview article with Professor Tom Duscher