About
Randy Krum
President of InfoNewt.
Data Visualization and Infographic Design

Infographic Design

Infographics Design | Presentations
Consulting | Data Visualizations

DFW DataViz Meetup

Join the DFW Data Visualization and Infographics Meetup Group if you're in the Dallas/Fort Worth area!

Search the Cool Infographics site

Custom Search

Subscriptions:


Feedburner

The Cool Infographics® Gallery:

How to add the
Cool Infographics button to your:

Cool Infographics iOS icon

- iPhone
- iPad
- iPod Touch


Read on Flipboard for iPad and iPhone

Featured in the Tech & Science category

Flipboard icon

Twitter Feed
From the Bookstore

Caffeine Poster

The Caffeine Poster infographic

Entries in technology (26)

Friday
Feb032017

The Evolution of Technology Company Logos

The Evolution of Technology Company Logos infographic

Logos are very important for a company's image, it needs to be simple and memorable. The Evolution of Technology Company Logos infographic from Vizion Online shows a few companies that have very recognizable logos. As you can see, even the professionals tweak their logos often to get the desired look and feel.

Here we have a good looking infographic that we have designed providing information about how technology company logos have evolved over the years. Check out logo evolution for companies such as Amazon, AT&T, Canon, Dell and more by viewing this logo design piece.

We hope that you enjoy this tech company logo infographic and please share it out with your friends on social media or feel free to publish it on your blog or website.

Thanks to the Picture Superiority Effect, people at more likely to remember the company logo than the company name. I talk about this in Chapter 1 of the Cool Infographics book, called the Science of Infographics. You can download an excerpt of that chapter for free HERE!

Thanks to David for sending in the link!

Wednesday
Jul292015

A History of Cell Phones and Cellphone Technology

A History of Cell Phones and Cellphone Technology infographic

Cellphone Technology has come a long way since the 80's. A History of Cell Phones and Cellphone Technology infographic from Lyca Mobile covers each generation of Cell Phones and adds some fun facts along the way. How many different generations have you owned?

This infographic covers the history of cell phones and cellphone technology from the 1st generation of cell phones in the 80’s to current high-speed 4G networks. 

There has been a lot of different cellphones since the 1980's; however, the infographic chose to separate the cellphones by broadband generations and then use just one easy to recognize cellphone from the time period. I also like how they stacked the uses for the cellphones. It was easy to recognize which features were new.

This design is purely informative. There's no call-to-action or asking the reader to do something with this information. However, they should have included the URL back to the infographic landing page so readers can find the full-size original design we people repost without the backlink to the Lyca website.

Thanks to David for sending in the link!

Thursday
Mar122015

Apple Product Flops Timeline #Fail

Apple Fail infographic

Not all ideas are good ones. Apple has had it’s own fair share of ideas gone wrong. The Apple #Fail infographic from 7 Day Shop is a compiled list of Apple’s not so successful inventions.

Behind All Successes Are a Series of Failures

When starting your own business, you should be ready for some failures along the way – but the most successful firms learn from their mistakes. As author C.S Lewis once said: “Failures are finger posts on the road to achievement.”

Take Apple. The Cupertino-based tech giant may be known for the runaway success of the iPhone and Ipad. But as our Infographic shows, Steve Jobs suffered a number of epic fails over the years.

Some misses like the Apple III and the Macintosh Portable, almost put them out of business!

Never Giving Up

But they didn’t give up – even when their machines were tipped for success, but failed to appeal to the tech market. Take the PowerPC processor for example. It could be used as a games console and a word processor, but consumers weren’t bothered.

The same can be said for Apple’s U2 iPod and the U2 album giveaway “Songs of Innocence”. Both failed, but perhaps because of the music churned about by the Irish rock band more than the marketing idea.

And FireWire’s inability to displace the USB, encouraged Apple to develop the Lightning Cable, which is now the standard iPhone charger cable. Even some good ideas did catch on. What about the Power Mac G4 Cube? A shiny monitor in an acrylic glass enclosure with upgradeable video – surely, that had to work! The idea was magic in a box, or as Apple might say, it was genie-us. Consumers didn’t think so. It failed.

Thanks to Kunie for sending in the link!

Wednesday
Oct222014

2014 Higher Education Technology Landscape

2014 Higher Education Technology Landscape infographic

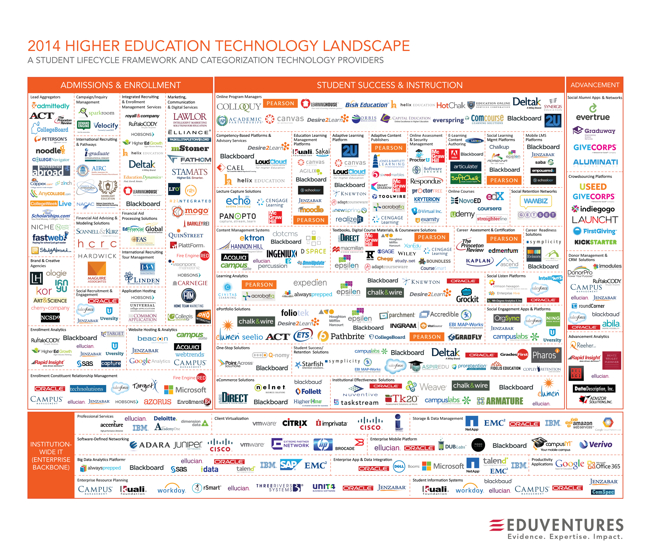
The 2014 Higher Education Technology Landscape infographic from EDUVENTURES is the effort to make sense of the higher education technology landscape for the decision-makers who are tasked with determining new ways to provide better learning outcomes, building and maintaining a modern technology infrastructure, and rationalizing investment decisions.

Leaders in higher education face mounting pressure to deliver and account for better learning outcomes, embrace digital disruption, and replace aging and ineffective infrastructure with newer, cloud-based solutions. To take advantage of this opportunity, new and established vendors have flooded the education technology market, making it one of the most dynamic segments of the high-tech landscape.

It’s estimated that colleges and universities will spend between $20B and $25B this year on technology and services, enabling institutions to support faculty, and administration, as well as effectively market, recruit, enroll, instruct, engage, and prepare students and alums. The solutions span many categories, including enrollment management specialists, adaptive learning platforms, retention solutions, online program managers, social engagement networks, crowdsourcing applications, software-defined networks, big data platforms, and enterprise resource planning (ERP).  The market is vast, confusing, and ill-defined. We hear from our clients regularly that while they want to take advantage of these new tools and solutions, they are perplexed by the ever-growing number of categories and technology vendors, and struggle with how to best to evaluate them.

To meet this growing need among our clients, Eduventures has initiated a new research focus to provide on-going analysis of the technology market to support higher education decision-makers. Our goal is to make the market more understandable, evaluate the strengths and weaknesses of technology and service offerings, and help leaders make informed decisions when selecting and implementing solutions that meet their unique institutional and learner needs.

Eduventures has developed a taxonomy to make sense of this technology landscape as a foundation for on-going research and analysis on this dynamic market:

  • A student lifecycle framework for understanding the overall market and segments
  • An initial categorization of hundreds of vendors serving the market

We have identified over 50 categories and hundreds of providers that market and sell technology and services to post-secondary institutions, which demonstrates how daunting this market can be for higher education leaders. Even with this preliminary analysis, we recognize that there are additional categories and companies to that can be added—our intention is to respond dynamically as new companies emerge and to update this landscape as it continues to mature, converge and evolve.

Complexity is the key message of this design. A lot of work went into identifying and categorizing all of these different services, but the message is clear that it’s a difficult job to setup the technology services any higher educational institution needs.

Any infographic design is going to be shared on it’s own, without the accompanying article, so designers should always include the URL address back to the original in the infographic image. Most people that share infographics don’t include the link back to the infographic landing page, and including that as text in the image file will help your readers find their way back to the full-size, original version you posted.

Thanks to Heather for posting on Linkedin

Tuesday
Aug192014

Voice of the Photographer: Photographers Actively Engaged in Growing Skills

Voice of the Photographer: Photographers Actively Engaged in Growing Skills infographic

The field of Photography evolves quickly due to advances in technology. Eyefi has uncovered the latest trends in the field and have organized them into the Voice of the Photographer: Photographers Actively Engaged in Growing Skills infographic.

There’s just no arguing that today’s most prominent photographers are evolving at the speed of technology. Those that remain relevant do so by merging their visual talents with the latest advances, like WiFi SD cards, cloud storage, and new ways of lighting and photo manipulation.

Photographers at the top of their game must maintain a staunch dedication to continuous improvement as well. Thankfully, the web provides a bevy of opportunities to hone their craft, from top-ranking bloggers to photography-focused online magazines.

To find out exactly how and where today’s best photographers are expanding their knowledge base, Eyefi.com, creators of innovative WiFi cards, apps, and cloud services, in partnership with influencer marketing agency Evolve!, reached out to their accomplished user base with a myriad of relevant questions. The results showcase where the most influential photographers online are spending their time, money, and efforts to advance their abilities. Some are professionals, while others are hobbyists; but all these folks know how to move us with their visual storytelling skills. Check out the fascinating infographic below to learn more about the photography world’s current ever-evolving habits and trends.

I love seeing all of this survey research data shown in a visual, infographic form.  It’s so much more engaging and easier for the audience to understand.

When visualizing data with grids of icons, rows with 10 icons across are the easiest for your readers to understand.  This design includes some odd row quantities like 12, 13 and 20 icons across, which are not intuitive to the audience.  Our number system is Base-10, and icons shown in groups of 10 are the easiest to comprehend.

Thanks to Katie for sending in the link!

Monday
Mar242014

How Google Glass Works

How Google Glass Works infographic

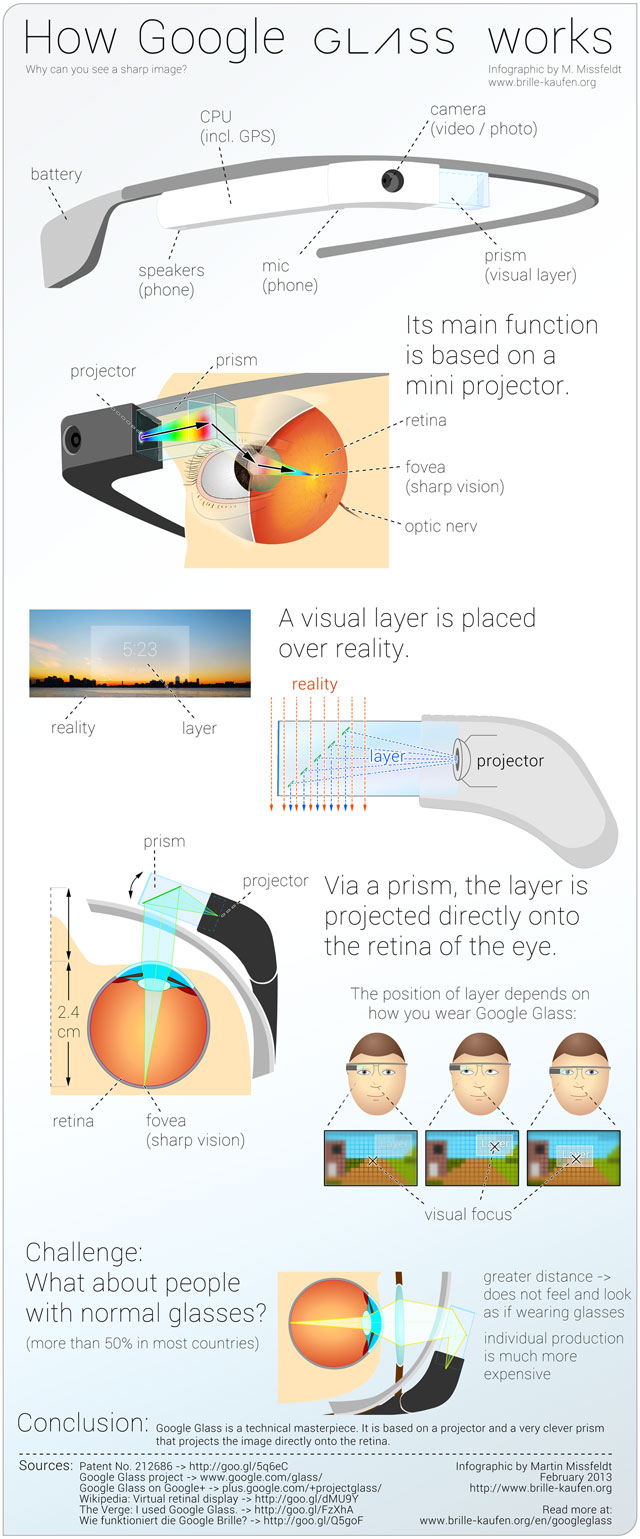
The Google Glass phenomenon has gotten a ton of coverage from the tech press, but how does it work? Creator Martin Missfeldt explains the inner workings in his How Google Glass Works infographic.

How does it work, Google’s new Glass? Why can you see with it a sharp image-layer? How does the image overlay the image of reality? The following infographic illustrates the optical principle - very simple and easy to understand.

Google Glass is a technical masterpiece. It combines numerous functions and features in a very small unit. In addition to phone and camera (photo, video), it offers Internet connection, including GPS.

The core feature of Google Glass is a visual layer that is placed over the reality (“augmented reality”). This layer opens a door to amazing new possibilities. But how does it work? In the Google Glass contains a mini-projector, which projected the layer via a clever, semi-transparent prism directly on the retina in the eye. Because of this the image, even though it is so close to the eye, is sharp and clear. You can move the front part of the Google Glass easily to optimize the focus.

This informative infographic is a great how-to explanation of the science and technology built into Google Glass.  Illustrations and images are used in this design to tell the story instead of data visualizations.

A German version of the infographic was also published.

Found on http://www.educatorstechnology.com/2013/05/a-great-visual-guide-on-how-google.html


Wednesday
Mar052014

Hungry Tech Giants

Hungry Tech Giants Interactive Infographic

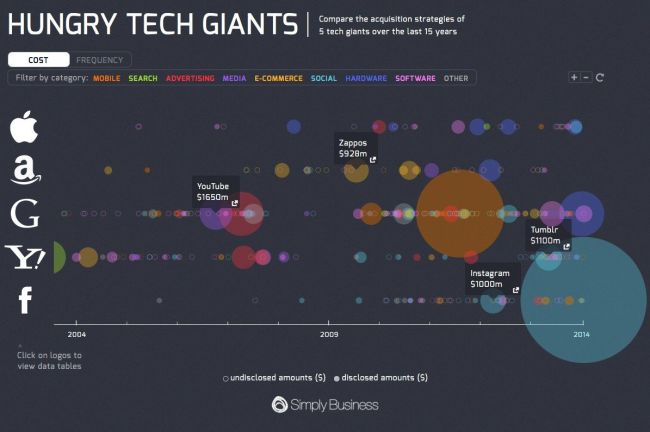
Hungry Tech Giants is a cool infographic from Simply Business that is both zoomable and interactive!  To put them into context, the design visualizes 15 years of tech company acquisitions by Apple, Google, Yahoo, Amazon, And Facebook.

2013 was a busy year for tech acquisitions.

With competition in the tech space heating up, Apple, Amazon, Google, Yahoo, and Facebook collectively executed 65 acquisitions in 2013 alone.

Yahoo was the biggest acquirer of 2013, buying a total of 25 companies following the hiring of its new CEO, Marissa Meyer.

Although Meyer is best known for her acquisition of Tumblr, the majority of her deals have bought engineering talent in an effort to build Yahoo as a serious challenger to Google.

Apple also had their biggest ever year for acquisitions in 2013, with ten purchases in total.

To see all of the acquisitions in detail, please visit our interactive microsite.

Each acquisition is appropriately placed on the timeline, and shown as a circle sized to match the total acquisition price.  Solid circles shown known prices, and open circles are not sized because the acquisition amount was never released publicly.  The circles are also color-coded to represent the different categories.

The interactivity allows you to select which categories to show, and when you hover over any particular acquisition, the acquired company name is shown with a link to the press release or news story announcing the acquisition.

The zooming controls allow you to adjust the date range shown, which helps identify many of the overlapping circles.  Clicking on the company logos on the left also brings up the data table which shows all of the known values, dates and includes the links to the press releases.  A very good way to establish credibility and make your data sources transparent.

The overall design is meant to be very detailed and allow the audience to dig in and explore the data.  At the macro level, the infographic clearly puts Facebook’s $19B acquisition of WhatsApp into context as the largest tech acquisition of all time!

Found on TechCrunch and Cult of Mac!

Tuesday
Jun042013

The Makings of a Modern Home

The Makings of a Modern Home infographic

Keeping up with technology is always a full time job. Now even your home can have technology upgrades. The Makings of a Modern Home infographic from In Style Modern helps keep all of us current with information on updating your home with the newest technology.

There isn’t a text description on the landing page, or even in the infographic itself.  The reader is left to determine if these are real, current technologies or a forecast of what’s coming.  Personally I think it walks the line between the two.  The Nest Thermostat is very real, but self driving cars aren’t available to the public yet.

This design would have been better in landscape orientation, where the information could have connected more easily with the locations shown in the isometric house illustration.  I understand why they chose to use the Tall Format though, to make the display on the blog and in services like Pinterest easier.

Thanks to Therese for sending in the link!

Wednesday
Apr242013

The Digital Dorm

Digital Dorm infographic

College is expensive and it is not getting any cheaper. Lucky for us, the advancement in technology and the introduction of apps could actually lower costs! The Digital Dorm infographic from CourseSmart can tell you the details.

College is getting more expensive but going digital helps students keep more money in their pockets in more ways than one. Check out our infographic on how students can save not just money but also time by moving to a digital dorm.

Not only saving money.  The visual story here is also how to save space and clutter in a student’s dorm room, which will help them find that missing homework assignment!

Thanks to Temple for sending in the link!

Wednesday
Mar202013

The History of Home Heating

The History of Home Heating infographic

Fun timeline of The History of Home Heating infographic by global home improvements. See how far we’ve come in home heating and the plans for the future. With the current heating technologies, we could reduce the harm that we are doing to the planet.

This is mostly a visual explanation using illustrations, but does a good job of clearly telling the story to the readers with the sequence of evolving heating images.  The isometric, video-game style illustrations draw in the reader and make the information more engaging and interesting to read.

Thanks to David for sending in the link!