About
Randy Krum
President of InfoNewt.
Data Visualization and Infographic Design

Infographic Design

Infographics Design | Presentations
Consulting | Data Visualizations

DFW DataViz Meetup

Join the DFW Data Visualization and Infographics Meetup Group if you're in the Dallas/Fort Worth area!

Search the Cool Infographics site

Custom Search

Subscriptions:


Feedburner

The Cool Infographics® Gallery:

How to add the
Cool Infographics button to your:

Cool Infographics iOS icon

- iPhone
- iPad
- iPod Touch


Read on Flipboard for iPad and iPhone

Featured in the Tech & Science category

Flipboard icon

Twitter Feed
From the Bookstore

Caffeine Poster

The Caffeine Poster infographic

Entries in social media (74)

Friday
Apr132018

Creating Clickable Social Cards

Creating Clickable Social Cards infographic

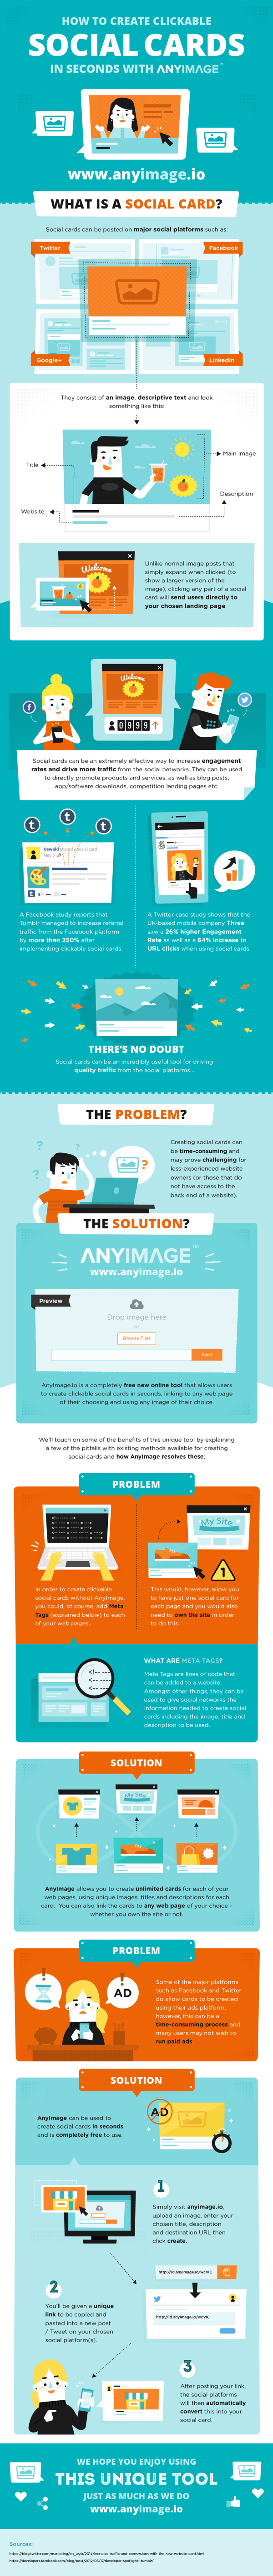
The How to Create Clickable Social Cards infographic walks you through the process of using the AnyImage.io site to create social media cards for any of the major social media platforms, such as Facebook, Twitter, Google+ and LinkedIn.

AnyImage is a unique web-based tool that enables you to transform regular images into clickable social cards, linking to any web page of your choice. The cards can be shared on a number of social platforms including Facebook, Twitter, LinkedIn and Google+ 

study by Facebook themselves reported that users were able to increase traffic from the platform by a whopping 250%, simply by using clickable social cards. Thanks to AnyImage, you can begin creating your own cards in just a matter of seconds (for free). 

We’ve created this useful infographic (below) to explain exactly how AnyImage works. Enjoy! 

This is a fantastic use of an infographic as How-To explanation for a company's product or service! Most products have at least a small learning curve, and a clear infographic design can help get your customers over that initial hurdle using your service.

Monday
Nov062017

How Brands Are Using Instagram Stories

How Brands Are Using Instagram Stories infographic

Klear analyzed 149 brands in 8 different industries to see How Brands Are Using Instagram Stories to drive sales.

Just last year, brands faced a big issue on Instagram: sharing external links with followers. Can you recall posting about a new blog post on your account and having to direct followers to your bio to click the link? No one cared to take the time to go to your account and check out the content. This wasn’t a convincing nor effective method and the low rate of user responsiveness made this a big loss of interest for marketers.

Although just a few months after the birth of Instagram Stories, came their golden solution to every marketers’ problem.

Instagram introduced a “swipe up” feature, allowing brands to link a URL to their story, creating a “see more” option below the post. Then if users wished to see further content, it was only a swipe away, thus creating greater user compliance. The linking component is only available for verified accounts. For the marketers who can use it, it’s a dream.

We were already aware of the popularity surrounding Instagram Stories, but we wanted to see how brands are utilizing this newer feature. We decided to follow 149 top brands in 8 industries – including Amazon, Adidas, JetBlue, and Coca-Cola – to see what do they share on their stories and where they guide their followers to.

Read more at Klear.com

I like the data, and the clear sequence of sections. The thin doughnut chart is really hard to read and connect the colors to the legend. The stacked bar chart at the end is very busy and hard to read as well.

Found on Marketingprofs.com

Friday
Apr142017

The Best Times to Post to Social Networks

The Best Times to Post to Social Networks infographic

When you are promoting your product through social media platforms, you want to make sure you are setting yourself up for success. First Site Guide has published the The Best Times to Post to Social Media infographic cheat sheet gives you data on the daily high traffic times of each platform to increase the likelihood of your post being seen. It also gives tips on times to send emails based on your content. 

Social media’s all about throwing the metaphorical spaghetti at the wall and seeing what sticks, right? No. No, it’s not! Chances are good you saw that twist coming, but this First Site Guide cheat sheet is all about why time and type matter on social media. Believe it or not, there is a rhythm and a pulse to the tweets and the posts, and patterns of sharing and engaging with content which can be examined scientifically.

Why should you care, though? Well, as it turns out, knowledge is power and someone who knows when to post, where to post, what to post, and how often to post gets a lot more bang for their buck than someone who just sporadically adds random content to whichever social media platform has their attention.

Knowing your audience is an important part of the process. Did you know that emails containing news and magazine updates get opened more often during the lunch hour, but holiday promotions are best sent in the evenings?

There's some really good information here that was gathered from a number of different sources. However, I have a handful of serious issues with this design:

  • Is this data credible? I can't tell from what is shared on the infographic itself. The Sources link is just a shortened URL, so no visibility to where the sources of the data.
  • The Sources link is a downloadable Word DOC from a Russian cloud stoage site. The document includes nine links to data sources, but many of them are broken links.
  • Is the data visualization, I'm guessing the wider sections of the stream are the better times to post. There's no explanation.
  • For the Email section, the time wheel has the days and nights reversed (AM vs. PM). We don't all go to sleep for six hours after lunch.
  • A couple of text typos in the infographic.
  • The footer should include a copyright and the URL to the original infographic landing page so readers can find the full-size original when people don't share the actual link.
  • How do time zones play into these times and scheduling posts?

Thanks to Peter for sending in the link!

Friday
Dec042015

What Social Media Platforms Are Best Suited For Your Business

It doesn't matter if you have a well established business or a new one, everyone can benefit from learning to use social media better. But which platform is right for you? The What Social Media Platforms Are Best Suited For Your Business infographic from Quick Sprout helps you determine which platform your target audience uses so you can save yourself some time.

With all the social media sites available today, which ones should you leverage? In an ideal world, you would use them all. As a small business, however, you don’t have enough time and money to do so.

With your limited resources, which social media platform would you pick?

If you think Facebook and YouTube are your best bets because they are most popular, think again. Just because a site is popular doesn’t mean it is a good fit for you business.

To help you decide which social media platform is best suited for your business, I’ve created an infographic that explains what social sites you should be leveraging based on real data.

Good use of colors and logos to differentiate the different services. This infographic is a good example of the difference to readers between visualized data and text-only data. Readers' attention will gravitate to the visualized statistics, and any numbers shown as just text are often skipped and considered to be secondary information.

Thanks to Juntae for the link!

Wednesday
Sep022015

The Science of Instagram

The Science of Instagram infographic

The Science of Instagram by Dan Zarrella is a study on 1.5 million photos on Instagram about which photos get more likes and comments. 

If you want to see data like this about your account specifically, check out the Instagram analytics tool I released: PicStats.com

When I’m speaking at a conference, one of the most common questions I’m asked is what do I think the future of social media is. I’m not great at distant future predicting, but I do believe the story of the present and near-future of social media is visual content. From the impact of images and video on Facebook and Twitter to the new crop of media-centric social platforms like Instagram and Pinterest, it’s clear that inbound marketers need to be turning out great visual content.

I recently spent some time collecting a large Instagram database and analyzing it to identify the characteristics that make images work (or not work). The result is the infographic below. If you’re curious about the nerdy details of the dataset, there are details at the bottom of it.

Be sure to come see me present my all new edition of The Science of Social Media next week in Boston at INBOUND. I’ll be speaking on Wednesday the 17th at 1:45PM. There will be tons of never before seen data, including lots about visual content. Oh, and follow me on Instagram!

I like the simplified charts in this infographic. Removing the unnecessary gridlines, axes and other chart clutter helps them clearly communicate their content to the readers.

The footer should include a copyright (or Creative Commons) license statement and the URL to the infographic landing page so readers can find the original full-size version when bloggers repost the infographic without a link. I always include a link back to the original but most do not.

Found on http://www.marketingprofs.com/

Tuesday
Aug182015

The State of the Social Marketing Team

The State of the Social Marketing Team infographic

The State of the Social Marketing Team is an infographic from a survey that SimplyMeasured put together and shared in the full 2015 State of Social Marketing report. This is the right way to use an infographic as the visual summary of deeper content hidden behind a registration wall.

Many companies are still trying to figure out how to tackle social media. They’re constantly asking themselves questions like, “Where should social media live in our organization?,” “How big should my team be?,” or “How should our social media team be built?”

To help address this common issue, we surveyed over 350 social media marketers about their team structures and compiled our findings into this infographic! More information from the survey (as well as a separate look at the pain points these marketers face), download a complimentary copy of our 2015 State of Social Marketing Report.

This is a really good infographic. Packed with good information and keeps the design simple and to the point. My only issue with the design is that some of the text is small and in light colors that are hard to read against the white background.

I noticed that SimplyMeasured posted the original infographic on SlideShare and then posted it in their blog by using the SlideShare infographic wrapper for sharing. SlideShare introduced the Infographics Player in 2013, but I haven't seen many people using it. The potential advantage is that most of the view metrics from mutliple sites are combined together in SlideShare. The potential disadvantge is that people go to SlideShare to view your infographic and never make it to your website. 

Found on MarketingProfs

Monday
Jul272015

Robert Scoble's 22 Tips for Improving Your Facebook Feed

Robert Scoble's 22 Tips for Improving Your Facebook Feed infographic

Robert Scoble's 22 Tips for Improving Your Facebook Feed infographic from Joel Comm is a great summary of making your own Facebook feed useful. We all lead busy lives, but sometimes it's worth stepping back and making sure your tools are working for you the best way they can.

A few weeks ago, Robert Scoble published 22 tips for making your facebook feed better. It was some of the best, time-tested content I had read on the subject. I was so impressed that I created an infographic in order to spread his tips. With Scoble's permission, here are his 22 tips. Be sure to go to his page and show him some love! And, of course, would love for you to share this with others.

This is essentially a list infographic that includes some icons to add visual content. I'm generally opposed to a lot of text in an infographic design, but the content here is so valuable that the descriptions are necessary in the design. Sharing as an infographic image file, also makes the content easier to share online.

The footer should include the link to the infographic landing page so readers can easily find the original, full-size version when people repost the infographic without a backlink to the original.

Friday
May082015

Stop Being A Social Loser

Good advice from SumAll in their new infographic Stop Being a Loser: 12 Tips to Avoid Social Churn

Nobody loves cats more than I do. Chunks of my day are routinely lost looking at cat GIFs, videos, photos, anything to satisfy my admittedly unhealthy love for these furry companions. But even I have my limits.

If I’m browsing my Instagram feed and I see somebody post five photos in quick succession of their cat, that’s a surefire way to get an unfollow from me – and this is coming from somebody that dresses up their cat as a different Disney character every Halloween. So, step away from the hashtag, don’t even think about taking out that selfie stick, and check out this infographic for 12 tips on what you should and shouldn’t do on social media to get a loyal following.

I would have liked to see more data about social churn. This is a lot of text with illustrations for each point. Really good information, but I know SumAll has data to back these tips up.


Monday
Dec012014

The Internet Is a Zoo: The Ideal Length of Everything Online

The Internet Is a Zoo: The Ideal Length of Everything Online infographic

Short, sweet, and to the point! The Internet Is a Zoo: The Ideal Length of Everything Online infographic from a partnership between SumAll and Buffer explains the fine line between when extra words are helpful, and when they become too much information. Whether you are posting a facebook post to your friends, or a blog post to your avid followers. This infographic will help make sure your posts reach the most readers!

Have you ever woken up in cold sweat in the middle of the night wondering exactly how many characters long a tweet should be to get the most engagement, or how many words long a blog post should be so that it actually gets read?

Ok, that may just be me, but knowing exactly how many characters a Facebook post should be or what the ideal subject line length is should be endlessly fascinating (and useful) information to most people who are active on social media.

So, to make all this data digestible and easy to understand, we partnered with our awesome friends over at Buffer to produce an infographic that shows the optimal length of pretty much everything on the internet.

Great design that tells one story really well, totally focused on the length of posts on different social media platforms. The footer should include the URL to the infographic landing page so readers can find the full-size original when the infographic is posted without links.

They went one fantastic step further, and created a more print friendly version near the bottom of the landing page that spans multiple printed pages. The pages are formatted to fit on standard Letter-size paper or in presentation slides. This is a great example of using the research and design from the original infographic to share the information in additional formats.

Infographic was found on SumAll

Friday
Sep262014

The Interactive Purriodic Table of Internet Cats

The Interactive Purriodic Table of Internet Cats infographic

The Interactive Purriodic Table of Internet Cats is a fun way to make sure you’re up-to-date on all of the top Internet cat memes!  Just in case that’s something important to you.

Earlier this week, we launched our latest ‘CATSterpiece’: The PURRiodic Table of Internet Cats. The PURRiodic Table is an amazing interactive graphic that serves as a reference point for the internet’s amazing cats.  Within these pages of the interweb, you can find everything you could ever want to know about your favorite feline, all wrapped-up in a baseball card style view (see image of Grumpy Cat below).

The interactive PURRiodic Table allows users to click on an image of any of 50 felines to learn their stories and view their social-media-star stats.  One of our favorite discoveries in putting the PURRiodic Table together was learning that more than half of these cats are rescue cats, which emphasizes the importance of animal adoptions.


Based on data from the Friskies 50: Most Influential Cats, the design obviously builds on the visualization idea of a periodic table.  Grouped by CATegory and ranked using the Friskies data set, each cat is clickable to get more information and all of their social media links.

This is definitely a design built to entertain audiences! The challenge for interactive infographics like this one is s share-ability and Avalaunch Media has done a fantastic job of preprogramming the social media sharing buttons on the infographic landing page to include a static image to include in posts.  

Thanks to Mat for sending in the link!