About
Randy Krum
President of InfoNewt.
Data Visualization and Infographic Design

Infographic Design

Infographics Design | Presentations
Consulting | Data Visualizations

DFW DataViz Meetup

Join the DFW Data Visualization and Infographics Meetup Group if you're in the Dallas/Fort Worth area!

Search the Cool Infographics site

Custom Search

Subscriptions:


Feedburner

The Cool Infographics® Gallery:

How to add the
Cool Infographics button to your:

Cool Infographics iOS icon

- iPhone
- iPad
- iPod Touch


Read on Flipboard for iPad and iPhone

Featured in the Tech & Science category

Flipboard icon

Twitter Feed
From the Bookstore

Caffeine Poster

The Caffeine Poster infographic

Entries in jobs (30)

Monday
Dec212015

The Data Science Industry: Who Does What?

The Data Science Industry: Who Does What? infographic

Where's the "Data Visualizer"?!? The data science occupation is a very popular new career field that many companies are hiring; however, many of these titles are mistakenly used interchangeably. The Data Science Industry: Who Does What? infographic from The Data Camp Blog introduces some of the positions in this upcoming field.

In this infographic we compare the roles of data scientists, data analysts, data architects, data engineers, statisticians and many more. We have a look at their roles within companies and the data science process, what technologies they have mastered, and what the typical skill set and mindset is for each role. Furthermore, we look at the top employers that are currently hiring these different data science roles and how the average national salaries of these roles map out against each other.

Good, thorough source reference links. Needs a copyright statement and the URL to the infographic landing page on the DataCamp site so readers can find the original full-size version.

Found on MarketingProf

Tuesday
Oct202015

How to Improve Your Chances of Getting an Apprenticeship

How to Improve Your Chances of Getting an Apprenticeship infographic from Apprenticeship Connect has compiled a great list of tips and tricks to land your dream apprenticeship! The infographic covers ways to find an apprenticeship, and then how to best present yourself.

With the government working hard to create three million new apprenticeships within the next five years, there has never been a better opportunity to earn while you learn. Apprenticeship Connect reveals some very handy tips and tricks to help you during your search.

There are so many different types of apprenticeships out there in the market, so you don’t have to go down the path of university once you leave school.

In order to secure your dream apprenticeship however, you’ll need to impress your potential employer.

With the internet and social media play an ever increasing role in finding an apprenticeship; there are several things you need to keep in mind when looking for the next stage in your career.

This is a text-heavy design, but it's loaded with good content.

The footer is missing a copyright (or Creative Commons) license statement and the URL to the infographic landing page. It lists the home page for Apprenticeship Connect, but there is no mention of the infographic on there. It's really difficult for readers to find the original, full-size infographic.

Thursday
Jul092015

How to Pick Your First Programming Language

How to Pick Your First Programming Language infographic

Udacity presents, How to Pick Your First Programming Language infographic. Your decision depends a lot on where and the job you are aiming for. Check out the graphic for some tips.

If you haven’t picked your first programming language, the programming world is your oyster. Yet with evangelists for every language telling you their language is the best, choosing one to start with can be incredibly overwhelming. We’ve looked at the data for the top ten programming languages in the US (based on IEEE Spectrum data) to help you pick the best language to start with based on your priorities in lifestyle, location, and career potential.

Python is a popular, well-paid language, being versatile enough to be used in many different applications, while Javascript is used widely across the country, and can be a good choice if you don’t want to relocate for a job. Although some newer programming languages, such as Swift, are not included, you shouldn’t discount the growth of their popularity. Career opportunities in iOS development using Swift, similar to Android development using Java, will increase as the field of mobile app development continues to expand.

There are many factors involved in choosing your first programming language. This data can help you figure out what works for you.

Good rundown of the stats behind the programming language careers. I'm not sure that Google searches in the best gauge of language popularity. Maybe something like number of projects on GitHub might have worked better.

The footer should include the URL back to the original infographic landing page, not just the main front page for Udacity.

Thanks to Lindsay for sending in the link!

Thursday
Apr022015

The True Cost of a Bad Hire

The True Cost of a Bad Hire infographic

The True Cost of a Bad Hire infographic from Executives Online in the UK puts into perspective the £4.13 billion a year that UK businesses are losing from a bad hire. With one £50 note being less than 1 mm thick, the stack would reach about 933 meters tall. London’s Big Ben is 96 meters tall.

People are a businesses most valuable resource. Actively finding and attracting top talent is a never-ending task for any company that aspires to be the best.

The amount of new hires that don’t work out is frightening – in fact a study by leadership IQ across a range of industries and job roles found that up to 48% of new hires fail within 18 months. It’s a problem that’s estimated to cost UK businesses over £4 billion a year.

So What’s The True Cost When One Of These New Hires Doesn’t Work Out? 

Outside of the obvious salary cost, there are a significant number of tangible and intangible factors that can drive the cost of a failed hire much higher than initially estimated. 

We used an example of a £100k per annum executive to answer one question: “What’s the true cost of a bad executive hire?” We factored in salary, benefits, the cost of the recruitment and sourcing process, and the knock on effects of having a poor performing individual in a role for up to a year.

Using data from a range of external sources and our own databases we arrived at a final figure showing this cost to be around three and a half times more than a year’s salary. To demonstrate the scale of this cost we laid it all out in a infographic as well as breaking down how that cost was arrived at.

So Why Do Bad Hires Happen?

Part of this failure to make successful hires is down to company policies focussing on hiring cost rather than ROI.

As Steve Jobs put it: “A small team of A+ players can run circles around a giant team of B and C payers… I’ve noticed that the dynamic range between what an average person could accomplish and what the best person could accomplish was 50 or 100 to 1”.

Next time you’re making an executive hire, remember what it will cost if it doesn’t work out! 

It’s a long/tall infographic design, but I think that the length is actually part of the visual story in this case.

Visually, the grids would be easier for readers to understand if the rows were 10 icons across instead of 20. We live in a Base-10 society. Rows of only 10 would make the infographic twice as long, but an alternative would be to add some spacing to visually separate the left 10 from the right 10. Same thought for vertical spacing. It would help to have a gap in the icon grids every 10 rows.

The confusing part is that every icon is a £50 note, so with 20 icons, each row represents an even £1,000. That’s why I think they designed the rows to be 20 icons across.

Odd that they published the infographic as a transparent PNG file.

Thanks to Alex for sending in the link!

Monday
Dec222014

5 Ways to Market Yourself Visually

Visuals communicate complex ideas into something more digestible. Large amounts of text make it harder for our brains to find pertinent information in a timely manner. This problem can be remedied quite easily, by adding images and visuals into marketing yourself.

Visuals can help turn a complex idea into something more easily digestible, with less effort and time spent by the person viewing it. By putting extra work in on your end, you position yourself to leave a more lasting impression, and stand out from a pile of resumes. Especially when marketing yourself to a recruiter or HR department - making it easier for them to understand your most important work. In Cool Infographics, I cover how visuals are 6.5 times more likely to be remembered than text alone, and there’s no better time to be remembered than when you’re applying for a new job.

Below are five ways to start marketing yourself visually right away:

1. The Infographic Resume

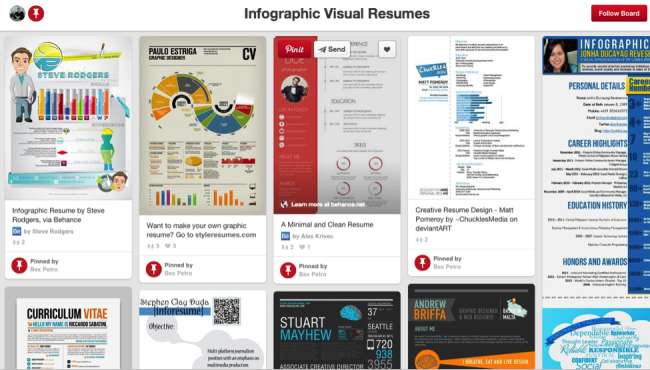
Infographic Resumes Pinterest BoardPinterest Board Gallery of over 900 Infographic Resumes

Infographics are an excellent visual tool to have in your arsenal. They are the pinnacle of displaying complex information in an easily digestible way. Either pay a talented infographic designer, or do one yourself. If you’re not comfortable using graphics design software, check out an excellent free option online like Visme.co - that will have you designing infographics in no time.

Take a look at this Infographic Resume Pinterest Board with over 900 examples for inspiration, and check out the great book The Infographic Resume by Hannah Morgan when you’re ready to get serious about developing your own.


2. Visualize Your LinkedIn Profile

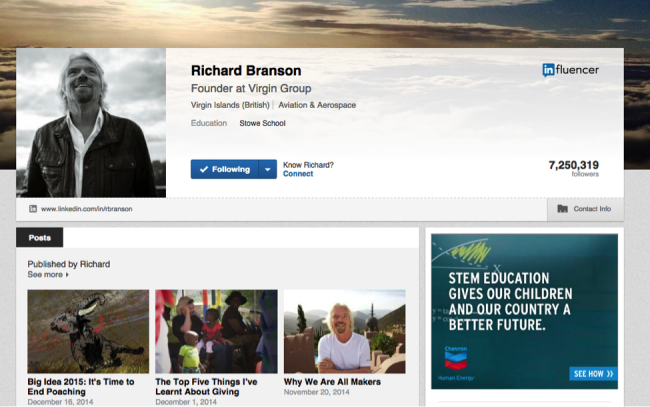
via Richard Branson’s LinkedIn profile

It should be no big surprise that a prospective employer will look at your LinkedIn profile prior to checking you out in person. LinkedIn allows you to add photos and visually rich imagery, so take advantage of these opportunities. If you add companies that Linkedin recognizes to your work history, your profile will automatically display their logos.

Examples could be photos of you working at a trade show, product prototypes you designed, or a photo of you giving a presentation (LinkedIn has Sl SlideShare integration, so embed the presentation in your profile as well). Other images or PDF files work as well, like an advertisement you designed.


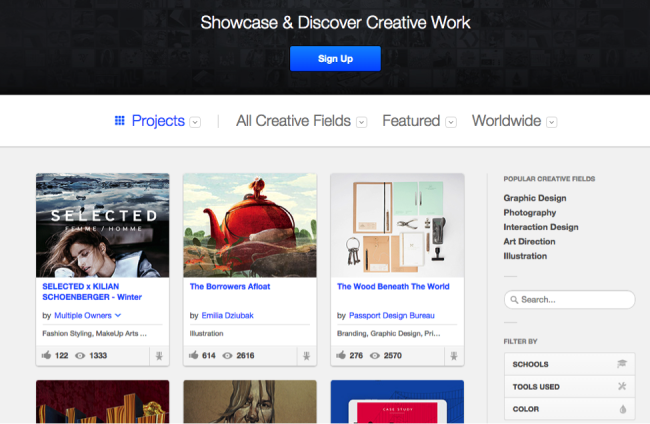
3. Create A Visual Portfolio of Your Work


Talking about your creative work only goes so far, you need to provide visuals. Visuals help the employer see what you’re capable of, and gives you the opportunity to control the work they see. Websites like Behance and Dribble are excellent options for creatives of all types. Not only do you get to upload all of your projects, but you get to interact with their creative communities as well - having the chance to inspire others, and be inspired yourself.


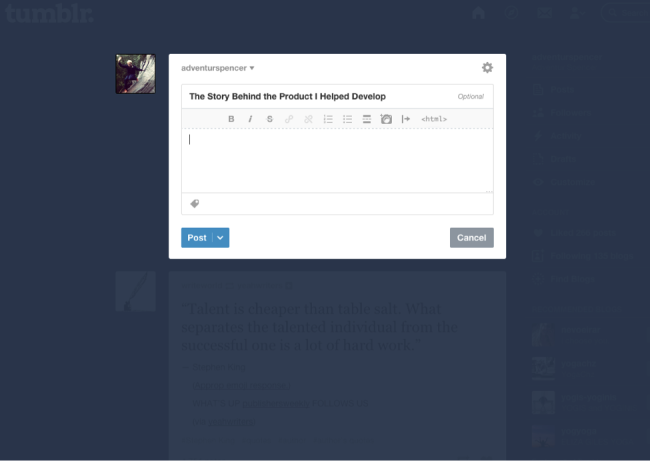
4. Create a Blog Post to Provide More Information and Visuals of Your Work


A resume should be a brief overview of skills, previous employment, education, and best works. One page is best. If you would like to expound further upon your projects, then create a blog post - loaded with visuals - that delves deeper into your work.  Tumblr is a great free option for keeping a personal blog.

Include links to any additional content you publish in your Linkedin profile and even on your text resume. Make it as easy as possible for hiring managers and recruiters to find your work.


5. Content Curation

Similar to the idea of creating a blog post to highlight your best work, create a content curation site to highlight the best infographics, articles, quotes, YouTube videos, podcasts, brands, inspirational work, thought leaders, TED talks, and books you’re reading. Show your future employer that you have a passion for gaining knowledge, and are an expert in your field. Pinterest is a great option, and if you’re looking for a design-centric curation site, Designspiration has got you covered.


What other ideas would you recommend?

Friday
Apr252014

Every Job In America

Every Job In America infographic

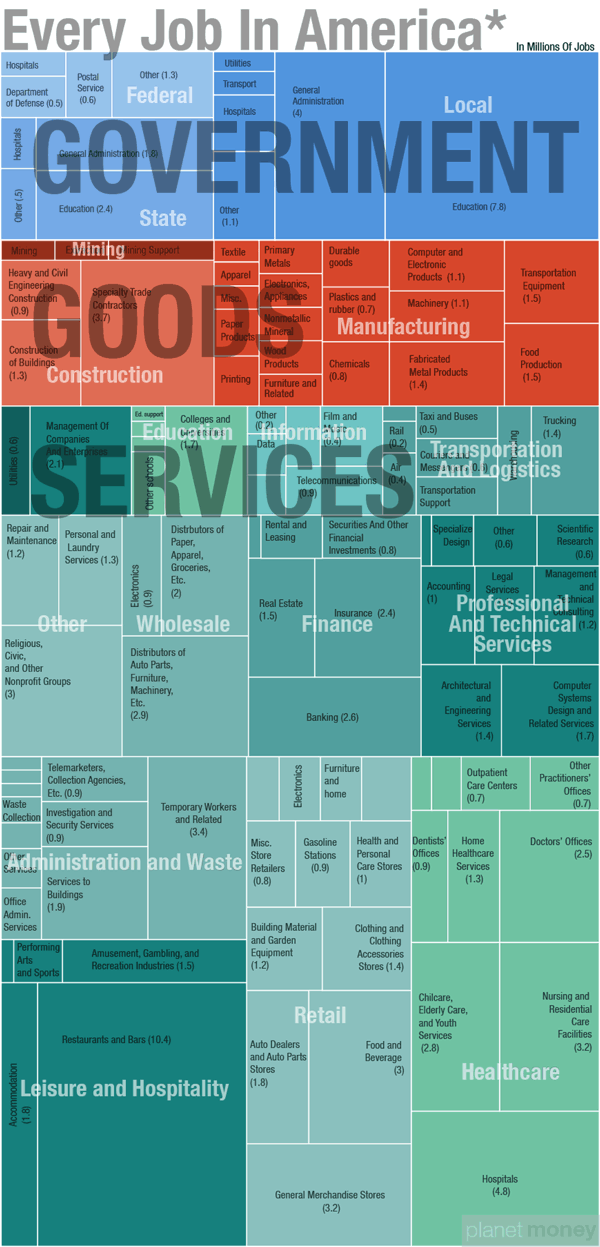
Every Job In America is a treemap data visualization design from Quoctrung Bui at NPR based on the data that the U.S. government collects for the monthly Jobs Report.  I think I probably fit somewhere in the Services-Professional and Technical Services-Specialized Design section.

Whatever Friday’s monthly jobs report says, it won’t change the big picture. There are roughly 137 million jobs in this country. About two-thirds of those jobs are in private-sector services; the remaining third are split between goods-producing jobs (mainly manufacturing and construction) and government work (mostly at the state and local level).

Here’s a closer look, drawn from the same data that the government collects for the monthly jobs report.

Notes: 
*The data come from the government’s non-farm payroll report — which, as the name suggests, does not include farm jobs. Update: The report also excludes military personnel, government intelligence employees and some self-employed workers.

There isn’t much I would change about this design.  The treemap visualization is well done, and carefully organized to allow for the color coding rectangles.  Titles are missing from any rectangle that was too small to hold the text, but a smaller font could have been used, or a reference to a list at the bottom.

Even though this is part of an article posting, the infographic image itself has a title for easy sharing without the rest of the article.  Including a few other elements in the image file like the data sources and the URL to the landing page would be very helpful.

This is the type of project where I think a link to a public spreadsheet with the numbers used would be helpful.  The article links to the U.S. Bureau of Labor Statistics press releases, but then someone would have to dig through the reports.

Monday
Oct142013

The Modern Workforce

The Modern Workforce infographic

The Modern Workforce infographic from unum shows that the workforce demographic has changed in the last 30 years, but the benefits have not evolved to support this. There are more women, disabled, and older people in the modern workforce, but the protection, time away from work, and services given to employees are not keeping up.

The research finds significant gaps have opened up between employer-provided benefits and the protection required by today’s workforce. At a time when the demographics of the modern workforce are shifting towards employees that have a greater need for financial benefits, the research shows that the ratio of wages to employee benefits is outdated.

As a result, we’re more likely to fall into financial difficulty than we were 30 years ago. And, if we’re in financial difficulty we’re less productive, so it’s in an employer’s best interests to better protect their people.

We’ve published research called Keeping Pace? Financial Insecurity in the Modern Workforce with Cass Business School. It paints a picture of how the make-up of our workforce has changed. It also makes recommendations about what employers should do to better protect their people.

The infographic has some great data from their case study research, but the design could have done a better job making the information easier to understand for readers.  Many of the visualizations don’t match the data from the study.

For example, the pie slices shown in the Demographic Changes section changed their radius instead of their angle.  This creates a false visualization because the area of a pie slice with twice the radius is much larger than the data values.  So, the visualization is displaying a much larger increase than the data actually shows.  This design mistake with the radii was repeated in the Social Changes section, so that visualization doesn’t match the data either.

Unum also created a motion graphic video to share some of the research findings as well.  I would have recommended tying these two content types together, using the same design assets in both.  They already have the data visualizations from the static infographic, so use them in the video as well.


Thanks to Ed for sending in the link!

Monday
Oct072013

The Perks of Working at Google, Facebook, Twitter and More

The Perks of Working at Google, Facebook, Twitter and More infographic

When you get on your computer and pull up Google or Facebook, do you ever wonder about the people that make the site run? Resumebear put together an infographic for Mashable called The Perks of Working at Google, Facebook, Twitter, and More to share information like “Amenities in the Office” or “Medical and Retirement Benefits”. After reading about these jobs, you might decide to apply there yourself! 

It’s no secret that Silicon Valley has a problem finding the talent it needs to fill all the high-tech jobs available in the region. The area expects jobs in information and communications technologies to grow 15 percent during the next two years, Menlo Park Patch reports.

The trick for many employers is how to attract — and keep — the best talent in the field. Beyond handsome salaries, many tech firms also lavish their workers with benefits, leading to some unique and even quirky offerings.

Such corporate perks can be as simple (and routine) as Facebook’s discounted gym memberships or the onsite gyms at search-engine giant Google and Gaia Online, an animation-themed social networking site.

Great use of icons and illustrations to show a comparison between company benefits!

Found on mashable.com!

Thursday
Oct032013

Agile Development Methodology Talent Gap

Agile Development Methodology Talent Gap infographic

Who’s Hiring & Who is Hirable? The Agile Development Methodology Talent Gap infographic from Yoh points out why it is so hard to find agile developers and why the pros get paid the big bucks.

The rapid adoption of the agile development methodology has created a sizable talent gap. The INFOGRAPHIC from Yoh uncovers the impact: 

  • Demand outstrips supply by nearly 4x
  • Companies have to pay a premium for Agile expertise
  • The agile talent gap is most significant in thePacific Northwest
  • Labor pressure for agile talent goes from bad to worse
  • Competition for agile talent is fierce

Good design, and certainly eye opening for agile developers and employers.  The only visualization I struggled with was the Experience stacked bar, because the bar sizes don’t match the data shown.  Not even close.

Thanks to Stephen for sending in the link!

Tuesday
Jul302013

What Do 7 Billion People Do?

What Do 7 Billion People Do? infographic

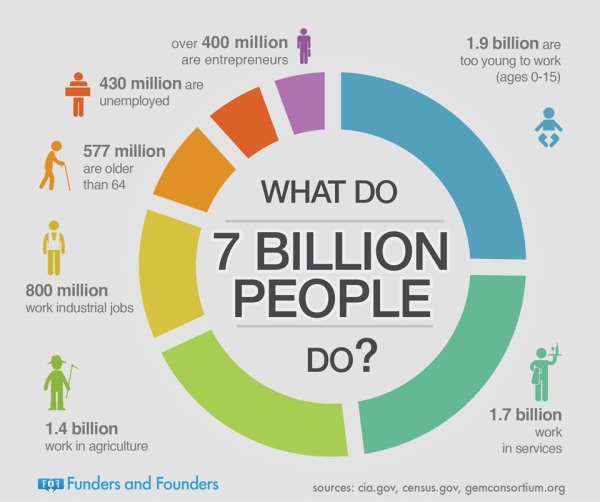
This is a page out of Funders and Founders future book. It is a circle graph of the population of the world. The What Do 7 Billion People Do? infographic simplifies the worlds jobs into broad groups. Entrepreneurs are still the smallest group!

We explain entrepreneurship and startups visually through infographics. Here you can see draft notes from our future book.

Found on Funders and Founders!