About
Randy Krum
President of InfoNewt.
Data Visualization and Infographic Design

Infographic Design

Infographics Design | Presentations
Consulting | Data Visualizations

DFW DataViz Meetup

Join the DFW Data Visualization and Infographics Meetup Group if you're in the Dallas/Fort Worth area!

Search the Cool Infographics site

Custom Search

Subscriptions:


Feedburner

The Cool Infographics® Gallery:

How to add the
Cool Infographics button to your:

Cool Infographics iOS icon

- iPhone
- iPad
- iPod Touch


Read on Flipboard for iPad and iPhone

Featured in the Tech & Science category

Flipboard icon

Twitter Feed
From the Bookstore

Caffeine Poster

The Caffeine Poster infographic

Entries in games (28)

Tuesday
Jun062017

The Sci-Fi Timeline

The Sci-Fi Timeline

The Sci-fi genre contains some fantastic and horrifying ideas about the future, but how far away are they? The Sci-Fi Timeline created by Glow places classic sci-fi movies and games on a very long timeline.

We're all used to seeing movies and games set in the future, but often the date can seem a bit abstract.

We've brought together some of our favourites to show yo the timeline and where they all fit. There were some surprises!

See for yourself, and decide if the writers got it right!

Thanks to David for the link!

Thursday
May042017

Evolution of the Game Console

Evolution of the Game Console infographic

The Evolution of the Game Console infographic from OnBuy.com remembers our childhood with a timeline of the last 18 major game consoles.

Bound to bring back fond childhood memories, (for most of us!) our infographic takes you through the fascinating evolution of the home games console. Dating back to 1972 when the Magnavox Odyssey was released, our infographic will guide you through the technological advancements of the last 45 years, right up to Microsoft’s 4K-ready Project Scorpio, set to launch in December 2017.

Intrigued? We bet! Now, kick back, relax and enjoy the wonderful world of gaming.

As much as I like the content and remembering playing on the consoles, this timeline is not well designed. It's not that hard to actually line up the consoles with the correct years instead of just showing them in pairs no matter what the dates are. Why even bother putting them into chronological order if you're not going to line them up correctly?

For businesses, a timeline history of their industry is a great topic idea for an infographic.

Thanks to David for sending in the link!

Wednesday
Oct012014

Star Wars Commander

Star Wars Commander infographic

The Star Wars Commander infographic created by Disney Interactive highlights the new mobile game of the Star Wars saga. Since it’s launch on August 21st, 5 million players have chosen a side. May the Force be with you!

This morning we received word that The Empire is holding strong in the Galactic Civil War against Rebel Forces in Star Wars: Commander. Five million players globally are now engaged in the epic battle, with Imperial forces gaining ground quickly. Below is an infographic recovered from Bothan spies that details troop deployment and battle statistics (a high-res version of the image can be found here).

Highlights from the intercept include:

  • Five million players have now joined the war (downloaded Star Wars: Commander since its launch on August 21).
  • With more than 57 percent of its players representing the Empire, Russia is one of the strongest Empire strongholds. Other nations that have fallen to the Emperor include Austria, Germany, Finland and the Ukraine.
  • India stands out as a strong member of the Rebel Alliance, as are most countries across South America and Africa.
  • The United States is nearly unanimous in its following of the Dark Side, with the single exception of North Dakota. The force is strong in North Dakota.
  • Half a billion troops have been deployed across both factions.

One of my current favorite games!  I’m a Rebel!

It’s great seeing some major companies like the LucasArts division of Disney starting to use more infographics to promote their properties.  They have all of this data gathered internally about people playing the game, and it’s a great way to share some of these statistics.

The graphics are beautiful, the separation between factions is easy to understand with the color-coding, and the overall design is instantly recognizable as part of the Star Wars brand.

There’s no key to the scale in the Troops Deployed section at the bottom, and it’s not intuitive. I think each character represents roughly 500,000 troops in the first few, but then it gets weird because the Rebel Troopers, Stormtroopers and Banthas don’t make any sense. The Rebel Troopers would have to represent just over 700,000 troops for each icon. Beautiful design, but they got the math wrong so the visualizations don’t all match the data.

Also, the longer rows of characters are indecipherable. We can understand rows of 10 icons, but these varying rows of 7, 12 and even 20 icons across are not easy for readers to grasp.

It was very difficult to track down the original posting (thanks Bex!).  The footer should include the URL link back to the infographic landing page so readers can find the original, full-size version. You also want the infographic to help drive traffic back to your site, and most people that share infographics do NOT link back to the original. Include the link in the infographic so readers can always find their way to your site.

Found on: The Disney Blog

Monday
Jul292013

A #Sworcery Infographic


A Sword and Sworcery Infographic

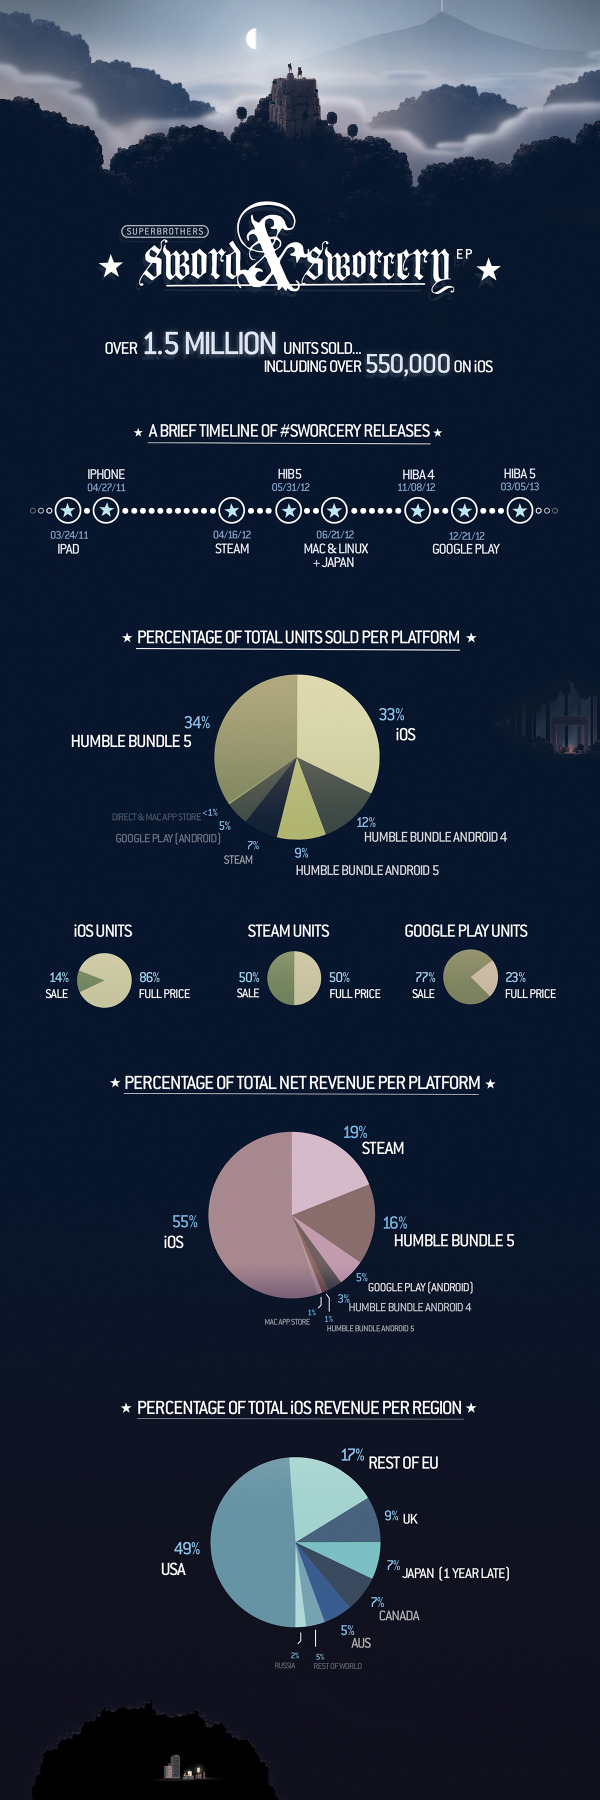
Two years ago Superbrothers: Sword and Sworcery EP was one of the first great games released that was designed specifically for the Apple iPad. Designed by Capybara Games, the game was also later released on iPhone, Android, Windows PC, Linux and Mac based on the huge success of the iPad version.

To celebrate the 2nd anniversary, Capybara Games released the Sword and Sworcery Infographic, and that’s cooler than a Trigon Trifecta!  (Also available on the SwordAndSworcery.com site)

From the Capybara Games site:


On March 24th, 2011 Superbrothers: Sword & Sworcery EP launched on iPad. The first hours after its release were exciting, stressful, celebratory and even terrifying (as game-centric twitter feeds exploded). We watched as the game hit the top 10 paid games chart before we were even featured. Leading up to launch we knew we had made something cool. After launch we knew there was an audience that appreciated it.

Over the next 2+ years, we brought the game to PC, Mac & Linux. We collaborated with the amazing folks from 8-4 to create a version specifically for Japan. With the help of Apportable, we brought the game to Android. We joined our close friends in the most successful Humble Indie Bundle of all time, and joined a great Android Bundle as well.

With over 1.5 million copies sold, it’s pretty obvious that #Sworcery has been a resounding success. And we’d like to share a few details of that success with you. There’s not that many titles out there that began on iOS and made their way to this many other platforms over time, so we hope that this info is helpful in some way/shape/form.


From such a visual game design, I would have liked to see the chart labels as icons of the companies instead of just text labels. Even better as 8-bit icons similar to the design of the game.


As I mention about many infographic designs, the URL to the original infographic landing page should be included in the footer of the design so readers can find the full-size version of the infographic. I had to shrink the infographic image to fit on the blog, like many people, and I always try to link back to the original source. Not everyone is good about linking, and you want the readers to be able to find their way back.

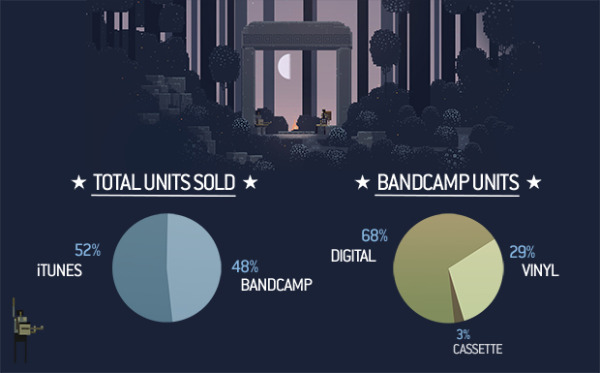
As a bonus mini-infographic, they also released some of the stats behind the music by rockstar & critically acclaimed composer Jim Guthrie soundtrack, Sword & Sworcery LP - The Ballad of the Space Babies, also available on the iTunes store.

Jim Guthrie Stats infographic

Found on The Verge and Daring Fireball.

Wednesday
Jun202012

The Trivi.al Side of Trivia

The Trivi.al Side of Trivia

Here’s some trivia on trivia! The history of trivia is mapped out in a board game fasion in The Trivi.al Side of Trivia infographic from trivi.al. The game we love is now an app! 

We’re a few days away from releasing our app Trivi.al. It’s in the hands of Apple now and we wanted to share with you an Infographic that we put together on the history of trivia called “The Trivi.al Side of Trivia.

It’s a fascinating industry with a lot of cool tidbits of knowledge we’ve throughly enjoyed learning about. And, this journey has led us to meet so really cool people from all over the world. We’ve talked with people from New York to London to Warsaw, Poland and many more in between. We’ve loved the journey so far and we hope it continues to grow as we introduce you to the app. Stay tuned and if you enjoy the infographic leave us a comment below. We’ll have some printed versions soon so if your interested let us know. Thanks

As a great way to promote thier new iOS app, Trivi.al created an infographic timeline history fo trivia that starts with taverns (places of ill repute) in Roman times and follows the trail throughout history leading up to their app launch.

Not much in the way of data visualizations, but the illustrations of celbrities, games and gameshows draw in the reader to see if they can recognize any of them.  Cool promotional infographic. 

Thanks to Joey for sending in the link!

Thursday
May312012

How Draw Something Blew Up Without Blowing Up

How Draw Something Blew Up Without Blowing Up

Now here is a game for everyone! It doesn’t matter how well you can draw, you can just draw and laugh with your friends at your attempts! This app has become very popular and quite quickly, the How Draw Something Blew Up Without Blowing Up infographic from The Next Web (with help from Couchbase) charts the growing trendiness of this game.

Draw Something was downloaded 50 million times in 50 days. Users created billions of drawings, adding 3,000 new pictures every second. On March 21st, OMPOP, the company behind the game, was bought up by Zynga for more than $200 million. On the first weekend in April, I downloaded the game for my first time and was admittedly addicted for 72 hours.

Today, a company called Couchbase gave us the exclusive on an infographic that charts the app’s viral growth. In case you’ve not heard of Couchbase, it’s the platform that enabled the game to keep up with its NoSQL database technology — from 6 database servers to more than 90 — without a second of game downtime. That’s impressive.

The infographic below charts the amount of user data, drawings per second, number of servers used to keep the game up and going and the number of users over 8 weeks of the game’s mind-blowing growth. The only question now is, will the game’s addictive nature keep fans or will they get over it as quickly as I have?

Intended as a quick summary of Draw Something’s growth, and Couchbase’s success in supporting their database expansion needs, this infographic does a good job.  Simple, easy-to-understand visuals, and use of some hand-sketch illustrations to reinforce how Draw Something works.

Some visualizations in the Billions of Drawings section would have been nice to communicate the immense scale of the growth numbers.  Most readers don’t truly grasp the difference between 10 million and 2 billion by just reading the text numbers.

Wednesday
Apr112012

Defense of the Ancients (DotA) Infographic

The Defense of the Ancients (DotA) infographic from GameArena.com takes game enthusiasts through a brief history of how the game came about!

Dota, Defence of the Ancients, is the latest hype in gaming. Initially developed as a modified game in Starcraft, the concept has now grown globally and has even made its way into professional competitions. Popular game titles that have implemented the “DotA” concept include Warcraft 3, DotA Allstars, DemiGod, League of Legends, Heroes of Newerth and Realm of the Titans. Two more upcoming titles that will certainly get the gaming world’s attention are DotA 2 and Blizzard DotA.

So what is DotA exactly? Our trusty graphics boffins have once again created the infographic below for the complete history on how the new genre came about.

The design style is certainly relevant to the game look-and-feel itself.  The timeline is odd that some events don’t have specific dates identified.  The use if icon illustrations for different concepts and company/game logos on the timeline helps the reader.  I would have liked to see some of the stats behind the game and its popularity.

Thanks to Eric for sending in the link!

Thursday
Dec082011

The Rise of Minecraft

This infographic from Jess Bachman at Visual.ly comes The Rise of Minecraft.  The vertical timeline shows the meteroic rise in popularity of the new game from Mojang.

November 18, 2011 marks the Minecraft release out of beta. Follow the rise of Minecraft, from it’s humble beginnings as a one-man experimental project to its overwhelming success in the gaming industry accruing over $1 million in weekly sales. With close to $0 spent on advertising, Minecraft’s popularity can be marked by this year’s sold-out MineCon event in Las Vegas, NV, on November 18 & 19.

I love the 8-bit design style to match the game itself.

Monday
Dec132010

The TRON Video Game Timeline


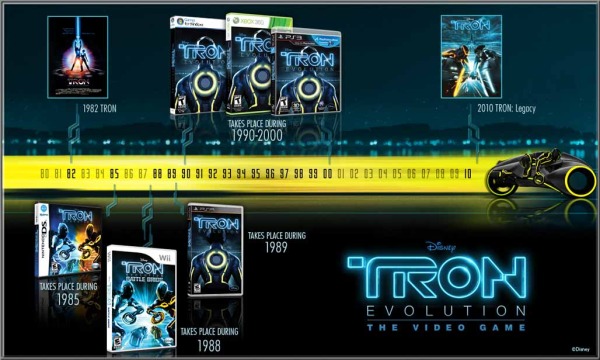
This is partially for fun because I’m excited about the upcoming TRON movie, and partially because this is something you would expect a fan to create and publish.  Instead, Disney created this simple TRON: Evolution timeline that explains where most of the TRON video games fit in history (TRON 2.0 is noticeably absent).  This is part of the product description page on Amazon.com.

It didn’t have to be complicated, but this timeline quickly and clearly communicates when each of the games takes place in reference to the movies.  It also nicely incorporates the design style of the new movie and uses the light cycle trail.

TRON Story Timeline

  • The TRON: Evolution video games are the key to unlocking the TRON mythology in between the original 1982 film and the 2010 blockbuster film TRON: Legacy.
  • Every game tells a different story of the digital grid and offers a completely unique gameplay experience designed specifically for each platform.

Nicely done Disney.  See you on the Grid! 

Thursday
Jul222010

Win Rock Paper Scissors Every Time [infographic]

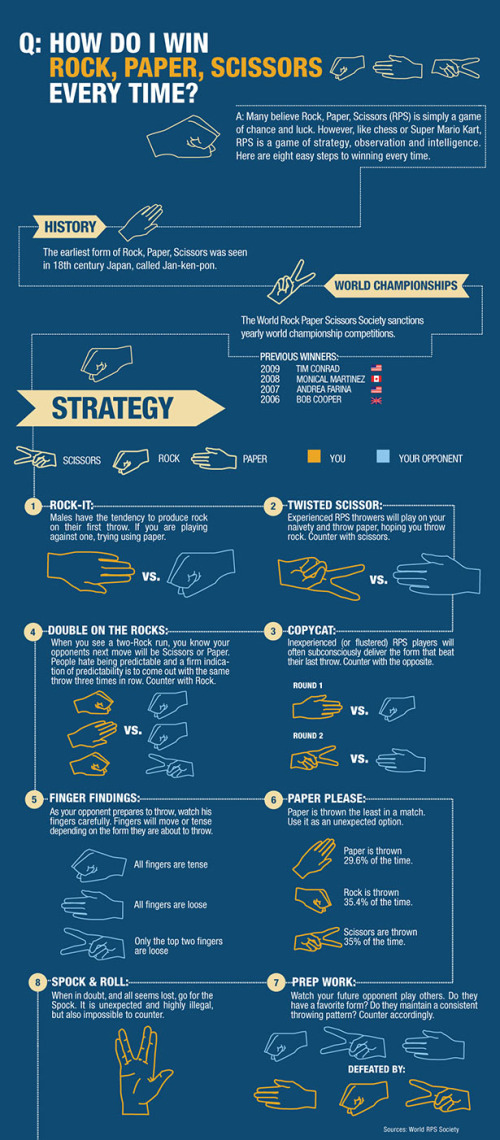
How Do I Win Rock Paper Scissors Every Time? is a cool infographic from chacha.com.

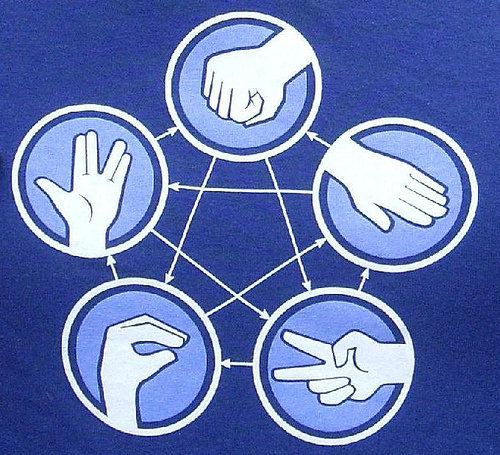
When you think you’re really good, move up to Rock-Paper-Scissors-Lizard-Spock!  Notice how the graphic shows who wins all of the combinations.