About
Randy Krum
President of InfoNewt.
Data Visualization and Infographic Design

Infographic Design

Infographics Design | Presentations
Consulting | Data Visualizations

DFW DataViz Meetup

Join the DFW Data Visualization and Infographics Meetup Group if you're in the Dallas/Fort Worth area!

Search the Cool Infographics site

Custom Search

Subscriptions:


Feedburner

The Cool Infographics® Gallery:

How to add the
Cool Infographics button to your:

Cool Infographics iOS icon

- iPhone
- iPad
- iPod Touch


Read on Flipboard for iPad and iPhone

Featured in the Tech & Science category

Flipboard icon

Twitter Feed
From the Bookstore

Caffeine Poster

The Caffeine Poster infographic

Entries in flowchart (38)

Friday
Mar162018

Where Constituent Input Ends Up


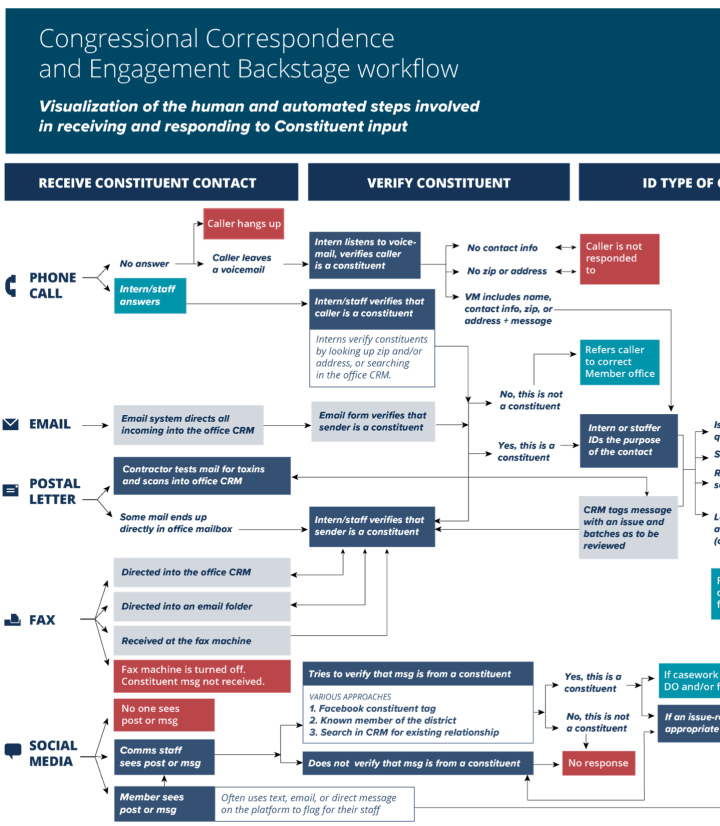
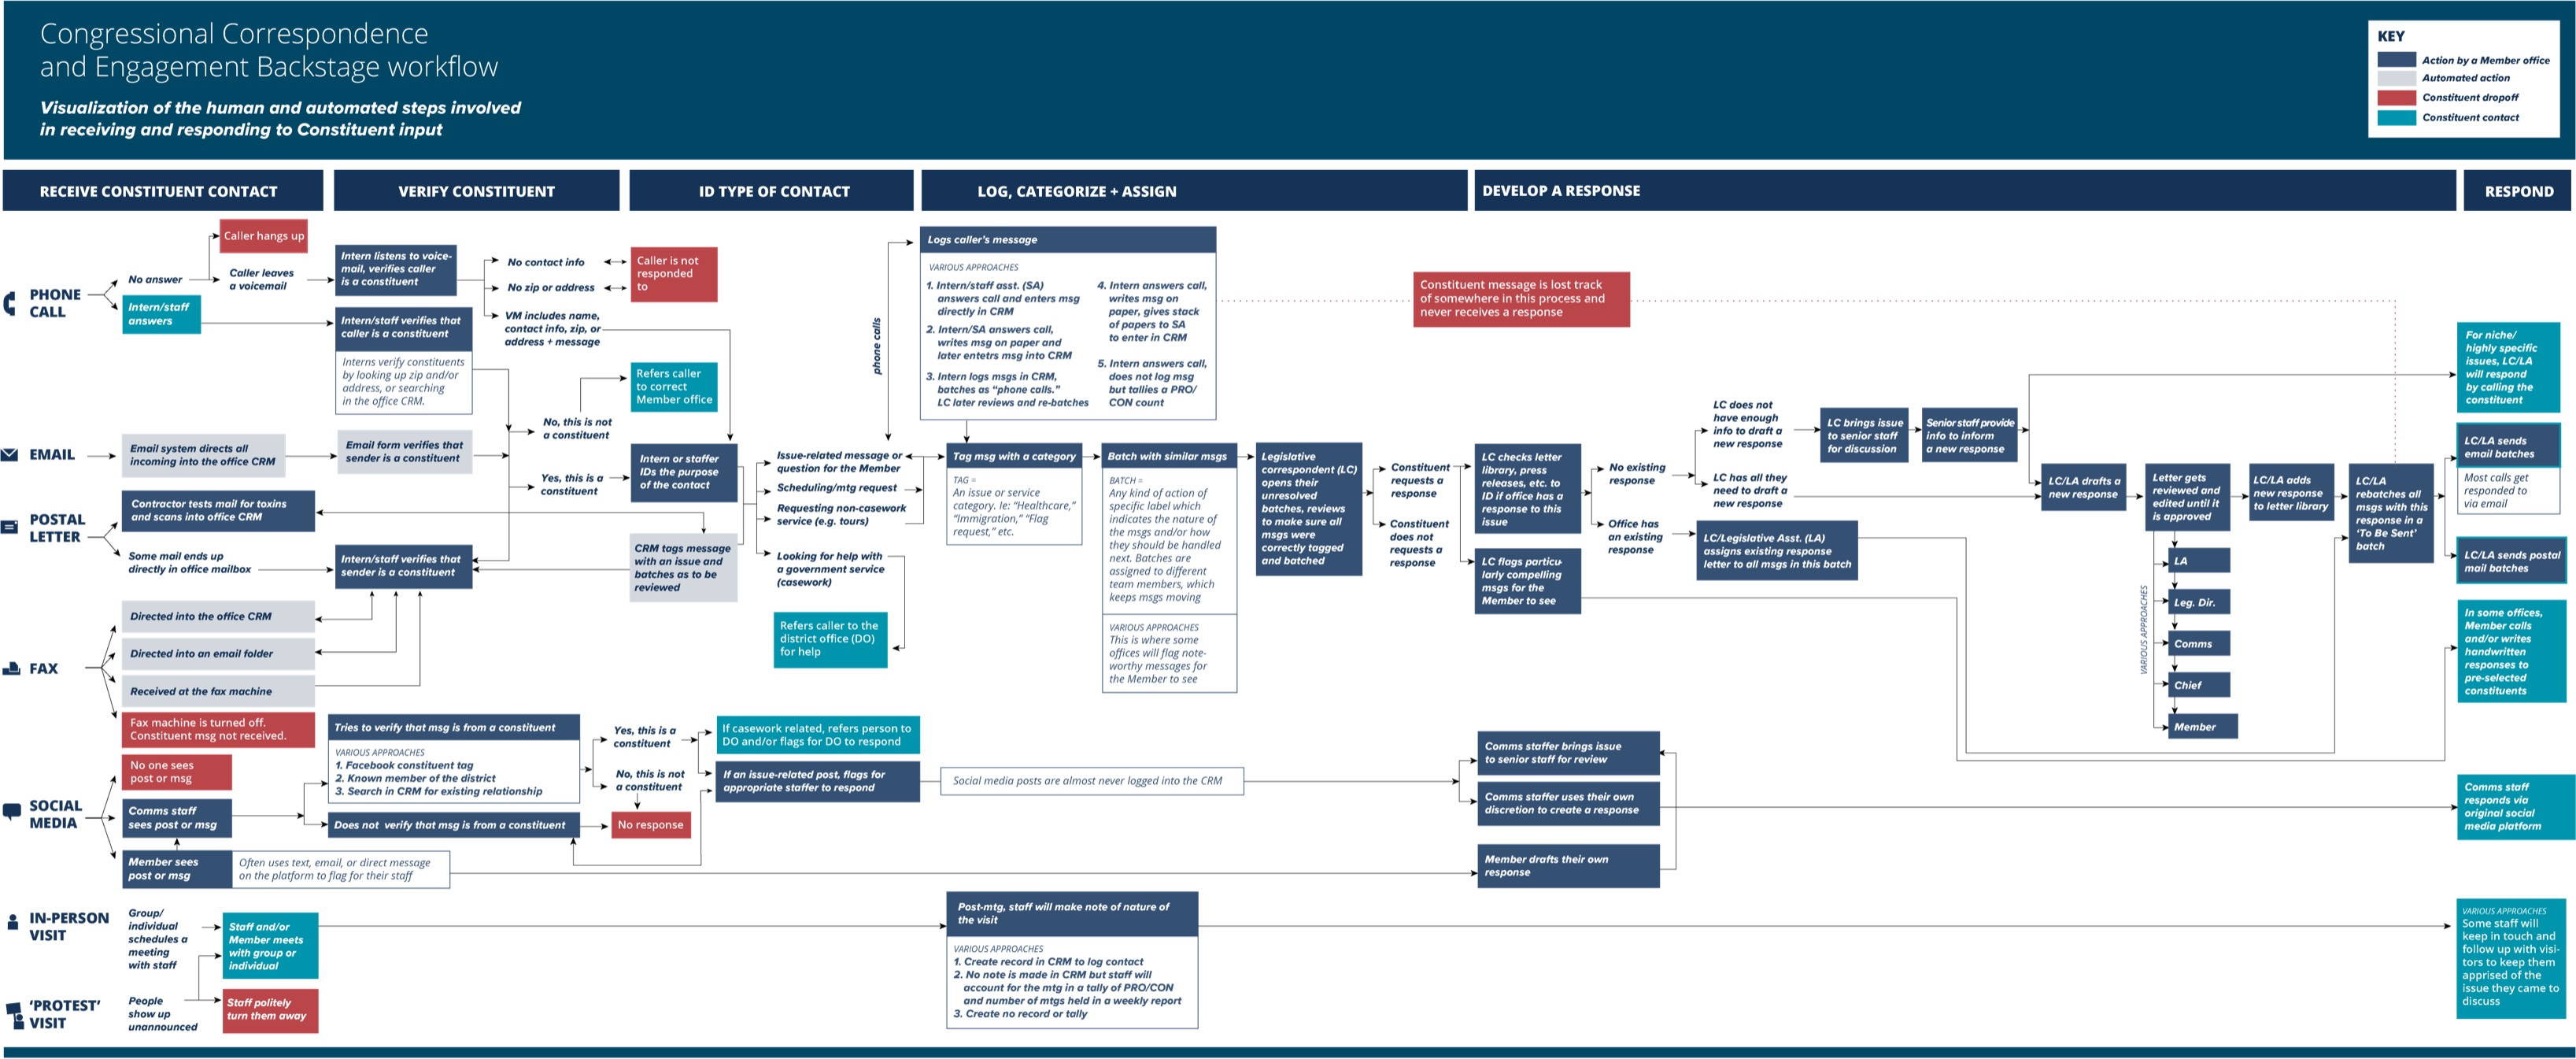
Where Constituent Input Ends Up infographic


Have you ever tried to reach out to Congress? There are multiple ways to contact them, but with the high volume of constituent input, there has to be a way to filter it. Where Constituent Input Ends Up flowchart from Flowing Data tells the story of how they organize and reply to the input they recieve. 


When you have input to send Congress, you have a number of communication options available to you: phone, email, social media, etc. Many of the bigger issues have dedicated sites that help automate some of the process, which of course leads to a large volume of input that lands in a congressperson’s voicemail, inbox, and notifications tab. Where does it all go?

The OpenGov Foundation looked into it and produced the From Voicemails to Votes report. The flowchart above is part of the report. Full version here.


Found on Flowingdata.com/

Wednesday
Mar072018

Which Sci-Fi Movie Should I Watch?

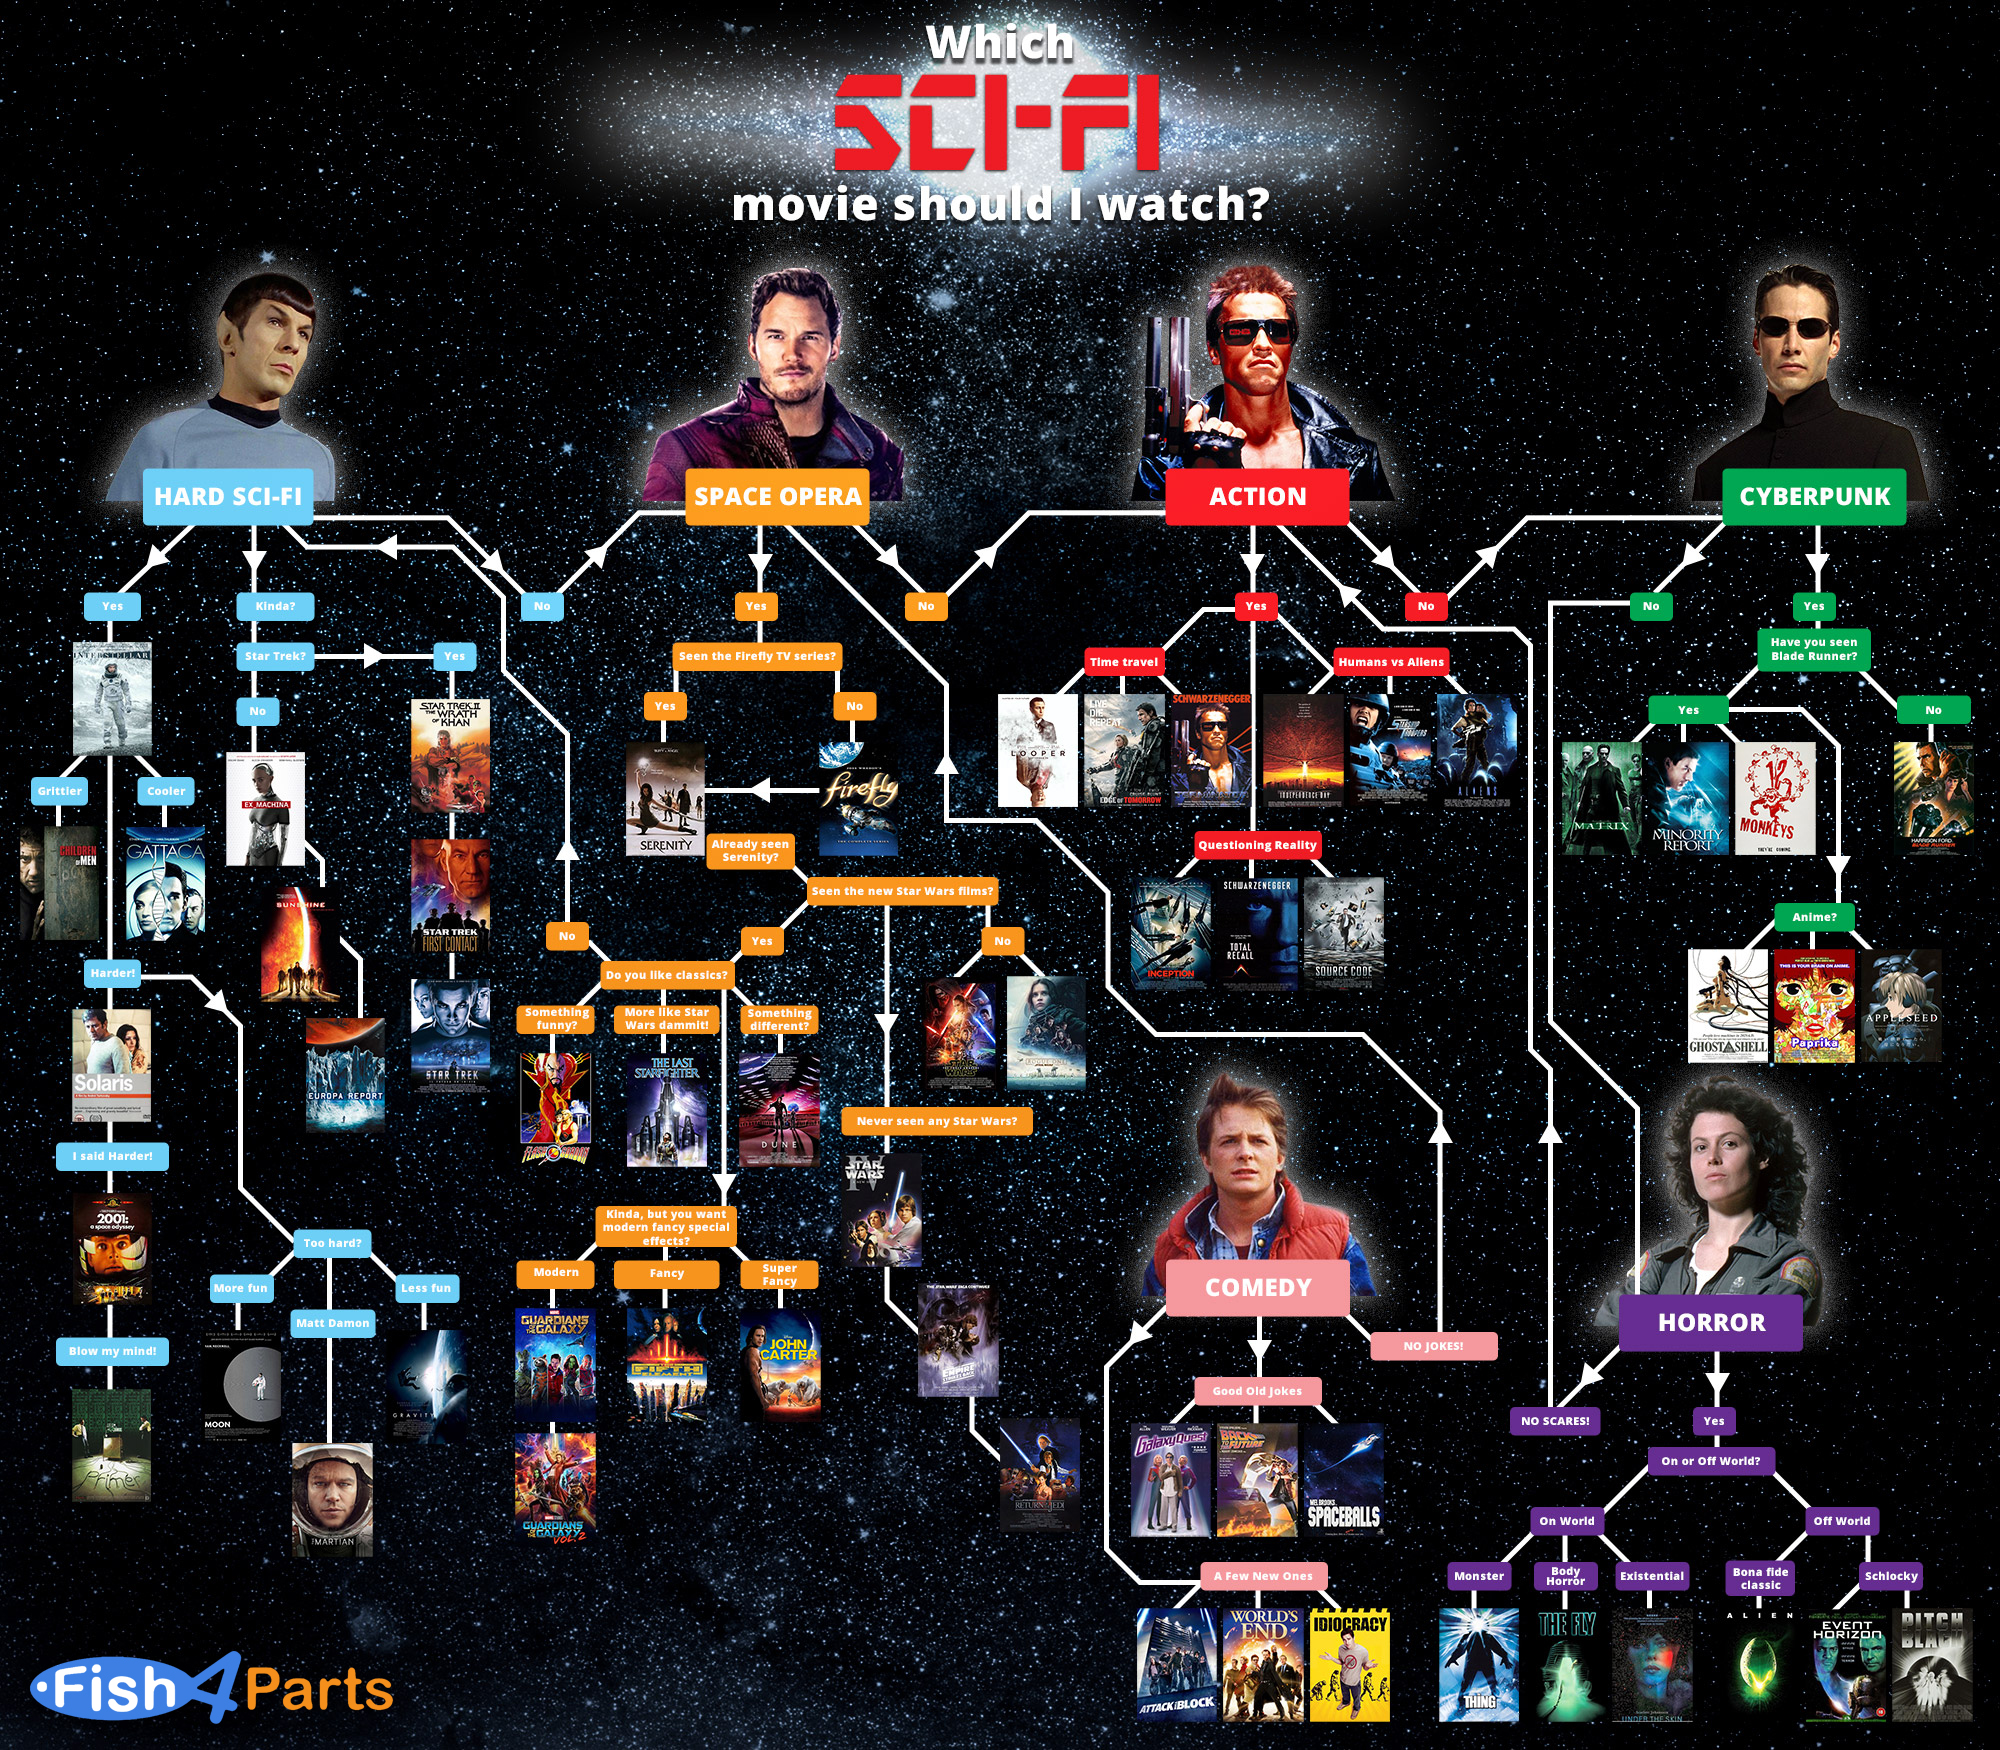
Which Sci-Fi Movie Should I Watch flow chart

Which Sci-Fi Movie Should I Watch flow chart from Fish 4 Parts is a reccomendation of a Sci-Fi films based on your genre of choice. 

If you’re wondering which film to watch tonight or this weekend, there’s a few we’d like to recommend. According to your taste, of course! We’ve focused on the best of Sci-Fi. If you fancy some Sci-Fi horror, comedy, action or something a bit different, but don’t know what to watch, take a look at this graphic!

Thanks to Dave for sending in the link!


Tuesday
Mar282017

Will Your Meeting Suck?

Will Your Meeting Suck? infographic

Are you in charge of scheduling meetings? We all know that nobody tends to like meetings. But you can use the Will Your Meeting Suck flowchart from Join Me to help schedule your next meeting. Avoid some mistakes and maybe you'll be the hero!

Take a spin through our infographic below to consider all the variables of your next meeting – time, location, snack situation – to help determine if your meeting will suck. Once you find out your risk level, you can do something about it

Decision diagrams and flow charts are good at sucking readers in to follow along the different paths.

Thanks to Don for sending in the link!

Monday
Jun082015

The Process of Designing an Infographic

The Process of Designing an Infographic

The Process of Designing an Infographic is an interactive design that outlines my own infographic design process. My data visualization and infographics design company, InfoNewt, uses this process when designing infographics for clients, and I teach this process in my workshops and classes. The team at Visme.co created an interactive infographic version of it using the Visme design platform. Visme.co is a fantastic online design platform for infographics, presentations, reports and more.

Most of my designs follow this 5-step process:

  1. Data Research - Start with the data. What's the insight or story?
  2. Wireframe - Wireframe your story before you start any design work 
  3. Design Concepts - Experiment with design ideas by creating rough concepts that visualize your data in a handful of different ways
  4. Iterate - Choose one design direction or combine a few different ideas from your concepts.
  5. Finalize - The final step is to finalize your design with the appropriate Copyright or Creative Commons license, and export the final design to a few different file formats as necessary. 

One of the advantages of using Visme as the platform to design your infographic is that you can create interactive elements in your design. In this case, you can see the original interactive version on the Visme site, that includes additional information when you mouse over each process step. This is built in Javascript, and anyone can share the interactive version by using the embed code on their own website.

You can embed the interactive infographic on your own site by using this HTML code:


Monday
Nov042013

Find The Best Group Exercise Class for You

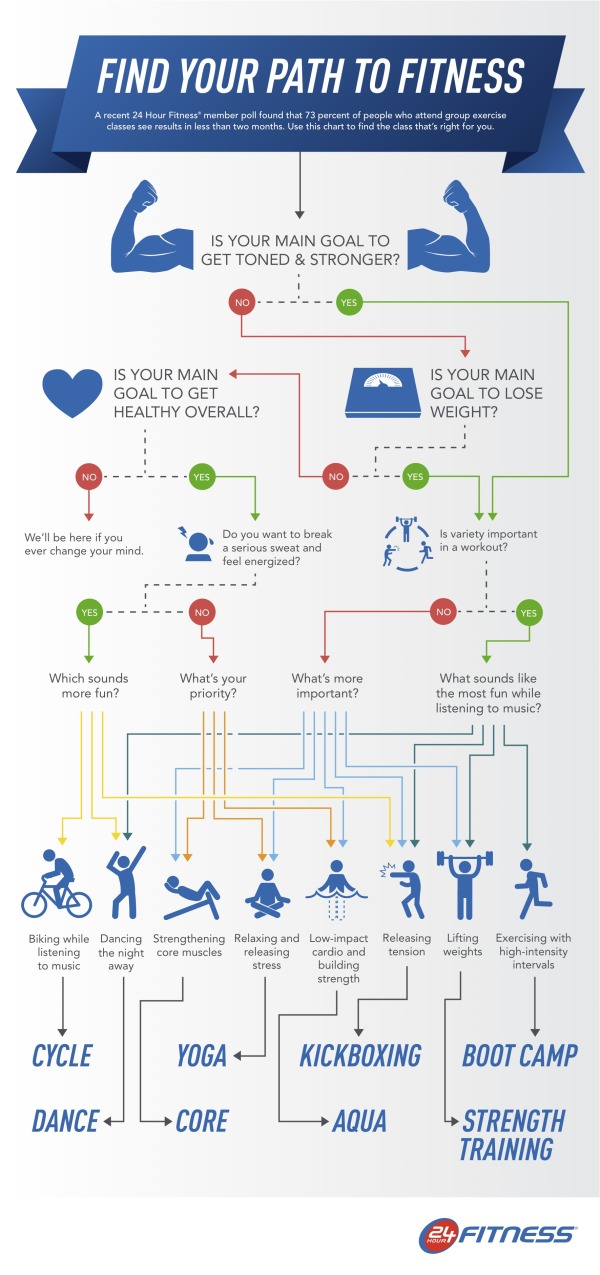
Find The Best Group Exercise Class for You infographic

24 hour fitness has created an easy to read flowchart to figure out the best group fitness class for your lifestyle in the infographic Find You Path To Fitness, a decision tree based on your wants.

A recent poll revealed 73 percent 24 Hour Fitness members see results in less than two months of participating in group exercise classes. With the popularity and effectiveness of group exercise, 24 Hour Fitness developed a fun, interactive infographic where readers can find out which group exercise class is the best fit for them, based on preferences and fitness goals. The Find Your Path to Fitness infographic, released today, leads readers through a series of questions and directs them to the group workout they’ll find most beneficial.

This is a great design. 

  • Visually appealing
  • Minimal text, the icons and diagram tell most of the story
  • Clear, focused message.  No extraneous data included, which keeps the design simple
  • Topic highly relevant to 24 Hour Fitness without being an advertisement
  • Long online lifespan.  This infographic will be informative to readers for years to come

The footer should include copyright information, and the URL link to the original infographic landing page so readers can find the full-size version.

Thanks to Alafair for sending in the link!

Wednesday
Sep252013

Your One Month Guide To Beating Clutter

Your One Month Guide To Beating Clutter infographic

Clutter is everywhere. No matter what we seem to do, it just accumulates. Your One Month Guide To Beating Clutter infographic from Terrys Fabrics gives some helpful hints with a flowchart on how to decide what can be saved vs. tossed. There are also some specific tips based on areas of your home to help minimize clutter.

De-cluttering can sometimes be overwhelming. A room-by-room approach can make the process more manageable. By starting small and keeping up good habits, you can soon work your way towards clutterless bliss.

Thanks to Meilen for sending in the link!

Monday
Aug122013

Design Client Engagement Poster

Design Client Engagement Poster

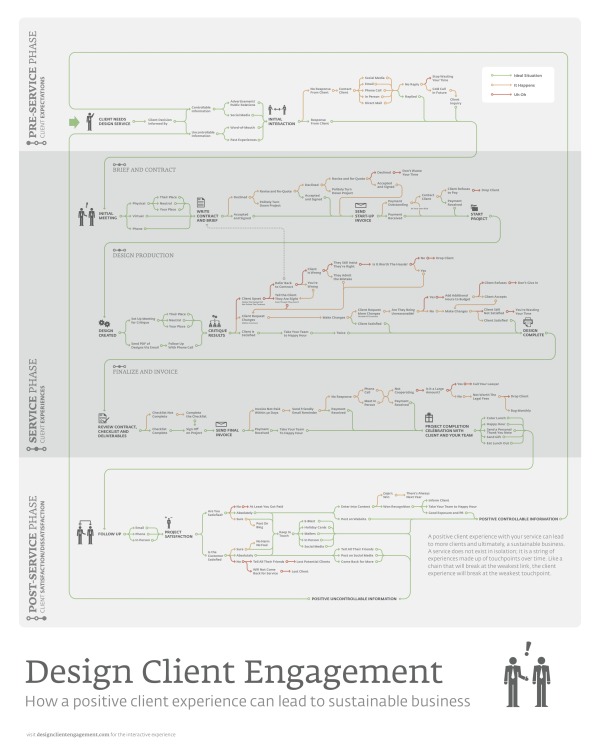
The Design Client Engagement Poster argues that a positive client experience can lead to a sustainable business. The poster separates the experience into 3 phases. The Pre-Service Phase is about client’s expectations, the Service Phase is about the client’s experiences, and the Post-Service Phase is about client satisfaction/dissatisfaction. This poster can be found on Design Client Engagement.com and is available for purchase for $25 + shipping here.

A positive client experience with your service can lead to more clients and ultimately, a sustainable business. A service does not exist in isolation; it is a string of experiences made up of touchpoints over time. Like a chain that will break at the weakest link, the client experience will break at the weakest touchpoint.

Cool visual explanation design created by Matt Pasternack from Nack Creative can be found on www.designclientengagement.com!

Monday
Jul222013

What the Health? Understanding Obamacare's 11 Year Health Plan

What the Health? Understanding Obamacare's 11 Year Health Plan infographic

Interested in the new health plan but have no idea what it means? What the Health? Understanding Obamacare’s 11 Year Health Plan infographic from Clarity Way breaks down each year of the 11-year health care plan of Obamacare. 

If the re-election of Barack Obama as America’s 44th President of the United States means anything, it is that American citizens can expect a little more consistency within their legislation. Among the most notable acts of legislation promised by Obama during both of his campaigns for the Presidency was the concern over America’s health care system.

When our 44th President first earned his chair in leading the nation, he immediately took initiative to put into action a new proposal for health care reform called the Affordable Care Act. And now that he has regained his position, we can count on seeing this initiative furthered in the next 4 years!

But among this 11 year plan was a ton of confusing political jargon, making it easy for Americans to misinterpret how the Act would impact themselves and their nation. So as a duty to our followers and role in the promotion of health, we wanted to create a little bit easier of an explanation of the Affordable Care Act!

This health reform infographic breaks down the Affordable Care Act in an effort to explain how it will affect each and every citizen, from small businesses to large ones, college students to parents, and senior citizens to the young! It’s important that you know about the Affordable Care Act and understand that if we had maintained our status-quo, over 14,000 Americans would lose their health insurance daily!

I think there’s too much text in this design, but it does walk the reader through each year, step by step.  The statistics should have been visualized.  Big fonts are NOT data visualizations, and I see this done by designers all the time.  Big fonts don’t provide any context, and don’t make the numbers any easier for the audience to understand.

Thanks to Adrienne for sending in the link!

Thursday
May162013

The Stephen King Universe

The Stephen King Universe infographic poster

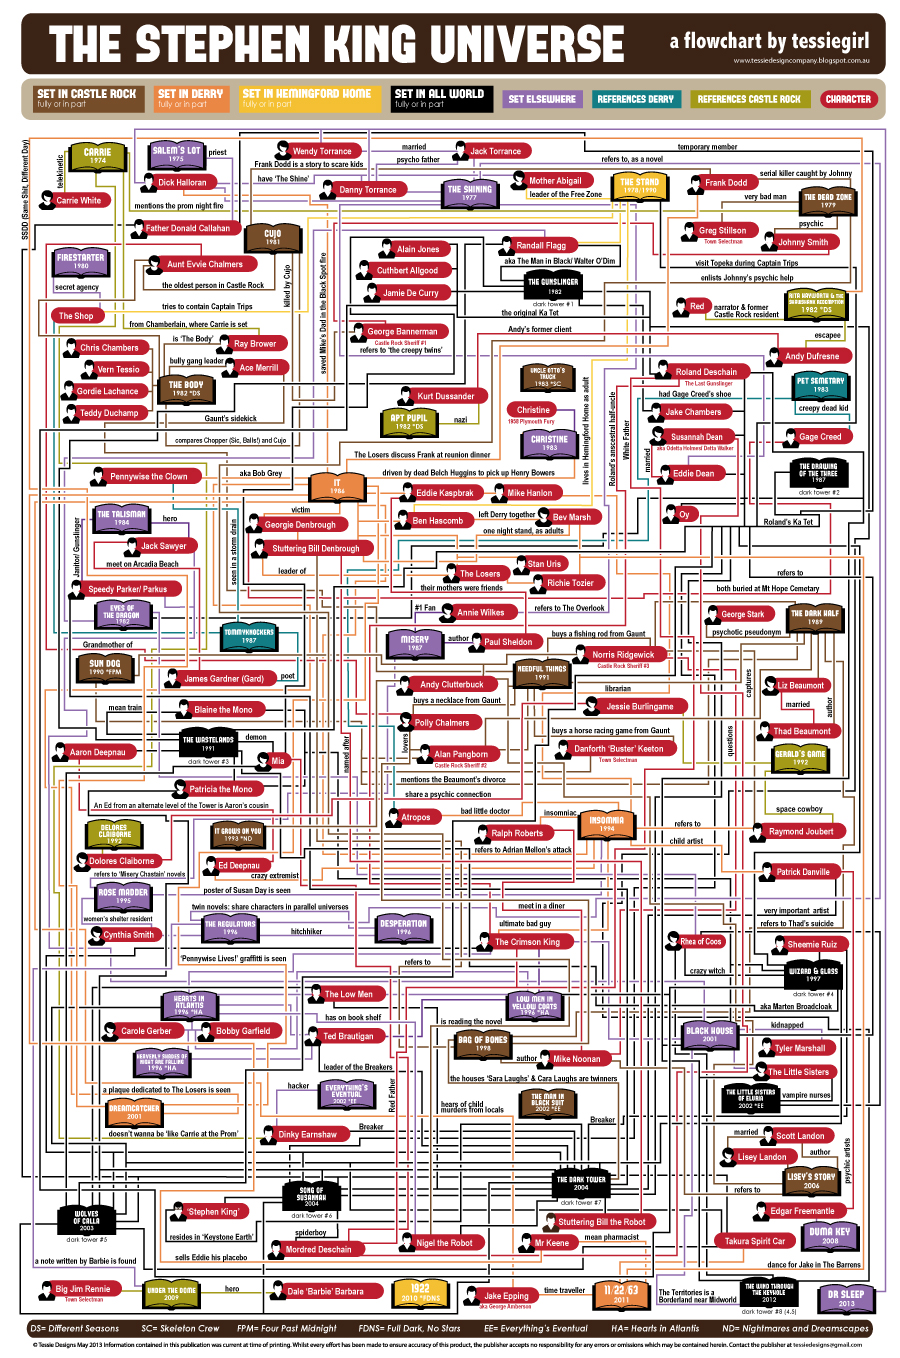
Are you a Stephen King fan? Have you yourself made these connections? From TessieGirlThe Stephen King Universe has been updated to include the many connections to the Dark Tower series.

When I was in Grade 5 (guess I was ten), my friend Tarnya Smyth brought her mum’s battered copy of Stephen King’s ‘Carrie’ to school. We broke it into about 4 pieces and passed them around, all taking turns reading each battered section. I told mum about it and she FLIPPED HER WIG and told me to ‘Stop reading that book immediately!!’ So I finished it.

Now, I TOTALLY do not recommend  ten year olds reading Stephen King books (messed me up good), but this was when my life long relationship with Mr King began. My love for his books is based around his characters. They are so full. I love Stephen King dialogue. I love his sense of humour. And I love the links and connections between the books. I am the kind of annoying person who likes to know the ‘In Joke’. So, of course, I MADE A FLOW CHART!!!

This chart is like my fourth child. Be kind to it. It means a lot to me.

I wish they had published a higher-resolution version online.  Some of the text is too small to read, but I think I can follow all of the connections.  A must have for any Stephen King fan!

Also, it’s available for purchase as a poster from the TessieGirl site for $25 plus shipping from Australia.  You can also see the original version.

Thanks to Becky for sending in the link!

Monday
Sep242012

Star Wars Infographic Flowcharts

Star Wars infographics

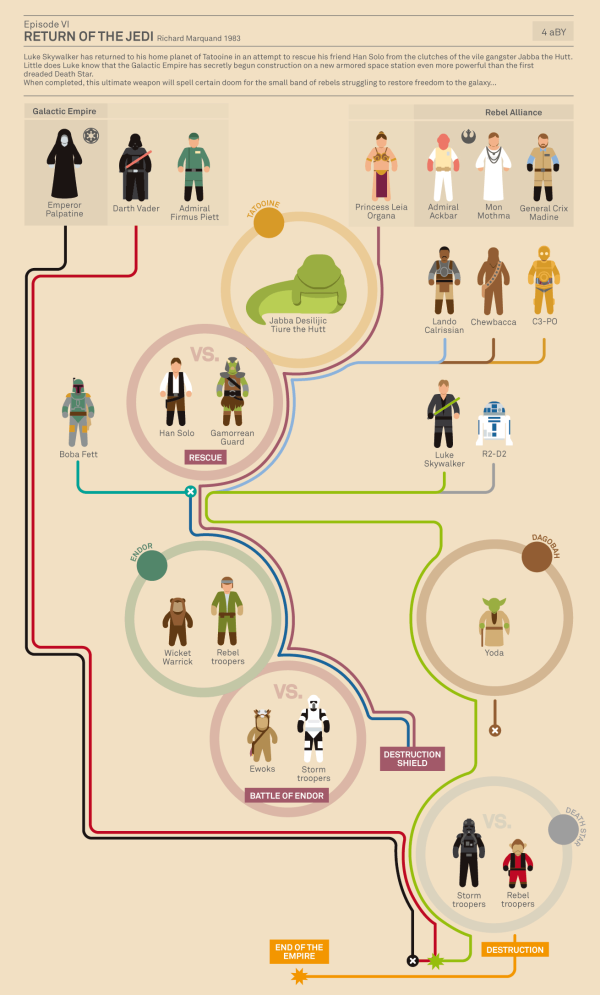
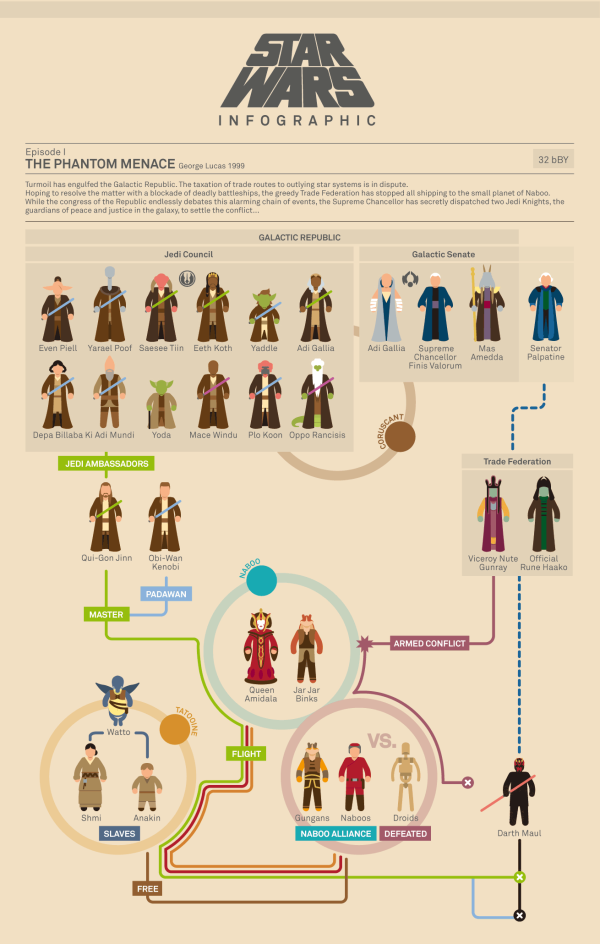
Marc Morera has designed some amazing Star Wars infographics charting the character progression, deaths and conflicts in the Star Wars movies, the animated series, comic books and major novels.  On the landing page, you will find them organized chronologically, so the Animated Series fits in between movies II and III.

Characters are illustrated as recognizable isotypes.  Each character’s plot line is color-coded, and the lines from the appropriate characters converge at circles representing the major conflicts along each story timeline. 

Star Wars infographics

The two examples shown here are reduced in size to fit on the blog, so go check out all of them on Marc Murera’s site for high-resolution versions.