About
Randy Krum
President of InfoNewt.
Data Visualization and Infographic Design

Infographic Design

Infographics Design | Presentations
Consulting | Data Visualizations

DFW DataViz Meetup

Join the DFW Data Visualization and Infographics Meetup Group if you're in the Dallas/Fort Worth area!

Search the Cool Infographics site

Custom Search

Subscriptions:


Feedburner

The Cool Infographics® Gallery:

How to add the
Cool Infographics button to your:

Cool Infographics iOS icon

- iPhone
- iPad
- iPod Touch


Read on Flipboard for iPad and iPhone

Featured in the Tech & Science category

Flipboard icon

Twitter Feed
From the Bookstore

Caffeine Poster

The Caffeine Poster infographic

Entries in subway (18)

Monday
Jan092017

Navigating The Agile Landscape

Navigating The Agile Landscape infographic

The Agile Landscape v3 is a visualization of many of the methodologies within the Agile Process by Chris Webb from Deloitte that uses the visualization design style of a subway map to group related activites and the show connections. Chris posted a longer description of the design on the Deloitte blog: Navigating the Agile Landscape

Chris Webb:

Being Agile isn’t as simple as following one single methodology. In fact, Agile encompasses a number of different practices and frameworks, often referred to as “the Agile umbrella.” For an organisation to be successful in adopting Agile ways of working, it requires the right technique/method to be used to address the problem or need.

Given there are so many different Agile frameworks, a challenge many organisations or individuals face is deciding which framework to use and in which context. In this post, we use an analogy to help bring some light to this.

We like to conceptualise Agile as a highly interconnected landscape of practices transporting ideas across zones to value. There is no perfect starting point, nor an express line or a direct route suiting all conditions.We’ll leave you to explore the Agile Landscape, and leave you with this:

Do not be afraid to try, learn and adapt practices to your situation. The truth is, no one framework is better than another. Although when it is contextually applied, a framework or selection of practices from multiple frameworks will be best suited.

We are continuously evolving this view to include new practices and ways of working. If you see a framework that is missing and would like to see it added to this view, or if you would like a larger version of the Agile landscape please reach out at chwebb@deloitte.com.au

I often teach students to experiment by mixing different data visualization methods with different kinds of data, and good designs like this are often the result.

My criticism of the design would be that the overall feel is way too complicated because many of the paths have unnecessry curves and loops to fit within the constraint of a 4:3 aspect ratio of a presentation slide. The design would be easier to understand and appear more elegant if the paths were staightened out. This would make a larger design, but viewing online or using a 16:9 presentation slide would eliminate the constraint.

Wednesday
Apr022014

The Enterprise Mobility Ecosystem Map

The Enterprise Mobility Ecosystem Map infographic

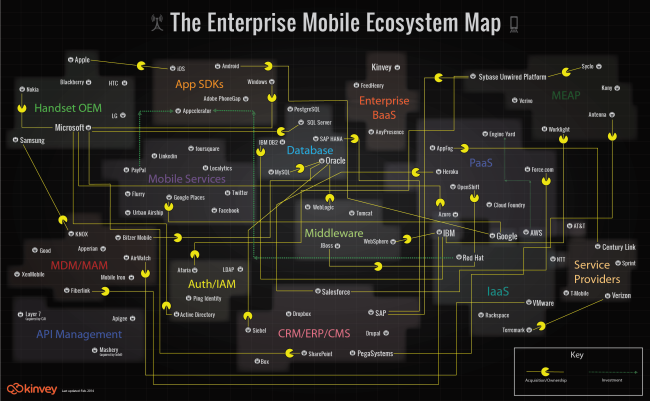
The Enterprise Mobility Ecosystem Map published by Kinvey attempts to make sense of the ownership and acquisitions rapidly taking place within the mobile backend providers.  Platforms for authorization, payments, location services and software development kits (SDKs).

Enterprise mobility is a classic IT disruptor. It’s the kind of disruptor that companies like IBM, Oracle and VMware, SAP, Salesforce, etc. were built on. It may look like a peripheral part of IT infrastructure now, but since mobile will be the primary access point to apps and data for many enterprises, many — if not most — new apps are going to be “mobile first.” Thus, the entire IT infrastructure is going to have to become very mobile friendly, very quickly, or else risk becoming a legacy platform.

As a consequence, major IT vendors are partnering with or acquiring companies throughout the mobile stack. Market consolidation and investments have taken place in MDM, API Management, cloud and handset markets. To visualize this activity, we’ve produced the Enterprise Mobile Ecosystem map below.

A network map visualization like this can help companies figure out where their business plays, and how other company acquisitions around them may impact their business.  I like that the design is purely informational, and doesn’t add a lot of extra data or information to the design.  The message is all about the connections, and doesn’t include things like the size of the companies or the value of the acquisitions.  This keeps the infographic focused on telling one story really well.

I would recommend using the company logos in the subway map style design to make it faster and easier for the audience to recognize the companies involved.  It’s much harder for the readers to read all of the company names in text to find the companies they recognize.

The Pac-man icons are a nice touch to indicate the direction of ownership or acquisition.

Friday
May032013

Subways of North America

Subways of North America infographic

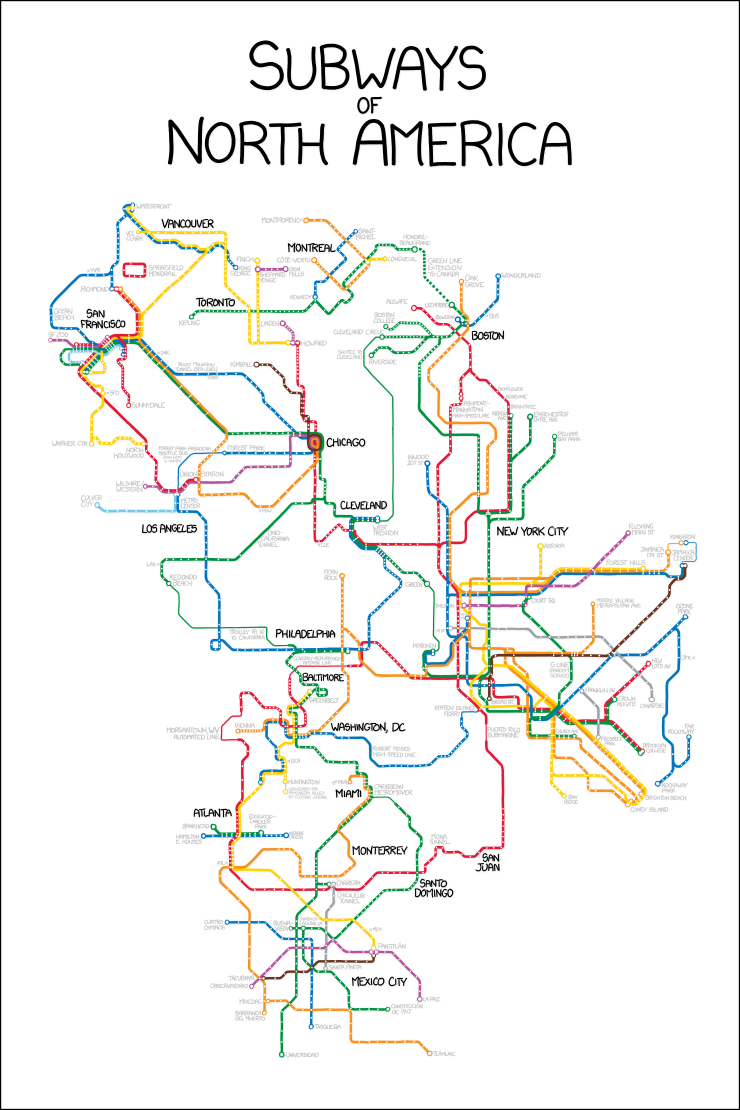
Now this is truly meta.  A subway map visualization of all the Subways of North America from Randall Monroe of xkcd.com.

For the pedantic rail enthusiasts, the definition of a subway used here is, with some caveats, “a network containing high capacity grade-separated passenger rail transit lines which run frequently, serve an urban core, and are underground or elevated for at least part of their downtown route.” For the rest of you, the definition is “an underground train in a city.”

About one in three subways stops in North America are in NYC

Another great design from Randall!

Wednesday
May182011

Microsoft Acquisitions Subway Map #infographic

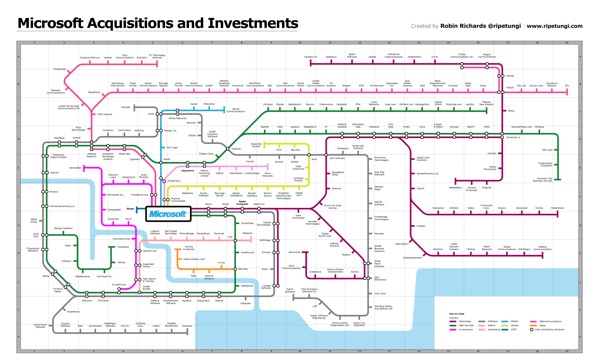
Robin Richards (@ripetungi) recently updated his fantastically detailed subway map of Microsoft Acuisitions and Investments.  Although Robin is the Information Design Director at JESS3, this is one of his personal projects.

Infographic showing the acquisitions and investments of Microsoft, done as a tube map with each coloured line representing a different industry for each acquisition or investment.  Where the stations meet is where the two industries overlap.  The key at the bottom displays information about the location on the map of the station (company) the year of acquisition or investment.


This thing is big!  Poster-sized big.  I dropped the link into Zoom.it so it would be easier for you to zoom in closer and see the details.


Great job Robin!  I love this project.

Wednesday
Dec292010

The Ride of Your Life


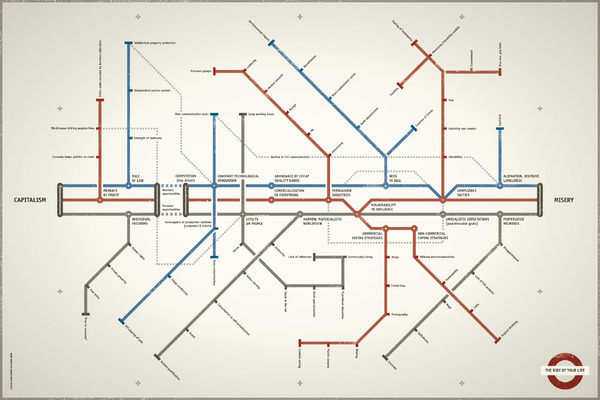
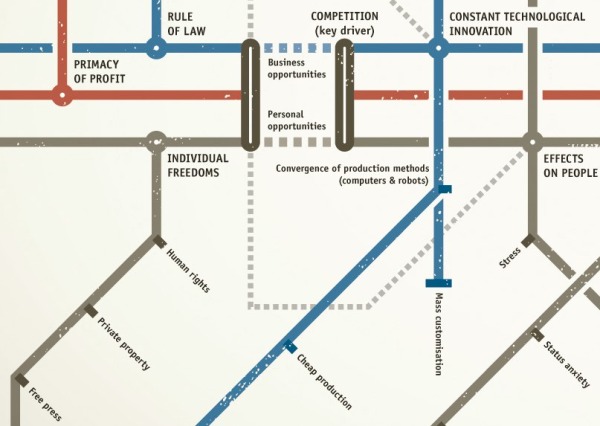
The Ride of Your Life is a very cool, interesting infographic using the subway map design style to show the potential dark side of capitalism.  Created by Lazar Dzamic, Digital Planning Director at Kitcatt Nohr Alexander Shaw in London and designed by Vladan Srdic, Partner and Creative Director at Studio360.

As a reader, you really need to look closely, and appreciate the level of detail and connections included in this design.  The overall message is that the dark side of Capitalism “can” lead to Misery, and the branches explore different aspects of business and personal life influences.


Lazar provided some behind-the-scenes information behind the making of The Ride of Your Life:

“The whole thing was inspired by two books that I would strongly recommend to any communications professional: Robert Cialdini’s ‘Influence: the psychology of persuasion’ and Oliver James’s ‘Afluenza’. Cialdini is a world renowned academic in social psychology applied to persuasion, while James is a psychologist dedicated to investigating the origins of what we also know as the ‘status syndrome’.

I was intrigued by the fact that people in liberal capitalist societies tend to feel less happy than in many others with significantly (sometimes shockingly) less wealth. Which made me think of the role of persuasion industries in that phenomenon.

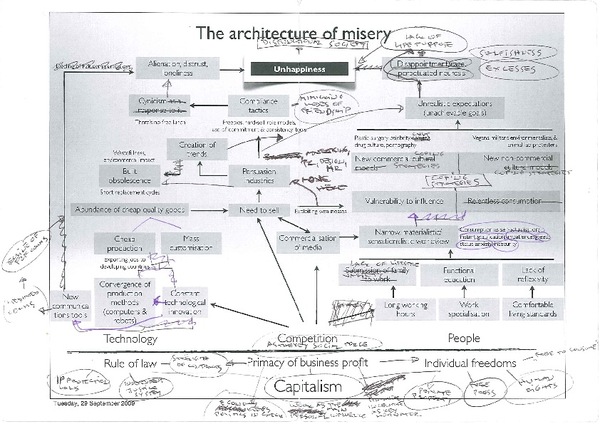
I did the original drawing in one short but frantic session on the inner back cover of Cialdini’s book, but the initial structure has evolved over the last few months, to the one that you see here. The original title was ‘The architecture of misery’ but then I realised that I need a visual partner who will bring it to life. Enter Vladan Srdic, my friend and an incredibly gifted designer from Slovenia, and the ‘spiritus movens’ behind the design Studio 360 in Ljubljana. He not just brought the structure to life by replacing my pitiful clouds with the stylish metro map but also changed its title into ‘Ride of your life’ - which I infinitely preferred.”


Lazar was also gracious enough to share one of his early drafts so Cool infographics readers could see how far the final infographic had evolved from the initial idea.


Fantastic job Lazar for going through the whole process and making your thoughts become a reality.  I want to see the next version exploring the good side of Capitalism!

Wednesday
Sep082010

The Most Widely Spoken Languages of the World

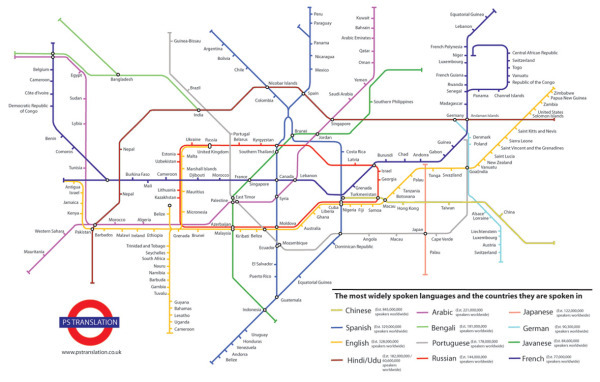
A subway map style infographic, The Most Widely Spoken Languages of the World, shows some of the primary countries and the languages they speak.  Each track is a different language, and the connection point are countries where that language is one of the dominant languages.  The actual number estimates behind how many people speak each of the top languages is listed in the legend.

I don’t know how accurate it is because the data source isn’t listed.  I would think that the U.S. would at least be a junction point between English and Spanish (and maybe others).

This infographic illustrates the most widely spoken languages in the world and some of the countries these languages are spoken in.  The station name indicates the language and the number of speakers that languages has and the map illustrates some of the countries these languages are spoken in.  The list of countries is not exhaustive but can help the viewer navigate the world of languages.
The inspiration for this map came from the London Underground map – which in fact is not a map but a schematic diagram. As a schematic diagram it shows not the geographic but the relative positions of stations along the lines, stations’ connective relations with each other and their fare zone locations.

This infographic has been commissioned by PS Translation to showcase their range of
translation services.

I also think this is a fantastic example of a infographic used for marketing purposes.  It’s not an outright advertisement, but it is certainly a related topic to a translation service done in a very appealing design style.

Thanks for the link James!

Wednesday
Sep012010

Subway Science: 500 Years of Great Scientists

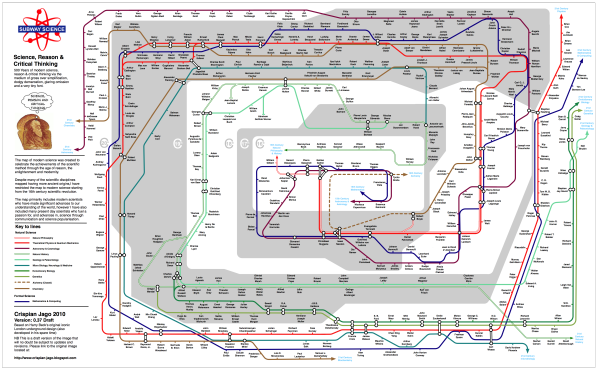
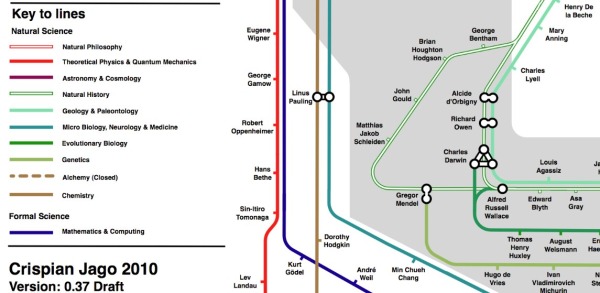
Crispian Jago created this great subway map of the top scientists in the last 500 years.  Subway Science plots the science celebrities by discipline (subway track), connections where appropriate and the shaded rings in the background show the timeline by century (the outer ring is the 20th century).  Sir Isaac Newton crosses 5 lines…either a great multi-tasker or ADHD.


You can see that Crispian has tagged this as DRAFT version 0.37, and he already has a huge number of comments on his Science, Reason and Critical Thinking blog post.  I expect there will be revised versions in the future.

Where’s Sheldon Cooper?!?

Found on Bad Astronomy and Visual Loop

Tuesday
Jul272010

The Yahoo! Developer Network Metro Map

The Yahoo! Developer Network Metro Map is a subway map of the Yahoo! Developer Network of APIs and services by Jinho Jung.

Found on Social Media Graphics

Thursday
Mar112010

Underskin: The Human Subway Map

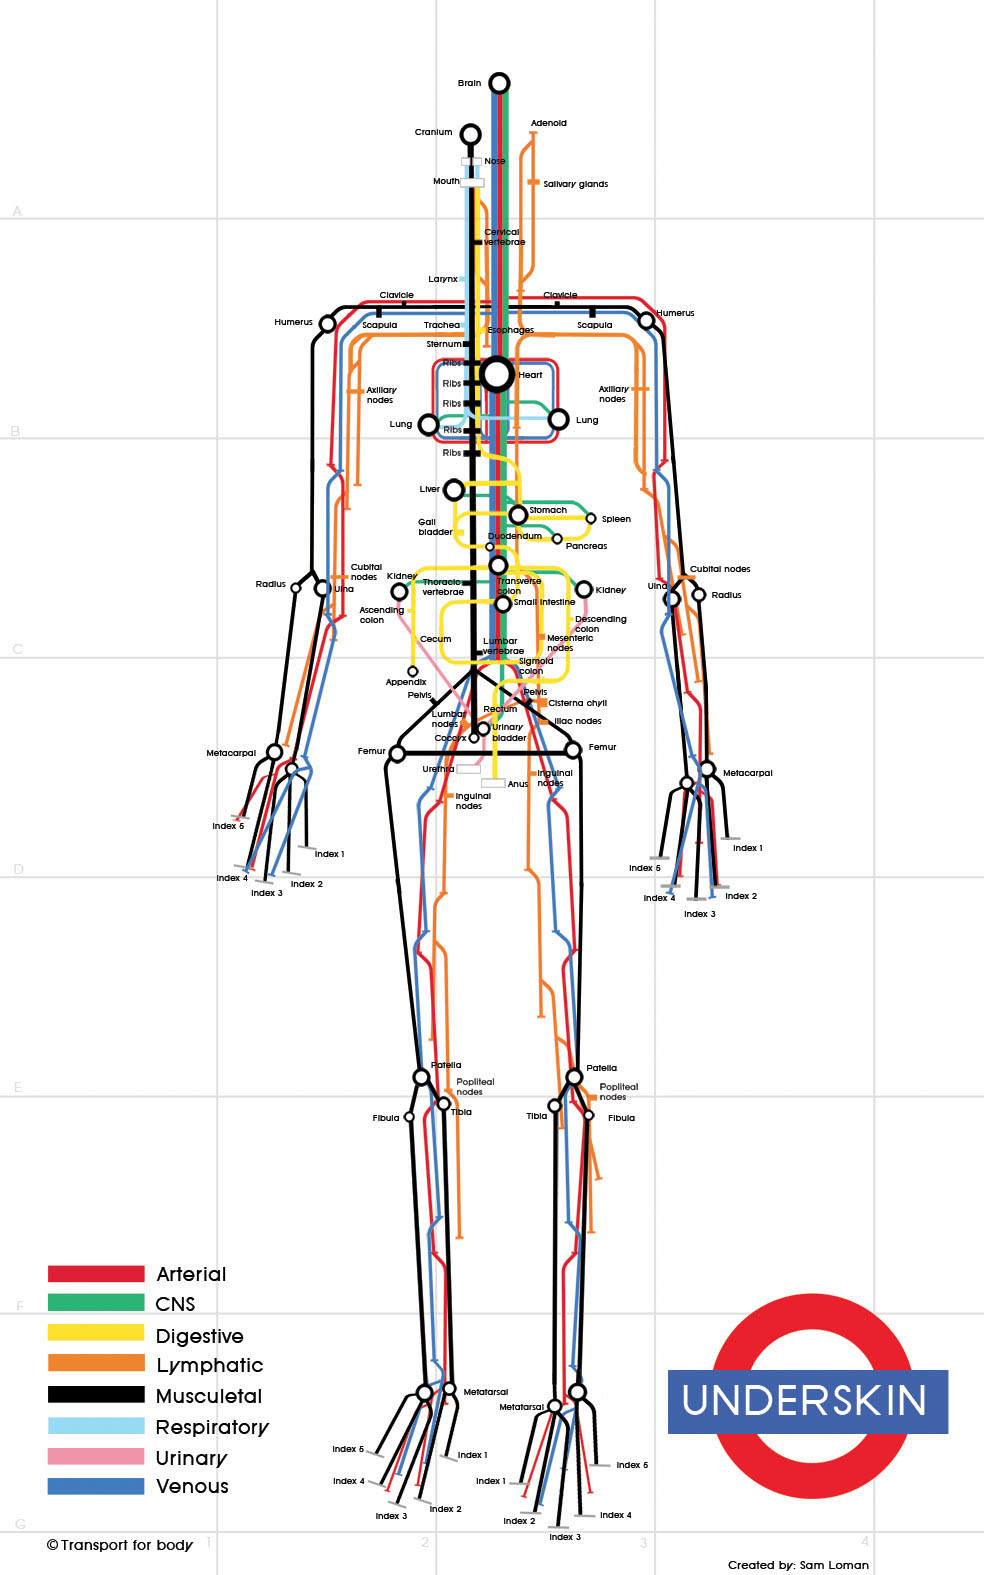
Sam Loman has taken the subway map infographic style to the human body.  Underskin is an infographic that traces the routes of eight different systems within the body (Digestive, Respiratory, Arterial, etc.), and highlights the major connection points.

You can see Sam’s work on just-sam.com, but the image there is low resolution.  She sent me the image above so you could see the high-resolution details.  Thanks Sam!

Found on VizWorld and Information Aesthetics.

Monday
Jan042010

Visual Mapping Blogroll - Subway Map of Infographic Websites


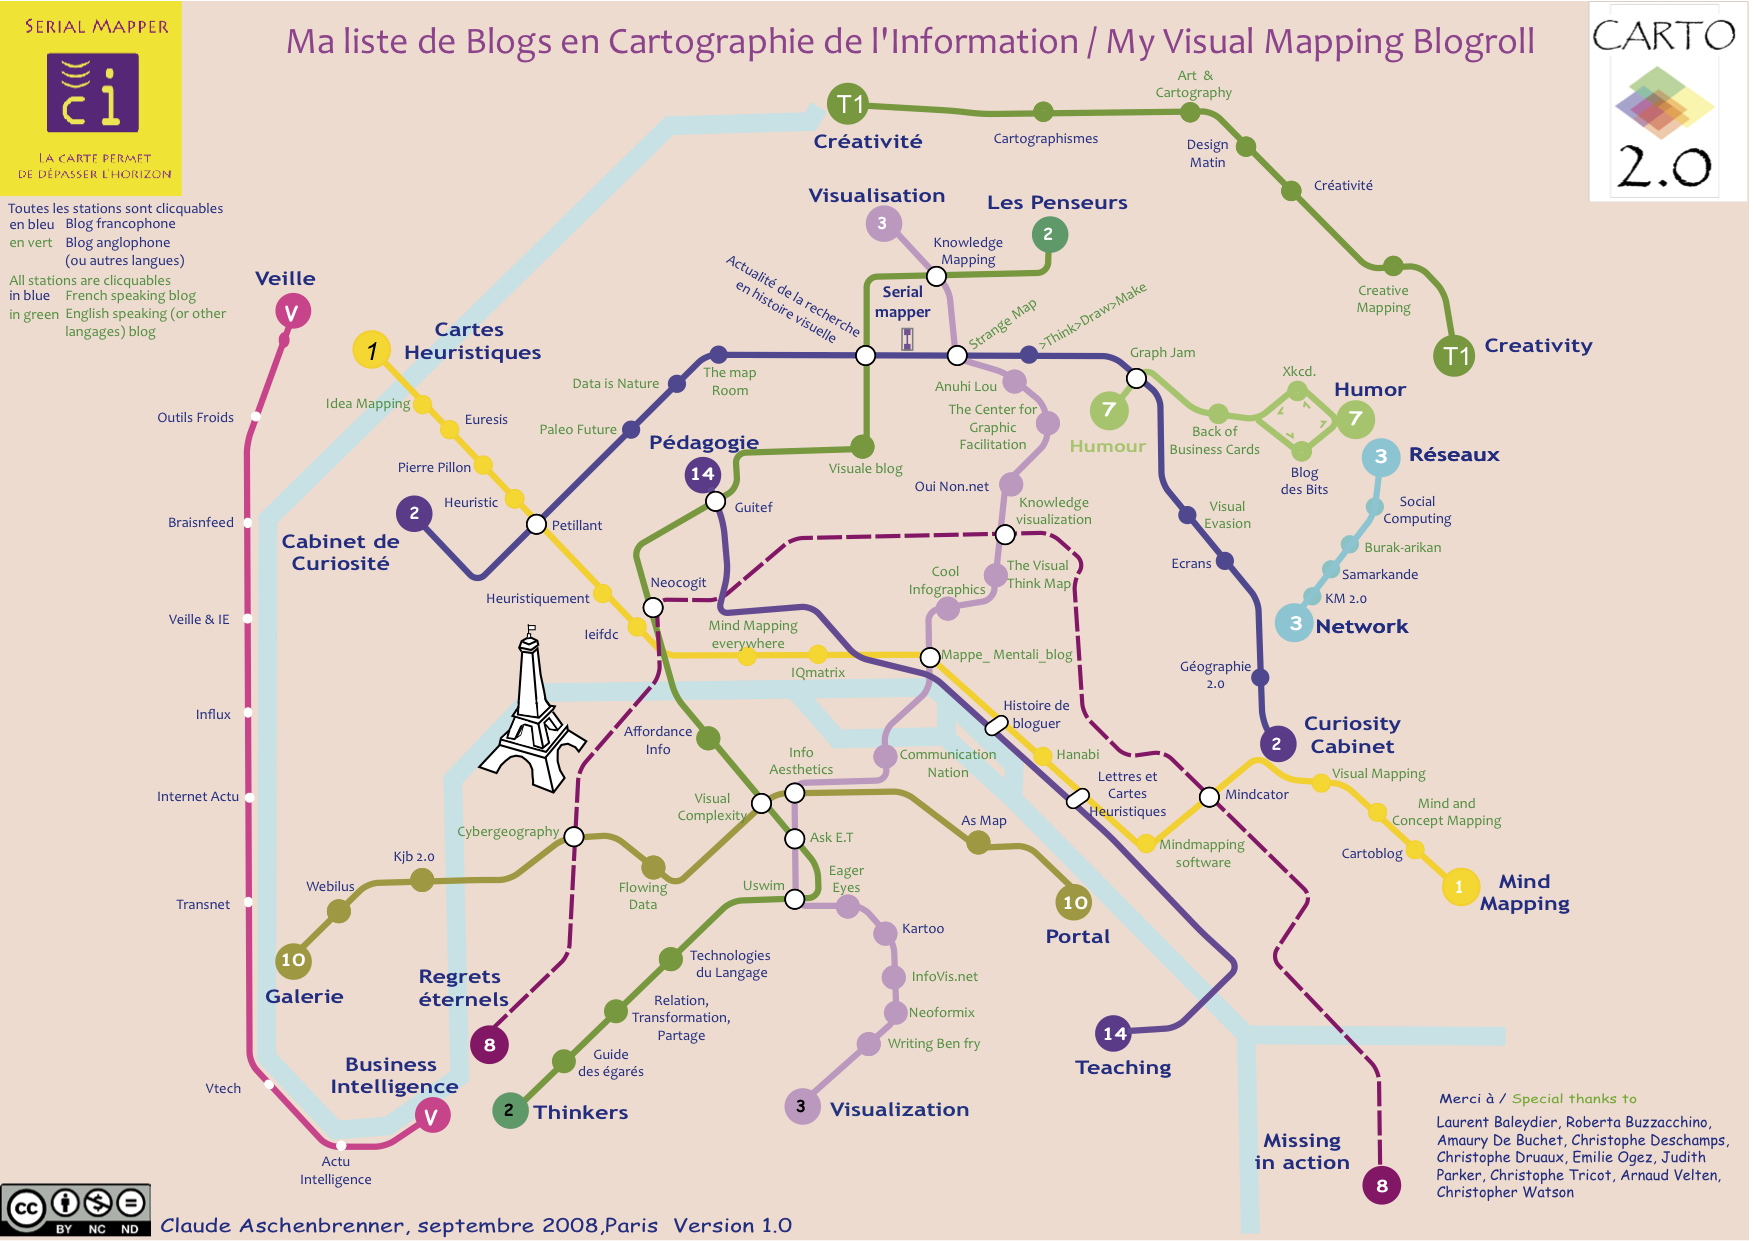
The Visual Mapping Blogroll!  I only recently came across this great use of the Subway Map infographic metaphor.  The map is a listing of website bookmarks grouped into categories for each line.  And the best part is that the overall theme is infographics and design websites, so the categories are things like Visualization, Mind Mapping, Humor, Creativity, Thinkers, etc.

Created by Claude Aschenbrenner (SerialMapper.com), the graphic is modeled onto the Paris subway system.  Because of that (and that Claude speaks French), each line is identified in French on the left end and English on the right end.  Websites that are in French are also noted in blue text.

He has two posts about the subway map and how it was created here and here.  There’s also an alternate version based on the website authors.

Great job Claude!  (and not just because Cool Infographics was included on the map…)  Can we expect to see an updated version anytime soon?

Thanks to the #smchat group on Twitter for the link!


EDIT: I forgot to add that each node is an active HTML link, so when viewing the map you are able to click on any site to be taken directly there.