About
Randy Krum
President of InfoNewt.
Data Visualization and Infographic Design

Infographic Design

Infographics Design | Presentations
Consulting | Data Visualizations

DFW DataViz Meetup

Join the DFW Data Visualization and Infographics Meetup Group if you're in the Dallas/Fort Worth area!

Search the Cool Infographics site

Custom Search

Subscriptions:


Feedburner

The Cool Infographics® Gallery:

How to add the
Cool Infographics button to your:

Cool Infographics iOS icon

- iPhone
- iPad
- iPod Touch


Read on Flipboard for iPad and iPhone

Featured in the Tech & Science category

Flipboard icon

Twitter Feed
From the Bookstore

Caffeine Poster

The Caffeine Poster infographic

Entries in software (55)

Wednesday
Oct222014

2014 Higher Education Technology Landscape

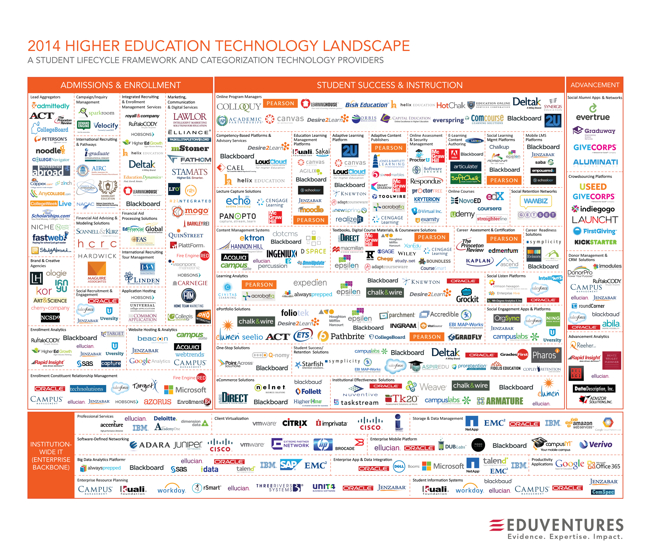
2014 Higher Education Technology Landscape infographic

The 2014 Higher Education Technology Landscape infographic from EDUVENTURES is the effort to make sense of the higher education technology landscape for the decision-makers who are tasked with determining new ways to provide better learning outcomes, building and maintaining a modern technology infrastructure, and rationalizing investment decisions.

Leaders in higher education face mounting pressure to deliver and account for better learning outcomes, embrace digital disruption, and replace aging and ineffective infrastructure with newer, cloud-based solutions. To take advantage of this opportunity, new and established vendors have flooded the education technology market, making it one of the most dynamic segments of the high-tech landscape.

It’s estimated that colleges and universities will spend between $20B and $25B this year on technology and services, enabling institutions to support faculty, and administration, as well as effectively market, recruit, enroll, instruct, engage, and prepare students and alums. The solutions span many categories, including enrollment management specialists, adaptive learning platforms, retention solutions, online program managers, social engagement networks, crowdsourcing applications, software-defined networks, big data platforms, and enterprise resource planning (ERP).  The market is vast, confusing, and ill-defined. We hear from our clients regularly that while they want to take advantage of these new tools and solutions, they are perplexed by the ever-growing number of categories and technology vendors, and struggle with how to best to evaluate them.

To meet this growing need among our clients, Eduventures has initiated a new research focus to provide on-going analysis of the technology market to support higher education decision-makers. Our goal is to make the market more understandable, evaluate the strengths and weaknesses of technology and service offerings, and help leaders make informed decisions when selecting and implementing solutions that meet their unique institutional and learner needs.

Eduventures has developed a taxonomy to make sense of this technology landscape as a foundation for on-going research and analysis on this dynamic market:

  • A student lifecycle framework for understanding the overall market and segments
  • An initial categorization of hundreds of vendors serving the market

We have identified over 50 categories and hundreds of providers that market and sell technology and services to post-secondary institutions, which demonstrates how daunting this market can be for higher education leaders. Even with this preliminary analysis, we recognize that there are additional categories and companies to that can be added—our intention is to respond dynamically as new companies emerge and to update this landscape as it continues to mature, converge and evolve.

Complexity is the key message of this design. A lot of work went into identifying and categorizing all of these different services, but the message is clear that it’s a difficult job to setup the technology services any higher educational institution needs.

Any infographic design is going to be shared on it’s own, without the accompanying article, so designers should always include the URL address back to the original in the infographic image. Most people that share infographics don’t include the link back to the infographic landing page, and including that as text in the image file will help your readers find their way back to the full-size, original version you posted.

Thanks to Heather for posting on Linkedin

Friday
Oct102014

5 Great Online Tools for Creating Infographics

Professional infographic designers rely primarily on a core vector graphics software program to create their infographics designs. The main advantage is that all the icons, charts, images, illustrations, and data visualizations are treated as separate objects that can be easily moved, resized, overlapped, and rotated. No matter where you create the individual design elements, the final infographic design is usually put together in a vector graphics program.

Creating infographics using online tools has never been easier. In the last few years a number of online tools have emerged that allow anyone to create great visual content.  Whether you are working on a project for work, personal use, or social media, each new project starts with a template. With the dimensions laid out for you, you can focus your attention on quickly creating effective designs. Search, drag, and publish - it can be that simple.

These new tools are vector graphics applications that run in your browser as a replacement for using an expensive professional desktop application like Adobe Illustrator to put your infographic design together.  Each one offers different tools, image libraries, charts, fonts and templates as a starting point.  None of these have the full capabilities of a professional desktop application, but you probably don’t need that much power to create a simple infographic.

In this article, we take a quick look at 5 of the best online tools for creating infographics: Visme, Canva, Easel.ly, Piktochart, and Infogr.am. All of these tools are evolving quickly, and this is just a snapshot of their current capabilities.


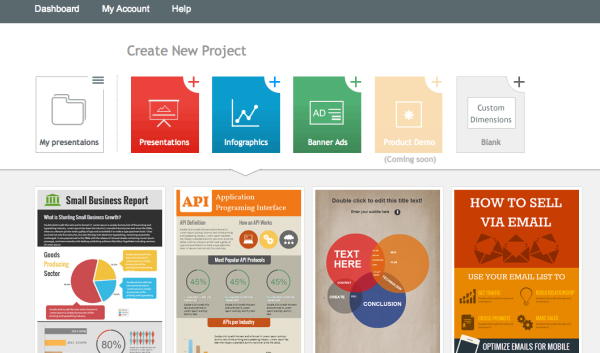
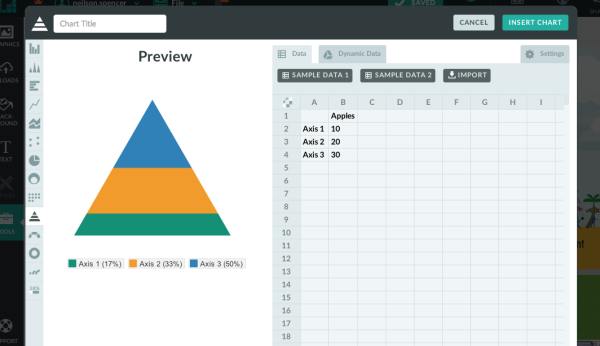
Visme screenshot

1) Visme (visme.co)

Visme allows you to create interactive presentations, infographics and other engaging content. With tons of templates, and huge library of free shapes & icons to choose from, Visme has you creating awesome visual content right away.

The templates are set up simply and beautifully. If you wanted, you could just edit the placeholder text, insert your own, and publish your infographic.

One of the greatest aspects of this service is changing percentages within the charts. All you have to do is click on the graphic you would like to change, enter a new number, and the chart changes to reflect the new information automatically. Saving you hours of frustration trying to do it on your own.

Pros:

  • Creates infographics, presentation, animations, ad banners, and custom layouts.

  • Insert and edit chart objects directly by changing the data values.

  • Large library of icons and images.

  • Embed YouTube videos directly into designs.

  • Special pricing for students & teachers.

Cons:

  • The basic free version is limited.

    • Only 3 projects.

    • Must include the Visme logo.

    • Limited access to charts and infograph widgets.

  • JPG download is still in Beta, with a few bugs.

Price: Basic version is free with pricing plans available


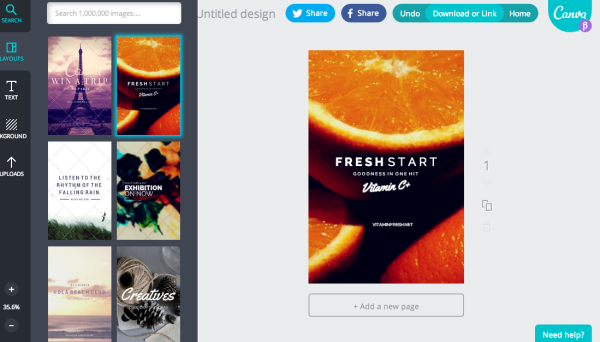
Canva screenshot

2) Canva (canva.com)

Canva just celebrated their 1-year anniversary last month, and has made a big splash in the online design space.  Your experience kicks off with a great "23 Second Guide to Beautiful Design," where they walk you through a brief introduction to their design program.

After finishing the brief tutorial, you can start a new design. Canva is filled with options, whether you are working on a project for work, personal, or social media. Each new project comes with a template for the project you choose to work on. With the dimensions done for you, you can focus your attention on creating beautiful designs in seconds.

Pros

  • Excellent (and short) intro tutorial to get you started, and many more on advanced concepts.

  • Templates for social media, blogs, presentations, posters, business cards, invitations, and more.

  • Easy and intuitive to use.

  • Large library of images to choose from.

Cons

  • No editable chart objects. You need to import your own data visualizations as images.

  • Have to pay for different image assets individually, instead of a monthly subscription.

Price: Free, but you have to pay for Pro quality design assets individually


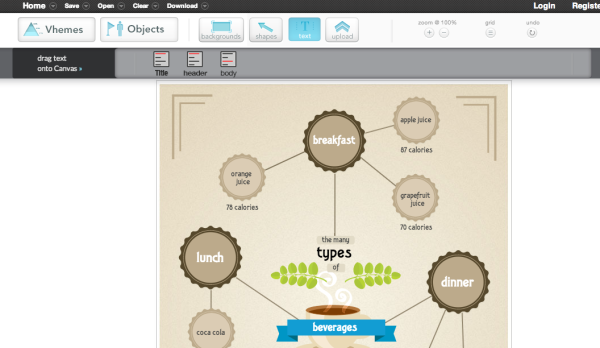
Easelly screenshot

3) Easel.ly (www.easel.ly)

Easel.ly is a great program, but lacks some of the guidance, and features, that come standard in other programs.

Easel.ly lacks a "How-To" introduction section to their program, and just kind of throws you into the design process right away. Their focus seems to be primarily based on infographic design. Whereas other programs offer a plethora of design project options.

If you're just looking to design an infographic, this program will work well. If you want more variety, you'll have to utilize one of the other programs in this list.

Pros:

  • Free.

  • Very basic design layouts and assets.

  • New charts feature allows some basic editable charts in your design.

  • Easy downloads for JPG and PDF versions.

Cons:

  • Not a very large selection of themes, called “Vhemes”.

  • Small library of image assets. You’ll want to upload your own images and icons.

Price: Free


Piktochart screenshot

4) Piktochart (piktochart.com)

Piktochart is one of the best looking programs on this list. All the information you need to get started is provided in their tour.

Their program is easy to use, and offers tons of freedom in building and editing your infographic using their simple graphic tools. They have categorized icons, resizable canvas, design-driven charts, and interactive maps to utilize.  

Their intuitive user interface is where Piktochart truly excels. All the tools you need to create are laid out intelligently, making your new job as a "designer" so much easier.

One of the coolest aspects of this program is that they show how versatile infographics are for different projects. Whether you're creating for a classroom, office, website, or social media setting - Piktochart gives you the heads up on how to use infographics effectively.

Pros:

  • Themes and templates are of high design quality.

  • Intuitive. Allows you to edit anything and everything with ease.

  • Create infographics, reports, banners and presentations.

  • Embed videos from Youtube and Vimeo in your design.

Cons:

  • Limited selection of free templates. Higher quality templates are available with a Pro account.

  • $29 per month is a high subscription price compared to the others.

Price: Start for free with pricing packages available


Infogram screenshot

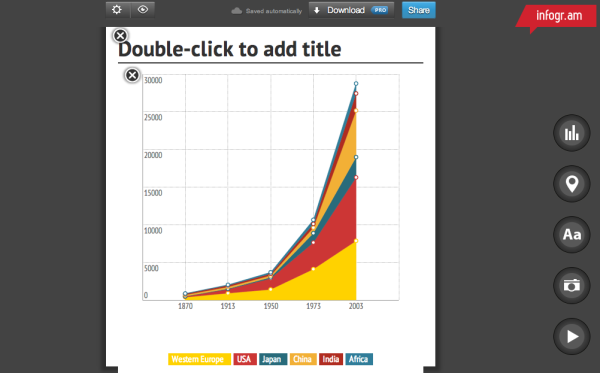
5) Infogr.am (infogr.am)

Infogr.am has got the best charts. For illustrating data, there are more than 30 different types of charts to choose from. Anything from bubble charts and tree maps to simple pie charts.

Editing data can be easily done in Infogr.am's built-in spreadsheet, or you can import your own XLS, XLXS and CSV files.  Once your infographic has been edited and beautifully designed, you can save it to your computer as a PNG or PDF file with a paid subscription.

Pros:

  • Ability to create and edit great charts by changing data

  • Built-in Spreadsheet. Can also import your XLS, XLXS and CSV files

  • Widest variety of available chart types

  • Educational and Non-profit pricing plans available

  • Embed videos from Youtube and Vimeo in your design.

Cons:

  • Only creates infographics and charts

  • Small selection of infographic templates

  • No image library, you must upload your own image assets

  • Download options require paid subscription

  • The White Label subscription service is the most expensive options of the group

Price: Basic version is free with pricing plans available


Which design sites have you tried? Which tools are your favorites? Post in the comments.

Wednesday
Apr022014

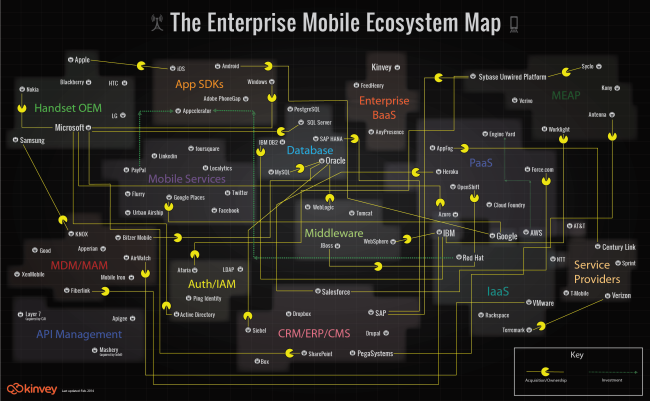
The Enterprise Mobility Ecosystem Map

The Enterprise Mobility Ecosystem Map infographic

The Enterprise Mobility Ecosystem Map published by Kinvey attempts to make sense of the ownership and acquisitions rapidly taking place within the mobile backend providers.  Platforms for authorization, payments, location services and software development kits (SDKs).

Enterprise mobility is a classic IT disruptor. It’s the kind of disruptor that companies like IBM, Oracle and VMware, SAP, Salesforce, etc. were built on. It may look like a peripheral part of IT infrastructure now, but since mobile will be the primary access point to apps and data for many enterprises, many — if not most — new apps are going to be “mobile first.” Thus, the entire IT infrastructure is going to have to become very mobile friendly, very quickly, or else risk becoming a legacy platform.

As a consequence, major IT vendors are partnering with or acquiring companies throughout the mobile stack. Market consolidation and investments have taken place in MDM, API Management, cloud and handset markets. To visualize this activity, we’ve produced the Enterprise Mobile Ecosystem map below.

A network map visualization like this can help companies figure out where their business plays, and how other company acquisitions around them may impact their business.  I like that the design is purely informational, and doesn’t add a lot of extra data or information to the design.  The message is all about the connections, and doesn’t include things like the size of the companies or the value of the acquisitions.  This keeps the infographic focused on telling one story really well.

I would recommend using the company logos in the subway map style design to make it faster and easier for the audience to recognize the companies involved.  It’s much harder for the readers to read all of the company names in text to find the companies they recognize.

The Pac-man icons are a nice touch to indicate the direction of ownership or acquisition.

Monday
Jul012013

How Apple Are You?

How Apple Are You? infographic

Do you think you’re Apple’s number one fan? Take the test on the How Apple Are You? infographic from mackeeper.com to see how you match up! Fancy a new tattoo soon? How about an Apple?

You think you know everything about Apple? Would you call yourself an Apple Fan? How about checking the level of Apple in your blood, would you be up for that? Check out our awesome info-graphics and find out how Apple you are! Make sure you share this with your buddies!

I’ll admit I scored a 155, so I’m a fairly hardcore Apple fan.

Where’s the URL to the original infographic landing page?!?

Thanks to Shelli for sending in the link!

Tuesday
May282013

Wireframe, Prototype and Simulator Tools

Wireframe, Prototype and Simulator Tools infographic

So what is the difference between Wireframe, Prototype, and Simulator Tools? This infographic compares how the products preform in terms of design capabilities, mobile integration, collaboration features, and interactivity. From User Testing, this infographic  helps guide you through the design making process of what program is right for you.

If you’re into building websites, mobile sites, or apps, you probably use some type of mockup tool—prior to coding—to help you envision how a site will work and look. But do you get customer feedback on them? In this ultimate guide, we’ll explore leading mockup tools — wireframing, prototyping, and simulating –and show you how to run user tests with them.

Good design that puts the icons and information directly into the visuals.

Also available as a PDF download.

Thanks to Liz for sending in the link

Thursday
Jan312013

The History of Microsoft Office

The History of Microsoft Office infographic

Word, PowerPoint and Excel are the Holy Trinity of work productivity. This is the package that makes up Microsoft Office. The History of Microsoft Office infographic from Best STL (microsofttraining.net) highlights the history of past Microsoft Office releases and a preview of the 2013 version just released.

With MS Office 2013 launching soon (see below), let’s go back in time  to look at the Microsoft Office story so far.  When launched in 1990 it was called “The Microsoft Office”.

Which version was your favourite? Do you prefer an old faithful?

The design is great.  Easy to read and not too much information.  I’ve used every version of Office they have shown in the timeline.

At first, I thought this might have been an official Microsoft design, but it’s really from Best STL, who is a Microsoft partner.  It looks so much like a Microsoft design, they may be pushing the Fair Use of Microsoft’s trademarks a little further than I would be comfortable with.

Thanks to David for sending in the link!

Wednesday
Dec262012

Top 20 Field Service Management Software Solutions

Top 20 Field Service Management Software infographic

The new Top 20 Field Service Management Software infographic from Capterra continues their series of “Top 20 Most Popular” infographics for different software categories.  I’ve previously posted about the Top 20 Marketing Automation Software Solutions and the Top 20 Medical Records Software Solutions.

This design shows a little more detail behind how they score and rank the different software options.

Field Service Management software serves companies that send technicians or other employees into the field by helping them automate scheduling and dispatching. Below is a look at the most popular options as measured by a combination of their total number of clients, active users and online presence. In order to see a comprehensive list, please visit our Field Service Management Software Directory.

Capterra developed a popularity index consisting of three components to rank the field service management providers: number of customers (40%), number of end users (40%), and online presence (20%). The online presence metrics included traffic estimates from Compete.com, as well as the company’s number of LinkedIn followers, Facebook page likes, Twitter followers, and Klout scores – each weighted equally to comprise 20% of the vendor’s overall score.

The stacked bars to showing the three separate score metrics works nicely, and is a clear visual of the descending total scores.  The Rank numbers are in colored boxes that match the primary brand colors of each software company, but the readers don’t know that.  Without seeing the actual company logos, the colors just look random and create some unnecessary visual noise.

By not showing the company logos throughout the design, it’s harder for the reader to see where a particular company appears in the different sections.  A visual logo would be easy to recognize at a glance, but in just text, the reader has to read every entry to try to find a match.

Nice, clear Call-To-Action at the end of the design, so the target audience readers know what they should with this information.  The footer should also include a copyright statement and the URL link to the infographic landing page on Capterra’s site so readers can find the original, full-size version.


Monday
Mar262012

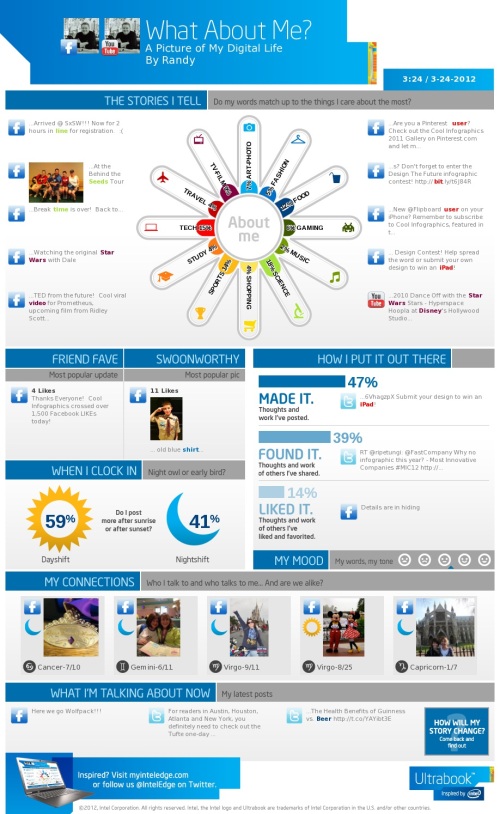
What About Me? - Intel's Infographic Generator


Intel has released What About Me?, an automatic infographic generator that connects to your own Twitter, Facebook and YouTube accounts to create a profile infographic about you.

Social media users know that discovery is half the fun. With What about Me? you can capture a snapshot of your social media life and create your own colorful image, full of clues and facts about one of the most fascinating subjects in the world — YOU!

In general, I’m not a fan of automatically generated infographics.  I find them repetitive, like PowerPoint templates, and that makes everyone’s information look the same.  This one at least incorporates a few photos of your own to give a little personal touch, but not much.

From a design perspective, the “About Me” section is the big central visual element.  I like the color spectrum and the simple icons used for the dominant categories.  It may be just my own data, but all of the percentages are small and fairly close to each other, so visually you don’t see much difference at all.  Am I really that well balanced???

In the “How I put it out there” section, the bars are all portions of the total 100%, so a pie chart or a stacked bar would have been a better chart style to use in the design.  Again, in the “When I clock in” section, these two values are portions of the total 100%, so some type of visualization that shows that would have been helpful to the reader.

I really like the simplicity of the “My Mood” section, and I think they actually made it too small in this design.  As a completely visual element it could reall be much larger and more prominent.  I would really like to have some type of editing capability, like choosing which images are included.

I think they setup the sharing function poorly.  You can save a JPG file of your own design (like mine above) to your own computer.  If you share on Facebook or Twitter it will post the infographic as a photo in your account, but the link it generates will just take someone else back to the front page to design their own.  That’s confusing because the link should be sharing your own design with others, so they would have the option to like or share your design.

If you create your own design, share post the link to your image in the comments!

Found on Mashable

Monday
Jan302012

Client Infographic: Top 20 Medical Records Software Solutions

A new infographic design from InfoNewt for CapterraTop 20 Most Popular EMR (Electronic Medical Records) Software Solutions shows the results of comparing Capterra’s Popularity calculations in the EMR software category.

As the deadline for implementation in the U.S. draws near, talk of electronic medical records (EMR) and electronic health records (EHR) software is a hot topic at the doctor’s office lately. These systems assist medical practitioners in the creation, storage, and organization of electronic medical records, including patient charts, electronic prescriptions, lab orders, and evaluations (just to name a few common features). While the terms “EMR” and “EHR” are often used interchangeably, EMR solutions allow for patient information to be shared within one health care organization, whereas EHR solutions allow for health-related records to be shared across multiple organizations. Below is a look at some of the most popular options in both categories, but to see a comprehensive list, visit our EMR Software Directory. You can also click on any of the company logos in the graphic to go directly to their websites.

Capterra’s listing current shows 324 EMR software solutions, and for their target audience this is a very hot topic with an upcoming Federal requirement in the U.S. to make all medical records electronic by 2014.  This is a HUGE issue to convert millions of patient records over the next few years, and practitioners obviously only want to do this once, so picking the right platform up front is critical!

Similar to the Top 20 Marketing Automation Software design, this design features a large pie chart as the primary visualization, and then provides additional information.  The main data is Capterra’s Popularity calculations which combine total users, customers, revenue, social media followers and website rankings.  Again, the specific percantage values weren’t as important as the ranking and visually showing how the packages compare.

This software category has the added complication that the different software packages are written for different sizes of medical organizations.  Single medical practitioners don’t need the same software (or have the same budgets) as hospitals.  We also added the element of showing which hardware platforms each package is design to use.  Microsoft Windows hardware is clearly dominant, but Apple hardware and Cloud-based solutions made up 30% of searches in this category.

Capterra is the authority when it comes to finding software solutions for businesses, and they’ve done some great work gathering data and measuring the relative popularity of different software categories.  Although popularity doesn’t necessarily mean the software is right for your business, it is a really good indicator that the solution is working successfully for many businesses and may be worth a closer look.  A better indicator than just total revenue or trying to rate “the best.”  You can read their comprehensive blog post about the data behind the infographic.

Thanks to the team at Capterra for being great to work with!

Tuesday
Jan172012

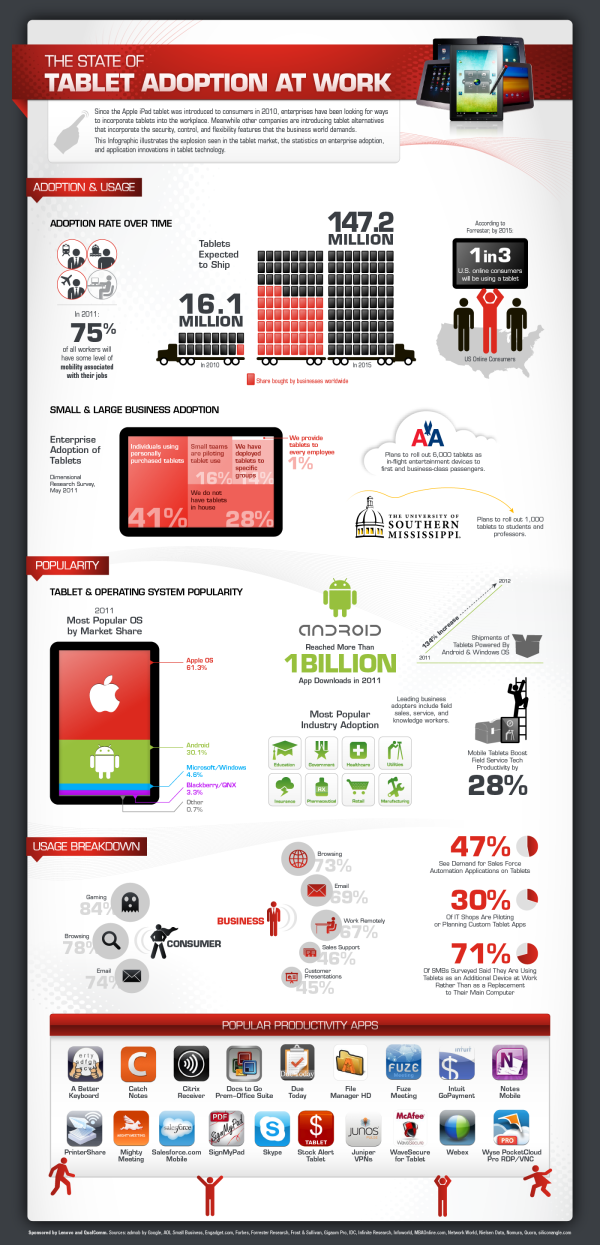
Tablet Adoption at Work

The State of Tablet Adoption at Work is a new infographic from VentureBeat.com.  It’s interesting that the infographic itself was sponsored by Lenovo and Qualcomm, but included as part of a VentureBeat article.  You can find the original version here at TabletsAtWork.com

Since the debut of Apple’s iPad in Jan. 2010, the integration of tablet devices into our lives and work has progressed rapidly — so fast that it’s sometimes hard to put in perspective how quickly got here.  The exclusively obtained infographic below breaks down how far workforce adoption of tablet technology has come — and where it’s headed. (The graphic was sponsored by Lenovo and Qualcomm.)

I love the clean, professional design look.  I really like the color scheme and the mixed bag of visualization styles; grid of icons, treemap, stacked bar, line chart, etc.

Only a couple of design issues about this one I would improve.

  • I’m willing to let 16 tablet icons represent 16.1 Million tablets shipped in 2010 (rounding), but why only 144 tablets shown to represent 147.2 Million?  That was just the designer wanting a clean, square visual that breaks the actual data visualization.
  • The line chart showing 134% increase in shipments powered by Android and Windows is way out of scale.  It’s visualizing something close to a 900% increase.
  • At the bottom there should be a copyright statement and the URL to the original infographic landing page so people can find the full high-resolution version.

Found on the Inside Flipboard feed in Flipboard for iPad.