About
Randy Krum
President of InfoNewt.
Data Visualization and Infographic Design

Infographic Design

Infographics Design | Presentations
Consulting | Data Visualizations

DFW DataViz Meetup

Join the DFW Data Visualization and Infographics Meetup Group if you're in the Dallas/Fort Worth area!

Search the Cool Infographics site

Custom Search

Subscriptions:


Feedburner

The Cool Infographics® Gallery:

How to add the
Cool Infographics button to your:

Cool Infographics iOS icon

- iPhone
- iPad
- iPod Touch


Read on Flipboard for iPad and iPhone

Featured in the Tech & Science category

Flipboard icon

Twitter Feed
From the Bookstore

Caffeine Poster

The Caffeine Poster infographic

Entries in Giveaway (18)

Friday
Aug102018

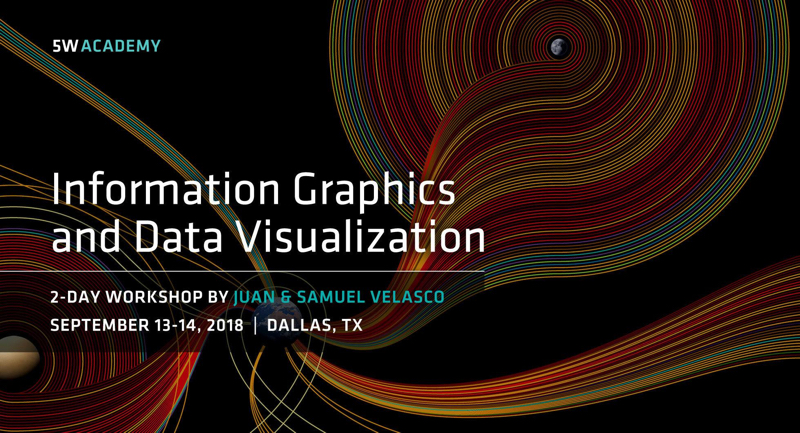
Giveaway: 5W Information Graphics & Data Visualization Workshop Dallas

This month (August 2018) I'm giving away ONE FREE ticket to attend the 5W Information Graphics and Data Visualization 2-day workshop in Dallas, TX on September 13-14, 2018.

Register on the Giveaways Page by August 31, 2018 to be entered, and the winner will be chosen on September 1st!

Juan and Samuel Velasco currently have workshops scheduled in four cities across the U.S., so I'm jumping on the chance to attend and help promote the workshop in Dallas. I highly recommend you check out the schedule and attend one if they are close to you.

Thursday
Jun142018

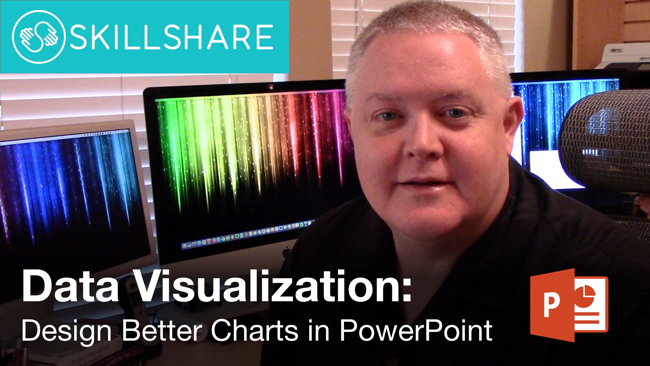
Giveaway: Design Better Charts in PowerPoint

The giveaway for June is ONE FREE PASS to my complete class on Skillshare, 44 minutes for all 10 lessons! Students with a Free Access Link can watch the complete class for free without a Skillshare Premium Membership.

Register on the Giveaways Page by June 30, 2018 to be entered.

Skillshare is an online subscription learning community with thousands of classes on everything from business to graphic design to fashion – it’s the Netflix of learning. You can use THIS LINK to see my class and sign up and get two free months! That's plenty of time to take my class and try out a few others. Once you're a member, you have access to all of classes that Skillshare offers, and there are thousands of them.

If you're already a Skillshare member, then you already have access! Please check out my class, and share with your network of friends and co-workers. Follow me on Skillshare to catch any future class I post as well!

Here's a quick time lapse of the sample file I use for demonstration in the class. This will give you an idea of how the data visualization design principles are applied to a bar chart in PowerPoint:

Wednesday
Nov292017

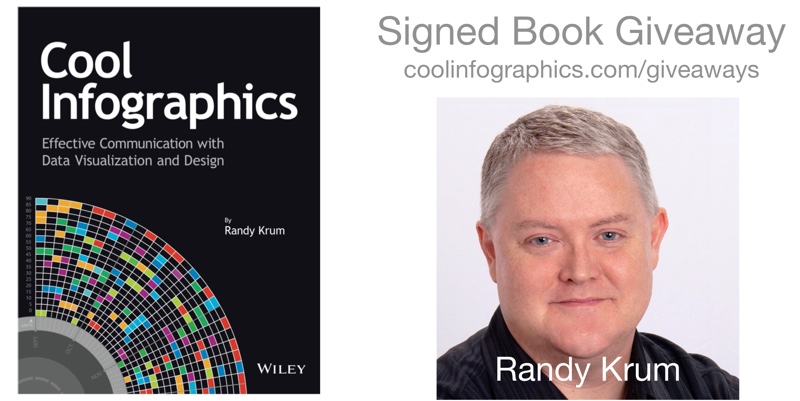
Cool Infographics Book Giveaway December 2017

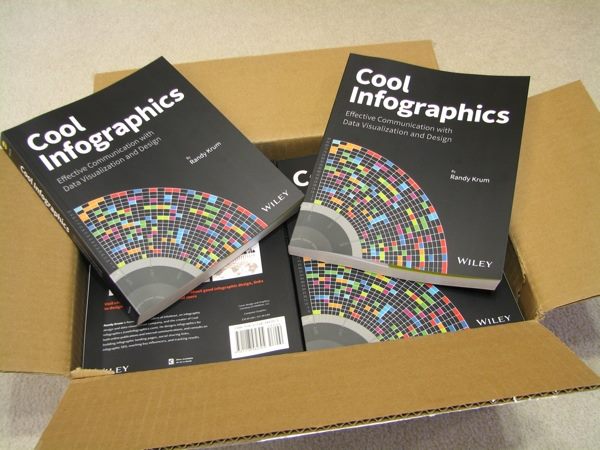
During December 2017, I am giving away one signed copy of my book Cool Infographics

Register on the Giveaways Page by December 15, 2017 to be entered.

I posted this on the Giveaways page in November but forgot to mention it here, so I'm extending the registration deadline until December 15th.

You can always download a free chapter from the Book page to get a sample from the 1st chapter, The Science of Infographics.

A cool infographic tells a story visually —an engaging story built with your data. More than just using pictures or colorful charts, infographics create the type of visual information that your audience will quickly grasp and remember.  Inside, the fundamentals of infographics are clearly explained for both novices and experienced professionals.

Thursday
Jul132017

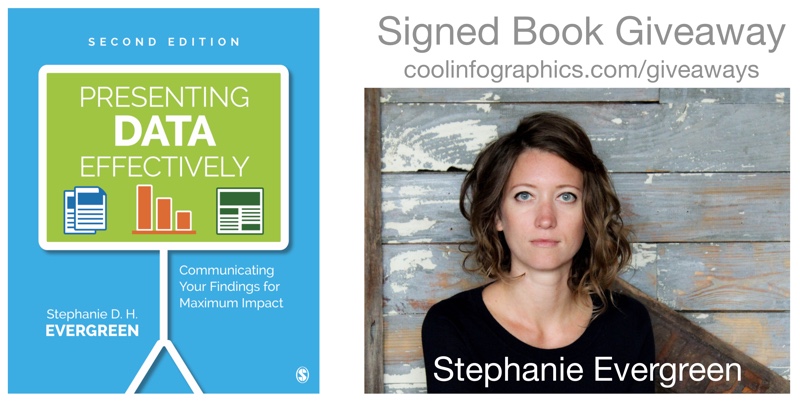
Presenting Data Effectively by Stephanie Evergreen!

Presenting Data Effectively Stephanie Evergreen 2nd Edition Interview and Giveaway

The updated 2nd Edition of Presenting Data Effectively by Dr. Stephanie Evergreen was just released! This is a fabulous resource, and the new edition includes full color images and screenshots as well as new content!

During JULY 2017, I am giving away one signed copy of Presenting Data Effectively! Register on the Giveaways Page by July 31st to be entered.

Now in striking full color, Presenting Data Effectively, Second Edition by Stephanie D. H. Evergreen shows readers how to make the research results presented in reports, slideshows, dashboards, posters, and data visualizations more interesting, engaging, and impactful. The book guides students, researchers, evaluators, and non-profit workers—anyone reporting data to an outside audience—through design choices in four primary areas: graphics, text, color, and arrangement. The Second Edition features an improved layout with larger screenshots, a review of the recent literature on data visualization, and input from a panel of graphic design experts.

Stephanie was very helpful and answered a bunch of questions I sent her about visualizing data and the updated book:

Who is the book intended for?

Stephanie Evergreen: Anyone who has to convey some information to other people should read this book, whether it is in a report, a slideshow, a dashboard, etc.


It’s been 4 years since the 1st edition. What has changed the most?

Stephanie Evergreen: Color! We are finally catching up with the modern world and printing in full color. And speaking of catching up, I’ve included a lot of new content about how we have to change how we report to adapt to a mobile reading culture.


What does it mean to present data effectively?

Stephanie Evergreen: At the very core, that means people understand what we are trying to say. Which means we will have to adjust how we talk about our work so it aligns with how humans come to understand things. So with a little bit of the research behind how brains work, we end up with many significant implications for how we report.


What makes presenting data effectively so challenging?

Stephanie Evergreen: The hardest part is uprooting the ways we have been taught to present, usually from academia. You know what I mean. Lots of bullet points. Dense slides. Too much detail. We think we have to come off this way because it will show we are studious, thorough, and very smart. But reality is that it will only confuse our audiences. And if we are confusing our audiences, we aren’t doing our job. It actually takes in-depth knowledge about a topic to be able to convey it to others with clarity.


What should readers expect to learn and apply to their own presentations?

Stephanie Evergreen: Readers will learn extremely practical guidelines to apply AND the buttons to push to make it happen, right inside the software we all already own.


Is there an ideal balance of text and visuals on a presentation slide?

Stephanie Evergreen: Slides are intended to be a visual support for our talk. So the ideal balance is enough text to frame your key point and a visual that provides the evidence or context for that key point.


How do you help people that are told to only use the company’s colors, fonts and presentation templates?

Stephanie Evergreen: Use them very well. And look for the places where the style guide *doesn’t* dictate your choices – such a font size – and do your magic in those gaps.


What are your thoughts on animated slide transitions and/or clicking to reveal different pieces of information on a slide.

Stephanie Evergreen: Please no transitions. The last thing you want is people thinking “oooh look at how her slide swept away like an ocean tide” because while they are thinking that, they’ve missed everything you were saying. Animating is a different story. Animation can be helpful to break down complex stuff and make it easier to digest. Just don’t be obnoxious (Swivel In, I’m talking about you).


How difficult is it to choose the right chart style?

Stephanie Evergreen: We have a lot of choices, so it can be difficult to even know where to begin. But if you start with your point – the thing you are actually trying to say with this data – you’re headed in the right direction. And coming up with your point, as in really doing the thinking and the analysis, is the hard part.


Is complexity the enemy of good data visualization design?

Stephanie Evergreen: Heck no! Clutter is the enemy of good data visualization design. Complex stuff can be clear and easy if we strip out all the junk.


How do you make it look so easy?

Stephanie Evergreen: I’m funny.


Is there a website to go along with the book?

Stephanie Evergreen: My website rocks. http://stephanieevergreen.com/ My blog is full of tons of resources and I put out new posts every other week that show you exactly how to do what I do. Books are awesome but they take 6 months to print and in that time, I’ve already had a dozen new ideas and the blog is where you’ll find them.


Are you speaking at any upcoming presentations or webinars?

Stephanie Evergreen: I’m on the road, criss-crossing the globe, working with truly awesome folks, giving keynotes and workshops about 35% of my life (typing on a plane right now). Check out my events here: http://stephanieevergreen.com/upcoming-events/ and come say hi or bring me in yourself.


Where’s the best place to follow you online?

Stephanie Evergreen: Dataviz nerds hang out on Twitter, so catch me there https://twitter.com/evergreendata . You can also follow my travel adventures on Instagram at: https://www.instagram.com/severgreen/

Friday
Jun232017

The Big Book of Dashboards!

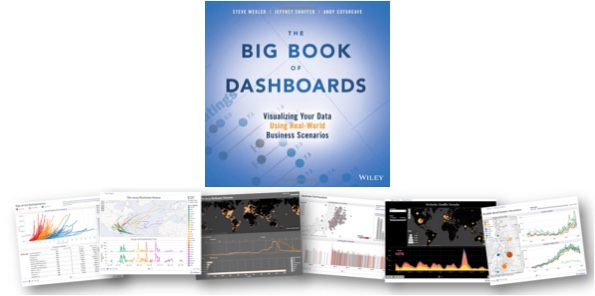
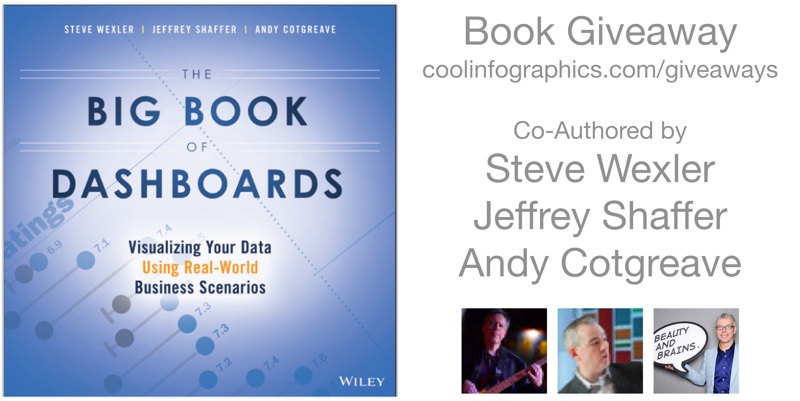
The Big Book of Dashboards is a fantastic new book release in 2017 co-authored by Steve Wexler, Jeffrey Shaffer, and Andy Cotgreave. Published by Wiley, the book is available in print and ebook. You can check it out here on Amazon!

The book starts with good data visualization design practices and then dives into 28 case studies of real dashboard designs in practice. The case studies are design tool agnostic, covering good dashboard designs from a variety of design tools. It doesn't matter what software you use, you will find inspiration and great examples in this book!

I met the co-authors at this year's Tapestry Conference, and interviewed them about the book below.

This month (June 2017) I'm giving away one copy to a lucky winner!  Register on the Giveaways Page by June 30th to be entered.


Who is the book intended for?

Steve Wexler: Anyone tasked with building or overseeing the development of business dashboards.


The three of you are in distant locations from each other. What was your process to collaborate on writing the book?

Steve Wexler: It wasn’t just the three of us!  While we were the authors, the book has 17 contributors and we would have web-sharing sessions with all of them so we could understand the rationale behind the dashboards.  There were also many cases where we would ask them to either defend their decisions or make some refinements.

In any case, we web-conferenced and relied very heavily on Slack to handle asynchronous collaboration.  The slack channels are massive (you should see all the discussions on the definition of the dashboard).

Andy Cotgreave: We also used Join Me for teleconferencing and Dropbox for file sharing. Looking back, it’s incredible how technology facilitates close collaboration across the world. 


How do you define what is a dashboard?

Steve Wexler: A dashboard is a visual display of data used to monitor conditions and / or facilitate understanding. Yes, it’s a broad definition.

Jeff Shaffer: There were long discussions on this one. We really considered Stephen Few’s definition, but picked apart terms like “single screen” and “monitored at a glance”. For example, does printing a dashboard and taking it into a meeting disqualify it from being called a “dashboard”? We think it’s still a dashboard and while it may not be used to monitor something in that instance, it does facilitate understanding. Another example is a “dashboard” that is presented on a tablet or phone where scrolling off a single screen is necessary. Technology, and screen size, is constantly changing, so while our definition is broad, I find it more accurate.


Why should dashboards be elegant or visually appealing?

Steve Wexler: I guess for the same reason that your want a computer, phone, appliance, etc., to be elegant or visually appealing.  For certain, the dashboard must first be functional (i.e., inform, enlighten, and engage) but the “engage” part is more likely if the experience with the dashboard is pleasant.

Andy Cotgreave: You need people to engage with a dashboard. Don Norman defines success according to three levels of processing: Visceral, Behavioural and Reflective. Each needs to succeed. The first response is Visceral - it’s an instant emotional reaction to whether you like something. It takes little effort to ensure the colours, fonts, layout of a dashboard is appealing, but it’s vital to get that visceral response right. The “functional” part comes next, in the behavioural level.


Do dashboards have a size limit? How large can they go?

Steve Wexler: They should be bigger than a bread box and smaller than the Empire State Building. Goodness, it depends on so many things -- the audience, the platform (desktop vs. tablet vs. mobile) and so on.

Looking at the 28 scenarios in the book, with the exception of the Financial Times Economy at a Glance dashboard, none of the desktop-based dashboard have any scrolling (many of the mobile-dashboard do provide for scrolling).  

As for the number of distinct charts on a dashboard the examples run from as few as one to around a dozen.

Interestingly, two of the examples that have a dozen or so charts are from Dundas, but because they are elegant and visually appealing you don’t feel overwhelmed by them.

Andy Cotgreave: Traditionally I’d have said they should fit on a single screen. But as mobile takes over, I think that is changing. The Financial Time Economies at a Glance dashboard is very very tall and designed for scrolling. It works extremely well on mobile. A starting rule of thumb would be to try to keep everything on one page.


How do you address the challenge of choosing the right type of chart for a given data set?

Steve Wexler: That is the raison d'être for the book! Given a particular predicament / scenario, and given the data you have, what is the chart or combination of charts that shine the most, brightest light on the subject?  That’s what we’re trying to do.

And very often that chart or combination of charts may not be what you expect.  Andy wrote a terrific chapter on visualizing time and shows there are so many cases where you don’t want to use a line chart.

Jeff Shaffer: It all starts what you are trying to show with the data. Presenting time is a great example. We have an entire chapter devoted to the different ways to show time, i.e. data over time. Typically a line chart would be a great way to show trend over time, but there are many other ways to visualize time.


What are the key mistakes people make in their dashboards?

Steve Wexler: Too much clutter and not enough clarity.  Plus we’ll often see people putting too much emphasis on decoration and not enough on information.

Jeff Shaffer: The misuse of color. People using color incorrectly or in an overwhelming way. We talk in depth about this in the opening chapter and throughout the book in many of the examples.


What advice would you give young professionals just getting started with visualizing data?

Steve Wexler: Seek feedback when building dashboards.  You need to meet with your audience, often, to make sure what you’re building actually helps the intended audience. 


What’s available for readers on the bigbookofdashboards.com site?

Steve Wexler: There are links to articles, podcasts, and workshops.  We’re also posted downloadable versions of many of the dashboards featured on the book.


Where can people follow all of you online?

Jeff Shaffer -- @highvizability, www.dataplusscience.com
Andy Cotgreave -- @acotgreave, gravyanecdote.com
Steve Wexler, @vizbizwiz, www.datarevelations.com


Are there any events coming up related to the book?

 Steve and Jeff are offering a workshop in Atlanta on June 14  and will be offering more workshops throughout the year (See http://bigbookofdashboards.com/workshops.html)

Andy, Jeff, and Steve will be offering a free webinar on how to build world-class business dashboards on June 21.  (See https://www.tableau.com/learn/webinars/big-book-of-dashboards)

We will all be at the Tableau Conference in Las Vegas, presenting sessions, and signing books!


Monday
Apr032017

The Data Visualization Toolkit signed book giveaway

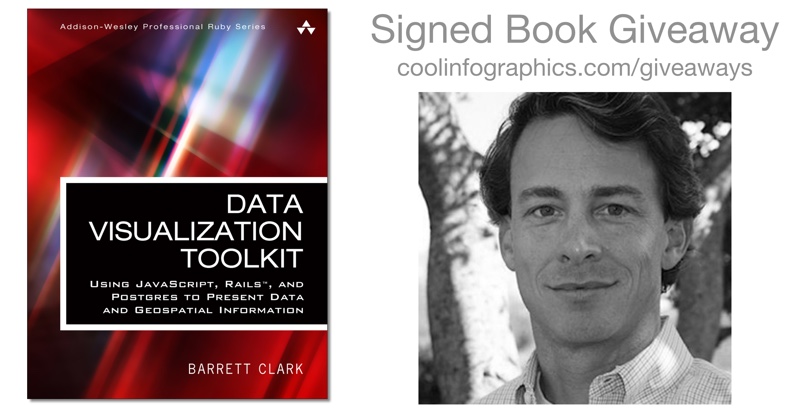
For the April Giveaway, I have a signed copy of the Data Visualization Toolkit by Barrett Clark.  Register on the Giveaways Page by April 30th to be entered. 

From Amazon:
Data Visualization Toolkit is your hands-on, practical, and holistic guide to the art of visualizing data. You’ll learn how to use Rails, jQuery, D3, Leaflet, PostgreSQL, and PostGIS together, creating beautiful visualizations and maps that give your data a voice and to make it “dance.”
 
Barrett Clark teaches through real-world problems and examples developed specifically to illuminate every technique you need to generate stunningly effective visualizations. You’ll move from the absolute basics toward deep dives, mastering diverse visualizations and discovering when to use each. Along the way, you’ll build three start-to-finish visualization applications, using actual real estate, weather, and travel datasets.
 
Clark addresses every component of data visualization: your data, database, application server, visualization libraries, and more. He explains data transformations; presents expert techniques in JavaScript, Ruby, and SQL; and illuminates key concepts associated with both descriptive statistics and geospatial data. Throughout, everything is aimed at one goal: to help you cut through the clutter and let your data tell all it can.

Barrett recently gave a talk called "Making Data Dance" at the DFW DataViz Meetup event, and I had a chance to ask him a few quesitons:

What does it mean to make your data "Dance”?

Barrett Clark: I think data wants to tell a story. Our job is to figure out what that story is and how to best present it. Seeing the data in a visual way can make it come to life and dance.


Who is the book written for?

Barrett Clark: Data Visualization Toolkit focuses on looking at data from the perspective of a web developer. More specifically, I speak from the perspective of a developer writing Ruby on Rails apps. There is a fair amount of JavaScript and SQL throughout the book, and I try to explain what I am doing throughout the text. My goal was to make a book that is accessible to anyone while still giving more experienced developers something valuable.


Can readers get all of the data and code you reference in the book?

Barrett Clark: Absolutely! There are 3 different applications that readers will build throughout the book. The code and data for the applications are available on GitHub at http://DataVisualizationToolkit.com. I also have checkpoints throughout the text where you can see what the application should look like at that point. Those are enumerated in the README for each application.


Why do you prefer PostgreSQL as your database platform of choice?

Barrett Clark: I have worked with several databases. PostgreSQL, or Postgres as it is often called, is by far my favorite. It is a robust database that is easy to use, has a wide array of functions and data types, and is also extendable. You can easily add to the functionality of a Postgres database with an extension. In fact, the core database ships with dozens of extensions that you don't need to install. PostGIS, which allows you to store geospatial data and perform geospatial queries, is one of my favorite extensions.


Why is the database and transforming your data before your create the visualizations so important?

Barrett Clark: I have seen very few data sets where you can take data directly from the database into a chart -- especially with transactional data. You can perform the data transformations in the database using SQL, in the application server using the application's prorgamming language, or in the browser using JavaScript. Databases are really good at dealing with data, so I encourage people to not be afraid to write SQL to pull out the data in the format that you need it.


What are the challenges for visualizing data on websites?

Barrett Clark: Speed. When you have a lot of data you need to be thoughtful about how quickly you can get the data and display it in a meaningful way. This may require some additional setup to store data for reporting in a separate format so that you don't have to do the transformations in real time. Another challenge is that you have no control over the end user's viewing experience. Something that you think looks brilliant on your laptop may look awful on someone else's screen.


What’s different about visualizing geospatial data?

Barrett Clark: Geospatial data is a lot of fun! When you add location to the mix you open up a whole new arena of things that you can do visually with your data, and questions that you can ask of the data. I love maps. I take readers through the creation of one of my favorite types of map -- the choropleth. That's where you color areas (counties, states, etc) in a map based on the data.


Are your visualizations mostly static or interactive data visualizations?

Barrett Clark: There are some mouseover effects in my visualizations that help add more context to the graph or highlight something.


What are your thoughts on D3.js and its future?

Barrett Clark: I love D3, and I also love what Mike Bostock has done to build such a deep assortment of examples. Between the examples and the documentation I find D3 really fun to work with. The library is also very actively maintained. As soon as I shipped Data Visualization Toolkit a new version of D3 dropped. There are branches in all 3 sample project repositories on GitHub with the updates required for D3v4.


Are you speaking at any upcoming presentations or webinars?

Barrett Clark: In the past few months I've spoken at PGConf Silicon Valley in San Francisco and RubyConf Australia in Melbourne. I'll be taking a break from travel for a bit and focusing on local meetups. I try to get out to the Dallas Ruby meetups whenever possible.


What’s the best place to follow you online?

Barrett Clark: I'm @barrettclark on Twitter.

Wednesday
Mar292017

Visualising The Beatles Signed Book Giveaway

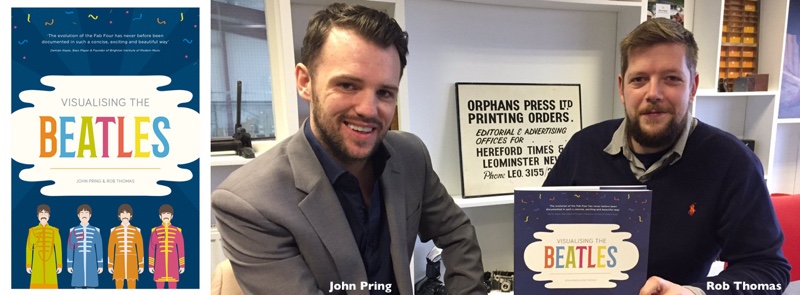
Don't miss your chance to register for the Giveaway in March! I have one SIGNED COPY of the new infographics book Visualising The Beatles by John Pring and Rob Thomas!

Register below by 11:59pm CT on March 31, 2017 to be entered. A winner will be randomly selected on April 1st.

This is the story of the Beatles told as never before.

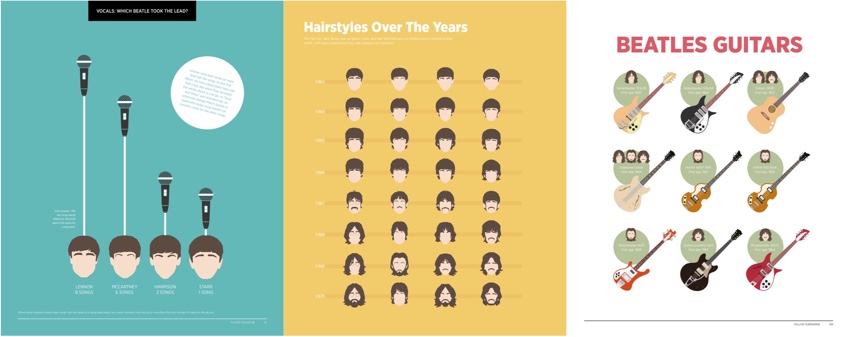
Explored visually, through stunning infographics and data visualisations, this book takes you on a vibrant ride through the Beatles years – from their first Cavern Club gig to the release of Let It Be.

Presenting unique, witty and surprising facts and stories, covering everything from their style to plans
for a Beatles Island, Visualising the Beatles charts how four young men evolved into one of the world’s greatest bands. It also includes beautiful visuals created from the data their music left behind, divided by album, to allow you to spot, in an instant, the patterns, anomalies and changes in the band’s lyrics, instruments, songwriting and performances.

The perfect gift for any fan of the Beatles or infographics.


Thursday
Jan192017

Strata + Hadoop World Discount & Giveaway

The Strata + Hadoop World conference in San Jose, CA is coming up on March 13-16, 2017! Readers of Cool Infographics enjoy a 20% Discount by following THIS LINK and using the code PCCOOL!

Act fast! The 20% discount will continue to work all the way up until the conference, but to get the best deal Early Pricing ends on Friday, January 20th!

This month, I'm also giving away one free Bronze Pass to the conference. Register for your chance to win the free conference pass on the Giveaways Page!

Wednesday
Nov232016

Better Presentations by Jon Schwabish: Interview & Giveaway

Better Presentations by Jon Schwabish: Interview & Giveaway

Better Presentations: A Guide for Scholars, Researchers, and Wonks is a great new book by Jon Schwabish from the newly redesigned PolicyViz! I'm especially excited about the chapter all about data visualization in presentations!

This December, I am giving away one signed copy of Better Presentations! Register on the Giveaways Page by December 31st to be entered.

 Whether you are a university professor, researcher at a think tank, graduate student, or analyst at a private firm, chances are that at some point you have presented your work in front of an audience. Most of us approach this task by converting a written document into slides, but the result is often a text-heavy presentation saddled with bullet points, stock images, and graphs too complex for an audience to decipher―much less understand. Presenting is fundamentally different from writing, and with only a little more time, a little more effort, and a little more planning, you can communicate your work with force and clarity.

Designed for presenters of scholarly or data-intensive content, Better Presentations details essential strategies for developing clear, sophisticated, and visually captivating presentations. Following three core principles―visualize, unify, and focus―Better Presentations describes how to visualize data effectively, find and use images appropriately, choose sensible fonts and colors, edit text for powerful delivery, and restructure a written argument for maximum engagement and persuasion. With a range of clear examples for what to do (and what not to do), the practical package offered in Better Presentations shares the best techniques to display work and the best tactics for winning over audiences. It pushes presenters past the frustration and intimidation of the process to more effective, memorable, and persuasive presentations.

Everyone should follow Jon Schwabish on Twitter (@jschwabish) and check out all the great resources on PolicyViz!


Jon answered a bunch of questions I sent him about visualizing data and the new book:

Who is the book intended for?

Jon Schwabish: I wrote the book for people who deliver data-rich content—researchers, scholars, analysts—anyone who works with data and who needs to present it to an audience. In my experience, many people who work with data and conduct research simply take their written reports and convert them to presentations—they copy their graphs and tables and paste them into a slide, and turn their text into bullet points. But there is a better way and it starts with recognizing that a written report and a presentation are two fundamentally different forms of communication. The goal of this book is to help presenters all the way through the process: From presentation construction and design, to building the presentation, to ultimately delivering the presentation.

What makes presenting so different from writing?

Jon Schwabish: The differences between writing and presenting are clearest when you think carefully about the audience. When your reader sits down with your paper, she has the opportunity to read the notes and footnotes, decipher the labels on your charts, even perhaps work through your equations. When you present, however, your audience does not have that opportunity: They are bound to your pace and content. If you fill your slides with text and bullet points, equations, and complex, detailed graphs, your audience will strain to follow you and understand your message.

There are also (or at least there should be) similarities between the two—at least when it comes to your preparation. We are all taught in grade school to set out an outline when we write a book report. Yet, we rarely do this when it comes to presentations. In the book, I propose that presenters develop their presentation before they start making slides. I walk through this outlining process and provide a worksheet that readers can use to help them outline and develop their presentation.

What should readers expect to learn and apply to their own presentations?

Jon Schwabish: The book takes you through the entire process of planning, designing, and delivering your presentation by following three guiding principles:

  • Visualize your content. We are better able to grasp and retain information through pictures than through just words, so visualize your content when you can; this includes text, statistics, and numbers whenever possible.
  • Unify the elements of your presentation. This means consistency in your use of colors and fonts, format of your slides, and integrating what you say with what you show.
  • Focus your audience’s attention where you want it at all times. Instead of putting up as much information as possible on every slide, keep your slides simple and free of clutter so that you can direct your audience’s attention. Here, I demonstrate a technique I call Layering—presenting each piece of information on its own. Together, the points come back to the original, but are now presented in more effective way for the audience. 

These three guidelines are applied to different slide elements such as text, images, and data visualizations. in the latter sections of the book, I talk about tools and technologies to create and deliver presentations.

What are the key mistakes people make in their presentations?

Jon Schwabish: I think many people view their presentation as a simple translation of their written report to slides, but again, a presentation is a fundamentally different form of communication than a report. Presenters need to put their audience first—think about how difficult it’s going to be for them to absorb your content and buy into your message as you zip through bullet after bullet, slide after slide, dense table after table.

The other big mistake people make is to not practice their presentation before they deliver it. You can practice your 15-minute conference presentation four times in an hour, which is probably four more times than anyone else at the conference. And it will show! The more you practice—actually, rehearse is probably a better term—the more familiar you will be with your content, which will reduce the need for text- and bullet-point heavy presentation. Practicing moves you away from the natural inclination to include lots of text on your slides. 

 Why is visualizing data and information in a presentation so important?

Jon Schwabish: There is a long research history that demonstrates we are more likely to grasp and retain information through pictures than just through words (typically known as the “Picture Superiority Effect”). By visualizing information, you make it easier for your audience to grasp your content and remember it. Visualizing data may be even more important in a presentation because, again, your audience is bound to your pace and how you present your data through graph choice, color, and layout.

There is a long chapter in the book on how to create effective data visualizations for presentations. I walk through basic data visualization principles and outline ways to effective communicate those data in a presentation. I demonstrate ways you can apply the Layering technique to graphs, by showing one data series at a time. But you don’t need to just Layer data—if you’re showing a more complex graph (or perhaps a graph type that is new for your audience), for example, you can start by just showing and defining the axes, and then sequentially add your data. In this way, you have defined the graphic space for the audience so they are prepared for what comes next.

What are your thoughts on animated slide transitions and/or clicking to reveal different pieces of information on a slide? 

Jon Schwabish: I’m generally not a big fan of animated slide transitions, especially the good ol’ Blinds and Checkerboard in PowerPoint and other tools. They tend to look cheesy and immature. That being said, I have found some of the “morphing” animations—Magic Move in Keynote and Morph in the newest versions of PowerPoint—to be quite useful. Say, for example, you want to walk your audience through an infographic. With these morphing animations, you can show the entire infographic and then seamlessly zoom in and scroll through the infographic on the screen. These sorts of techniques can be especially useful when you need to show the audience the full visual and then zoom in so they can see the details.

You also recently gave your presentation at a TED event. Can you share your experience?

Jon Schwabish: I spoke at the TEDxJNJ (Johnson & Johnson) event in Philadelphia. I was invited months earlier and even though I basically knew what I wanted to present right off the bat, it was a long haul to get the message just right and get the slides in great shape. I spent countless hours refining my message (especially the beginning and end), tweaking the slides, and practicing the talk.

When you’re invited to give a TEDx talk, you’re assigned a ‘coach’ who helps you develop your talk and design your visuals. We had weekly calls as I kept tweaking my message, content, and slides; I would send her audio recordings of my practice runs; and we would walk through slide design options. Just having someone who knew my content, my slides, and my struggles was invaluable. I typically try to rehearse my presentations in front of a live audience (and many of my co-workers at the Urban Institute sat in as I practiced the TEDx talk), but this experience really made me realize how valuable it is to have someone to help bounce ideas, concepts, and design off of.

Standing on that big red circle with the TEDx sign behind me was an incredible experience, and I’m thankful that people find my message value and of interest, and that I can communicate that to them in an engaging way.

Is there a website to go along with the book?

Jon Schwabish: Yes, my newly-redesigned website PolicyViz, has a whole section dedicated to the book (http://policyviz.com/better-presentations/).In that section of the site, you will find presentation, design, and data visualization resources including blogs, books, and tools. I’ve also included a section of Book Materials that you can download for your own use. In that section, I’ve included a Better Presentations Supplies Checklist that includes the technical things you may need when you go out and present. I’ve also included a Better Presentations Worksheet (the focus of Chapter 1), which will help guide your outline and organization. I’ve also included downloadable slides, icons, color palettes, and more.

Where’s the best place to follow you online?

Jon Schwabish: You can follow me on my newly-redesigned website, PolicyViz.com, which now hosts my blog, podcast, shop, and HelpMeViz project. I’m also active on the Urban Institute blog, Urban Wire, and have a researcher page there as well. I’m most active on Twitter, and you can easily find me there @jschwabish.


Jon's Bio

Jon Schwabish is an economist, writer, teacher, and creator of policy-relevant data visualizations. He is considered a leading voice for clarity and accessibility in how researchers communicate their findings. His new book Better Presentations: A Guide for Scholars, Researchers, and Wonks helps people improve the way they prepare, design, and deliver data-rich content. He is on Twitter @jschwabish


Tuesday
Aug232016

Strata-Hadoop World NYC Conference Pass Giveaway & Discount

Strata-Hadoop World NYC Conference Pass Giveaway & Discount

The O'Reilly Strata+Hadoop World conference is coming up September 26-29 in New York City, NY!

First, I have a discount code from O'Reilly that will get you 20% OFF the registration cost!  Click THIS LINK and use the code PCCOOL during checkout to get the 20% discount.

Second, this month's giveaway is one free pass to the Strata+Hadoop World NYC conference! Register on the GIVEAWAYS page before 11:59pm CT on September 2, 2016 to be entered. I will randomly chose a winner on September 3rd.