About
Randy Krum
President of InfoNewt.
Data Visualization and Infographic Design

Infographic Design

Infographics Design | Presentations
Consulting | Data Visualizations

DFW DataViz Meetup

Join the DFW Data Visualization and Infographics Meetup Group if you're in the Dallas/Fort Worth area!

Search the Cool Infographics site

Custom Search

Subscriptions:


Feedburner

The Cool Infographics® Gallery:

How to add the
Cool Infographics button to your:

Cool Infographics iOS icon

- iPhone
- iPad
- iPod Touch


Read on Flipboard for iPad and iPhone

Featured in the Tech & Science category

Flipboard icon

Twitter Feed
From the Bookstore

Caffeine Poster

The Caffeine Poster infographic

Entries in class (5)

Thursday
Jun142018

Giveaway: Design Better Charts in PowerPoint

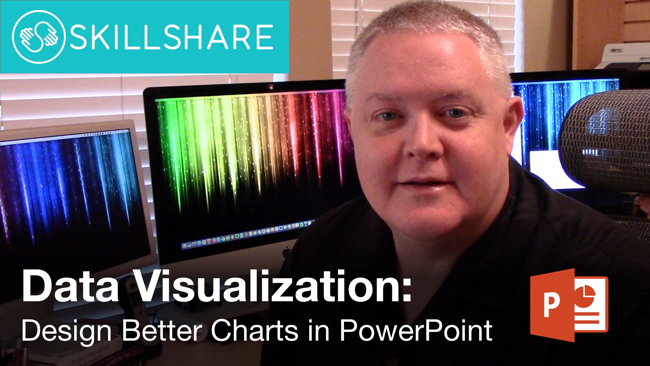
The giveaway for June is ONE FREE PASS to my complete class on Skillshare, 44 minutes for all 10 lessons! Students with a Free Access Link can watch the complete class for free without a Skillshare Premium Membership.

Register on the Giveaways Page by June 30, 2018 to be entered.

Skillshare is an online subscription learning community with thousands of classes on everything from business to graphic design to fashion – it’s the Netflix of learning. You can use THIS LINK to see my class and sign up and get two free months! That's plenty of time to take my class and try out a few others. Once you're a member, you have access to all of classes that Skillshare offers, and there are thousands of them.

If you're already a Skillshare member, then you already have access! Please check out my class, and share with your network of friends and co-workers. Follow me on Skillshare to catch any future class I post as well!

Here's a quick time lapse of the sample file I use for demonstration in the class. This will give you an idea of how the data visualization design principles are applied to a bar chart in PowerPoint:

Monday
Oct122015

Giveaway: Data Visualization Training Video Package

I have ONE Data Visualization - 5-Course Video Training package from O'Reilly to give away in October! This is a great giveaway! Regular price $309.99, Over 14 Hours of online training

Register HERE by 11:59pm on October 30, 2015 to be entered.

A winner will be randomly selected on Oct 31st.

Successful data visualizations allow you to impart meaning and emphasis to your data points. This Learning Path will teach you how to display trends, patterns, and outliers while you discover the power of letting your data to speak. Once you’ve finished, you’ll be able to efficiently communicate volumes of data with ease. The Data Visualization training package includes all five course videos:

  1. An Introduction to d3.js: From Scattered to Scatterplot, Presented by Scott Murray | 2 hours 52 minutes
  2. Learning to Visualize Data with D3.js, Presented by Rafael Hernandez | 3 hours 52 minutes
  3. Using Storytelling to Effectively Communicate Data, Presented by Michael Freeman | 1 hour 30 minutes
  4. Effective Data Visualization, Presented by Jeff Heer | 2 hours 52 minutes
  5. Intermediate D3.js, Presented by Scott Murray | 3 hours 38 minutes
Tuesday
Sep082015

DataViz & Infographics Fall Course at SMU CAPE

Cool Infographics Course at SMU

Infographics & Data Visualization Design

September 24-November 12, 2015 | 6pm-9pm Thursday Evenings | SMU CAPE Plano Campus | $595

$75 off discount code for Cool Infographics readers: RK215

This Fall, I will again be teaching a course as part of the CAPE program (Continuing and Professional Education). This time the course will be at a new location at the SMU Plano Campus. This is a very hands-on course where participants will start to develop better charts, infographics and your own infographic resume. Topics include:

  • The art and science of data visualization and infographics
  • The data visualization and infographics design process
  • Data analytics and basic statistics for the designer
  • Different chart types, dashboards and graphing options
  • How to use the various software and online tools readily available and when to use them
  • Strategies for publishing and promoting infographics online
  • Understanding IP, trademark and copyright issues and how they relate to infographics
  • And more...

Please share with anyone in the Dallas area, or join the class yourself. Enrollment is very limited, so register quickly!

Click Here to learn more: bit.ly/SMU-DataViz-Plano


Also check out the DFW Data Visualization & Infographics Meetup group with monthly speakers and events in the Dallas-Fort Worth area!

Sunday
Feb222015

Cool Infographics Course at SMU

Cool Infographics Course at SMU

Infographics & Data Visualization Design

April 7-May 19, 2015 | 6am-9pm Tuesday Evenings | SMU CAPE Dallas Campus | $495

$50 off discount code for Cool Infographics readers: VIP50

I will be teaching a new course at the SMU Dallas Campus this spring as part of the CAPE program (Continuing and Professional Education). In this course, working professionals will become familiar with the exciting and expanding field of data visualization and infographics. By attending this course you will start to develop your own portfolio and learn:

  • The art and science of data visualization and infographics
  • The data visualization and infographics design process
  • Data analytics and basic statistics for the designer
  • Different chart types, dashboards and graphing options
  • How to use the various software and online tools readily available and when to use them
  • Strategies for publishing and promoting infographics online
  • Understanding IP, trademark and copyright issues and how they relate to infographics
  • And more…

Please share with anyone in the Dallas area, or join the class yourself. Enrollment is very limited, so register quickly!

Click Here to learn more: bit.ly/SMU-DataViz


Also check out the DFW Data Visualization & Infographics Meetup group with monthly speakers and events in the Dallas-Fort Worth area!

Thursday
Apr152010

The Feltron Annual Report 2009 and an Online Class April 29th

I’m not sure how it slipped off the radar, but I haven’t posted a link to the Feltron Annual Report 2009 here on the blog yet.  Nicholas Feltron has done infographics for Time, CNN, Wired, New York Times, Fast Company and more, but probably his most popular infographics are his annual reports.  The print version of the Feltron Annual Report 2009 is available for pre-order for $30 from the Feltron Store.

Mike Aruz interviewed Nicholas Feltron when the 2009 Annual Report was released on mikearauz.com

The reason this came up today is that Nicholas is going to be the host of Live DesignCast: Nicholas Felton, A Master Class on Information Design.  This is an online class from PRINT Magazine on April 29, 2010 at 4pm EST.  The class costs $69 and is one hour long.

Our current information age has produced an inevitable crush of complicated data to sort through. Thankfully, there is a rising group of designers who present all this data in a way that we can understand and use. And for the last several years, no one has done it better than Nicholas Felton. 

In this Master Class, Felton explains how detailed data leads to better stories, offers a few guidelines for displaying complicated data sets, and challenges you to use all five senses through the process. 

In this Master Class DesignCast, you’ll learn: 

• How to visualize large data sets
• How to go from an initial question to gathering, comparison, and display 
• How to use sensors, whether hardware or software, to gather data
• How data helps satisfy curiosity, provides insight, and entertains
• How better data leads to better stories