About
Randy Krum
President of InfoNewt.
Data Visualization and Infographic Design

Infographic Design

Infographics Design | Presentations
Consulting | Data Visualizations

DFW DataViz Meetup

Join the DFW Data Visualization and Infographics Meetup Group if you're in the Dallas/Fort Worth area!

Search the Cool Infographics site

Custom Search

Subscriptions:


Feedburner

The Cool Infographics® Gallery:

How to add the
Cool Infographics button to your:

Cool Infographics iOS icon

- iPhone
- iPad
- iPod Touch


Read on Flipboard for iPad and iPhone

Featured in the Tech & Science category

Flipboard icon

Twitter Feed
From the Bookstore

Caffeine Poster

The Caffeine Poster infographic

Entries in Data (85)

Thursday
Jul132017

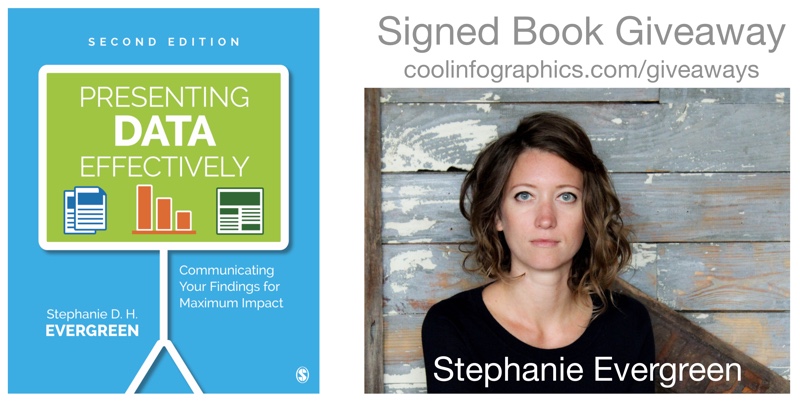
Presenting Data Effectively by Stephanie Evergreen!

Presenting Data Effectively Stephanie Evergreen 2nd Edition Interview and Giveaway

The updated 2nd Edition of Presenting Data Effectively by Dr. Stephanie Evergreen was just released! This is a fabulous resource, and the new edition includes full color images and screenshots as well as new content!

During JULY 2017, I am giving away one signed copy of Presenting Data Effectively! Register on the Giveaways Page by July 31st to be entered.

Now in striking full color, Presenting Data Effectively, Second Edition by Stephanie D. H. Evergreen shows readers how to make the research results presented in reports, slideshows, dashboards, posters, and data visualizations more interesting, engaging, and impactful. The book guides students, researchers, evaluators, and non-profit workers—anyone reporting data to an outside audience—through design choices in four primary areas: graphics, text, color, and arrangement. The Second Edition features an improved layout with larger screenshots, a review of the recent literature on data visualization, and input from a panel of graphic design experts.

Stephanie was very helpful and answered a bunch of questions I sent her about visualizing data and the updated book:

Who is the book intended for?

Stephanie Evergreen: Anyone who has to convey some information to other people should read this book, whether it is in a report, a slideshow, a dashboard, etc.


It’s been 4 years since the 1st edition. What has changed the most?

Stephanie Evergreen: Color! We are finally catching up with the modern world and printing in full color. And speaking of catching up, I’ve included a lot of new content about how we have to change how we report to adapt to a mobile reading culture.


What does it mean to present data effectively?

Stephanie Evergreen: At the very core, that means people understand what we are trying to say. Which means we will have to adjust how we talk about our work so it aligns with how humans come to understand things. So with a little bit of the research behind how brains work, we end up with many significant implications for how we report.


What makes presenting data effectively so challenging?

Stephanie Evergreen: The hardest part is uprooting the ways we have been taught to present, usually from academia. You know what I mean. Lots of bullet points. Dense slides. Too much detail. We think we have to come off this way because it will show we are studious, thorough, and very smart. But reality is that it will only confuse our audiences. And if we are confusing our audiences, we aren’t doing our job. It actually takes in-depth knowledge about a topic to be able to convey it to others with clarity.


What should readers expect to learn and apply to their own presentations?

Stephanie Evergreen: Readers will learn extremely practical guidelines to apply AND the buttons to push to make it happen, right inside the software we all already own.


Is there an ideal balance of text and visuals on a presentation slide?

Stephanie Evergreen: Slides are intended to be a visual support for our talk. So the ideal balance is enough text to frame your key point and a visual that provides the evidence or context for that key point.


How do you help people that are told to only use the company’s colors, fonts and presentation templates?

Stephanie Evergreen: Use them very well. And look for the places where the style guide *doesn’t* dictate your choices – such a font size – and do your magic in those gaps.


What are your thoughts on animated slide transitions and/or clicking to reveal different pieces of information on a slide.

Stephanie Evergreen: Please no transitions. The last thing you want is people thinking “oooh look at how her slide swept away like an ocean tide” because while they are thinking that, they’ve missed everything you were saying. Animating is a different story. Animation can be helpful to break down complex stuff and make it easier to digest. Just don’t be obnoxious (Swivel In, I’m talking about you).


How difficult is it to choose the right chart style?

Stephanie Evergreen: We have a lot of choices, so it can be difficult to even know where to begin. But if you start with your point – the thing you are actually trying to say with this data – you’re headed in the right direction. And coming up with your point, as in really doing the thinking and the analysis, is the hard part.


Is complexity the enemy of good data visualization design?

Stephanie Evergreen: Heck no! Clutter is the enemy of good data visualization design. Complex stuff can be clear and easy if we strip out all the junk.


How do you make it look so easy?

Stephanie Evergreen: I’m funny.


Is there a website to go along with the book?

Stephanie Evergreen: My website rocks. http://stephanieevergreen.com/ My blog is full of tons of resources and I put out new posts every other week that show you exactly how to do what I do. Books are awesome but they take 6 months to print and in that time, I’ve already had a dozen new ideas and the blog is where you’ll find them.


Are you speaking at any upcoming presentations or webinars?

Stephanie Evergreen: I’m on the road, criss-crossing the globe, working with truly awesome folks, giving keynotes and workshops about 35% of my life (typing on a plane right now). Check out my events here: http://stephanieevergreen.com/upcoming-events/ and come say hi or bring me in yourself.


Where’s the best place to follow you online?

Stephanie Evergreen: Dataviz nerds hang out on Twitter, so catch me there https://twitter.com/evergreendata . You can also follow my travel adventures on Instagram at: https://www.instagram.com/severgreen/

Monday
Aug082016

23 Reasons to Get Excited About Data (Free eBook)

23 Reasons to Get Excited About Data IBM eBook

The team at IBM Watson Analytics has released a free, new eBook 23 Reasons to Get Excited About Data that explores the latest trends, practical applications and predictions about big data. I'm honored to have been included in the book as an expert on data visualization, along with all of the other IBM Watson Analytics applications!

These days, everyone’s tossing around the term “big data.” The term is nothing new – businesses have been collecting and analyzing data since the 1950s, before the two words were ever even uttered. Take a look back in time and you’re likely to see someone laboriously poring over a sheaf of spreadsheets, manually going through row after row to identify trends and gain insights.

More people are doing more things – personally and professionally – with data, and best practices will continue to develop. Self-serve, more democratized data analytics will Get Bigger, Get Faster and Get Cloudier!

I participated in an IBM video series about big data and visualization that you can see HERE. Data visualization is such an important conponent for humans to the analyze data, discover insights and communicate our findings to others! I'm very passionate about helping people understand how important data visualization truly is! Here are a couple of the thoughts I contributed to the ebook:

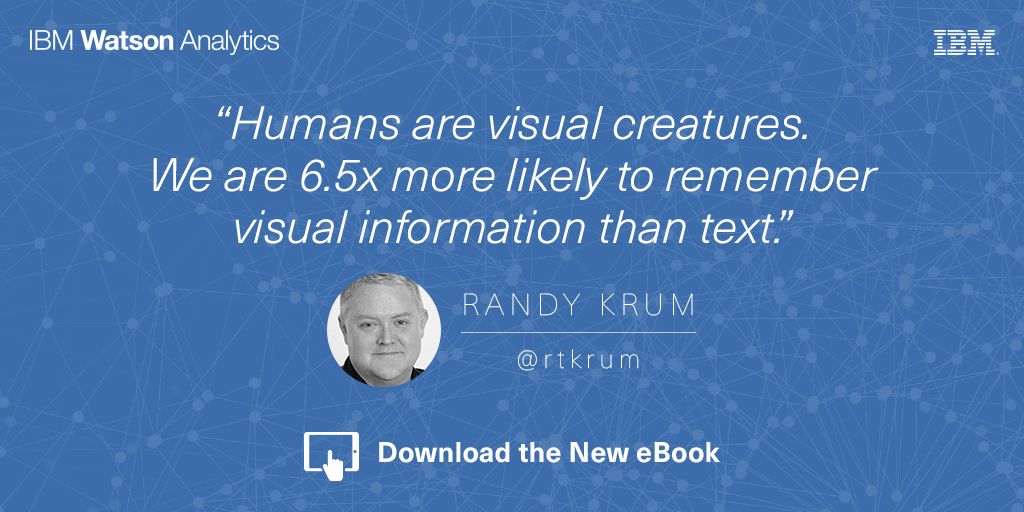
Humans are visual creatures. We can process visual information extremely fast, and are 6.5 times more likely to remember visual information than text. These are incredibly important facts when you are trying to communicate data to others. Use data visualizations to help your audience understand your information, and remember it later when it could influence their decisions or behavior. - Randy Krum

Data visualization is a language of context. You dramatically improve comprehension of your data when you design a visualization that puts your data into context for the audience. This can be a series of data points over time, or comparing your data to reference data to give the audience the perspective of how your data fits into a bigger picture. Storytelling with data is more than designing a chart, it’s the art of communicating specific insights from your data. - Randy Krum

Are you doing everything you could with your data? The future of data, along with predictive analytics and data visualization, is very exciting! Grab the free ebook now!

23 Reasons to Get Excited About Data IBM eBook Randy Krum Quote

Wednesday
Aug032016

Very Few Americans Nominated Trump and Clinton

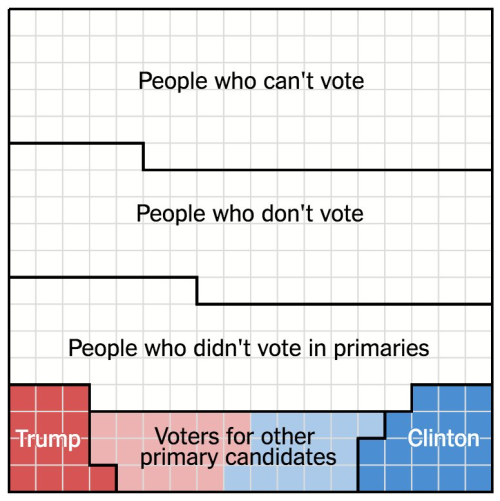
Designed by Alicia Parlapiano and Adam Pearce for the New York Times, this short series of data visualizations tell a very clear story about how Only 9% of America Chose Trump and Clinton as the Nominees For the 2016 Presidential election.

The United States is home to 324 million people. Each square here represents 1 million people.

103 million of them are children, noncitizens or ineligible felons, and they do not have the right to vote.

88 million eligible adults do not vote at all, even in general elections.

An additional 73 million did not vote in the primaries this year, but will most likely vote in the general election.

The remaining 60 million people voted in the primaries: about 30 million each for Republicans and Democrats.

But half of the primary voters chose other candidates. Just 14 percent of eligible adults — 9 percent of the whole nation — voted for either Mr. Trump or Mrs. Clinton.

Mr. Trump and Mrs. Clinton will be working to win the votes of these three groups. Polls suggest they will be separated by just a handful of squares.

If you follow the news headlines, you might think a majority of Americans are in favor of one of our two Presidential nominees, but that would be a misunderstanding of election and population statistics.

This is a fantastic example of storytelling with data, and walking the audience through the data insight step-by-step.

Found on FlowingData


Thursday
Jul142016

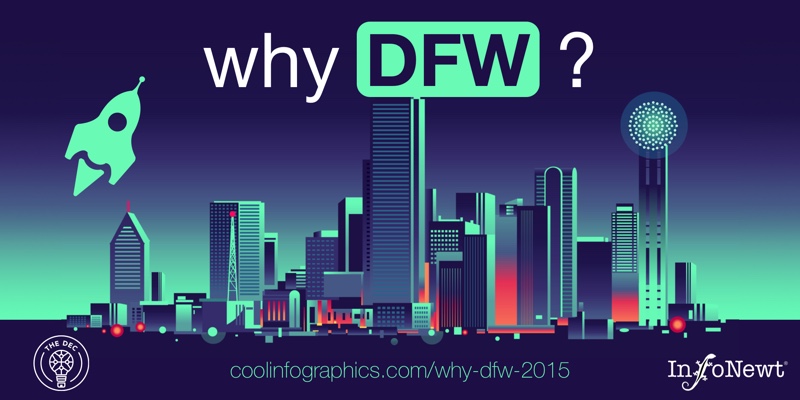
Why DFW? 2015

Why DFW? A guide to starting, building, and growing your business in Dallas-Fort Worth

Based on data from 2015, I designed this infographic (InfoNewt) very quickly over a weekend in conjunction with Debra Swersky (@DebraSwersky) and The Dallas Entrepreneur Center (The DEC) co-working space located in downtown Dallas.

I love being a part of the Dallas startup community! It's a growing, vibrant, fully-enagaged community of entrepreneurs, and I have a bunch of ideas for future infographics.

Also created a social graphic with 2:1 Aspect ratio for easy sharing on Twitter and other social media platforms.

Thursday
Jul072016

Which Foods Are Really Healthy?

Is Sushi ‘Healthy’? What About Granola? Where Americans and Nutritionists Disagree

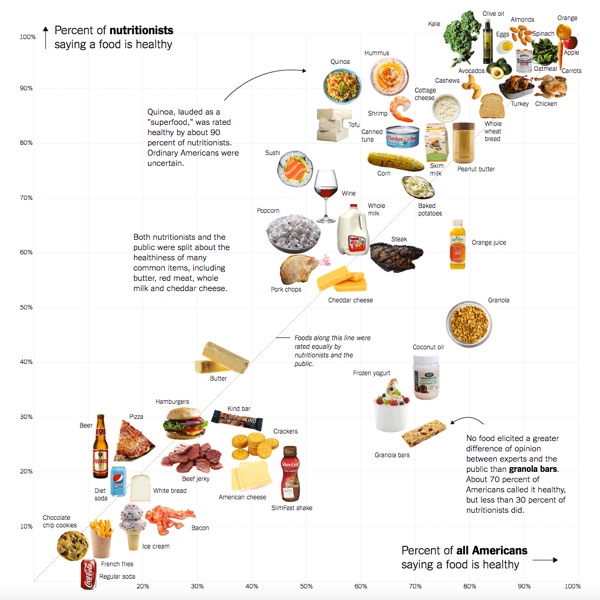
After surveying nutritionists and Americans, the NY Times has plotted the results, showing some surprising disagreements. Is Sushi ‘Healthy’? What About Granola? Where Americans and Nutritionists Disagree charts the differences in opinion, but where do you stand?

We surveyed Americans and a panel of nutrition experts about which foods they thought were good or bad for you.

Is popcorn good for you? What about pizza, orange juice or sushi? Or frozen yogurt, pork chops or quinoa?

Which foods are healthy? In principle, it’s a simple enough question, and a person who wishes to eat more healthily should reasonably expect to know which foods to choose at the supermarket and which to avoid.

Unfortunately, the answer is anything but simple.

The results suggest a surprising diversity of opinion, even among experts. Yes, some foods, like kale, apples and oatmeal, are considered “healthy” by nearly everyone. And some, like soda, french fries and chocolate chip cookies, are not. But in between, some foods appear to benefit from a positive public perception, while others befuddle the public and experts alike. (We’re looking at you, butter.)

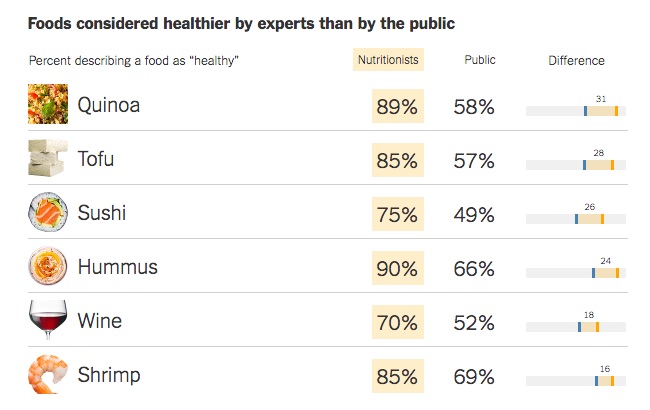
They also created some supporting graphs that highlight the major differences. This one shows the largest differences where many more nutrition experts consider these foods to be healthy than the general public.

Foods considered healthier by experts than by the publicThanks to Karen for sharing on Facebook!

Tuesday
May172016

Even Major News Outlets Get DataViz Wrong


Data visualization can be the most powerful, inspiring, and effective tool of a storyteller—as long as it’s accurate. However, a visualization can go horribly wrong if the designer uses the design tool incorrectly or gets the math wrong.

All too often, the underlying data is correct, but the visualization doesn’t accurately represent the corresponding values. Most of the time, it’s safe to chalk up the false visualization to an honest mistake by the designer, because it’s actually easier than you think.

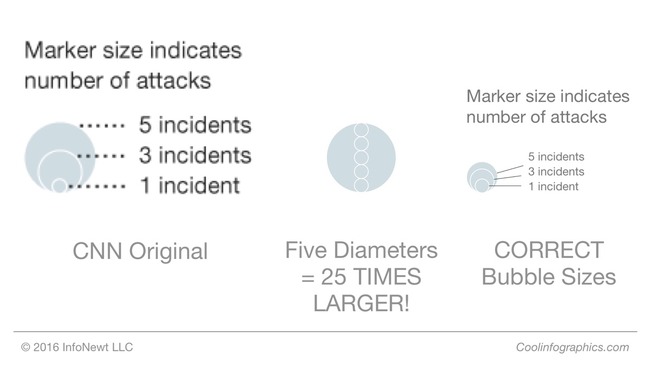
Take a bubble chart, for example. A great visualization method, but it’s a common source of flawed dataviz. The reason is that design software only allows scaling or width and height adjustments to size shapes. So designers, upon reviewing the data, will sometimes mistakenly scale a circle's diameter instead of the circle’s area. This, in turn, produces radically incorrect sizes. The approach has logic to it (to some degree), but it’s inherently wrong. What should instead be done takes a bit of geometry and a spreadsheet.

“Just think about it: if you tell a software tool to scale something 200 percent, it will make it twice as tall and twice as wide. Therefore, you aren’t doubling the size of your original circle. You’re making it four time larger.”

- The Truthful Art, Alberto Cairo (@albertocairo)

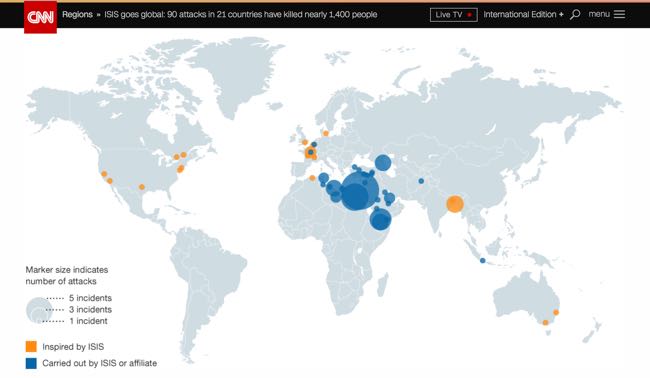
For a real-world example of this problem, take a look at CNN’s recent “ISIS goes global: 90 attacks in 21 countries have killed nearly 1,400 people,” an insightful article, serious topic, credible source with inaccurate data visualizations. Unsurprisingly, it’s a bubble chart at fault. Assuming the data gathered by CNN is accurate, the maps included in the article don’t match the data and are way off.

CNN ISIS Goes Global Incident Map Bad DataViz

Take a close look and the size key. The circle size for five incidents is clearly shown as five times the diameter of the circle for only one incident, which creates a circle for “5 incidents” that is actually 25 TIMES LARGER, not five times larger. This drastically over emphasizes the locations on the map for the Middle East! I’ve designed the correct sizes so you can see what the bubble sizes should be.

CNN ISIS Circles DataViz Key Corrected

“It’s key for data visualization designers to understand that we visually compare the sizes of objects based on the their area (not their height). Numerical values are one-dimensional, but objects on a page or screen are two-dimensional. This is where designers need to remember to use the math learned from high-school geometry class. If you didn’t do well in geometry, it’s time to take another look.”

- Cool Infographics, Randy Krum (@rtkrum)

Bubble charts are in no way the only kind of dataviz that lends itself to mishaps. In print, broadcast, and online, you’ll see a variety of charts incorrectly showing the data — pie charts not adding up to 100%, logo sizes that don’t match the data, lines of icons with a different quantity than the data, etc.

Inaccurate dataviz certainly doesn’t always happen by accident either. Creating deceptive visual context is an unethical tactic employed by researchers, companies and publications alike, typically to promote a persuasive argument. Differences can be blown out of proportion or hidden by changing the axis scale or ignoring relevant data.

Once you start looking at data visualizations as a critical thinking reader, you’ll start notice many charts that don’t match the data. Always look to make sure the designer accurately represented the information before you take any data visualization at face value.

Monday
Apr182016

Experts Predict the Future of Data Analytics and Visualization

IBM Watson Analytics is a data discovery service that guides data exploration, automates predictive analytics and enables dashboard and data visualization creation. Through their Expert Series videos, Watson Analytics explores the future trends of data analytics. I had the pleasure of participating in this series, along with other prominent figures in the field.

Watch these interviews to learn about today’s trends in data visualization, data analysis, and which trends we think will have the most significant impact on the future of analytics.


What trends in data visualization are you seeing today and what are the opportunities for the future? (2:24)

Cathy Harrison (@VirtualMRX), Randy Krum (@rtkrum), William McKnight (@williammcknight), Tony Adams (@tonyadam)


Which trend do you think will have the most significant impact on the future of Analytics and why? (1:52) (1:44)

Deborah Berebichez (@debbiebere), Randy Krum (@rtkrum), Anil Batra (@AnilBatra), Valdis Krebs (@OrgNet), Christopher Penn (@cspenn)


What is your #1 tip for anyone who is asked to use data to inform business decisions? (2:22)

Deborah Berebichez (@debbiebere), Miles Austin (@milesaustin), Juntae DeLane (@JuntaeDeLane), Anil Batra (@AnilBatra), Tony Adams (@tonyadam)


What trends in data analysis are you seeing today, and what are the opportunities for the future? (2:19) (1:37)

Emilio Ferrara (@jabawack), Bob E. Hayes (@bobehayes), John D. Cook (@JohnDCook), Juntae DeLane (@JuntaeDeLane), Miles Austin (@milesaustin)


You can also subscribe and follow all of the IBM Watson Analytics videos on YouTube:


Monday
Apr112016

What are Data Centers?

What are Data Centers? infographic

The Internet is where we store and receive a huge amount of information. It is also the home of Netflix, one of our largest sources of instant entertainment these days. But how does it work? The Internet is so vast! How does Netflix even get the videos to you? Where is all the information stored? And what does it mean when I store things on "The Cloud?" The answer is data centers.

What are Data Center? infographic from Wilcon can answer all these questions and more about Internet storage and dispersion. 

When you think of a data center, you probably think of a room that looks like it’s out of Star Wars. A darkened room with rows of blinking servers and cool air blowing through the floor. But what does that have to do with your day-to-day life? More than you realize. The role of the data center is surprisingly understated due to how vital it is in nearly every business function. All the movies and TV shows you stream on a daily basis wouldn’t be possible without data centers. So, what exactly are they and how do they work? This infographic from Wilcon examines the layout of data centers and how they function to keep our data secure.


Thanks to Alan for sending in the link!

Tuesday
Feb092016

O'Reilly Strata Conference Discount & Giveaway

The O'Reilly Strata+Hadoop World conference is coming up quickly on March 28-31 in San Jose, CA.

First, I have a discount code from O'Reilly that will get you 20% OFF the registration cost! Click this link, and use the code AFF20 during checkout to get the 20% discount.

Second, this month's giveaway is one free Bronze pass to the Strata conference! Register on the GIVEAWAYS page before 11:59pm CT on February 29, 2016 to be entered. I will randomly chose a winner on March 1st.

Monday
Jan252016

Building Responsive Data Visualization for the Web

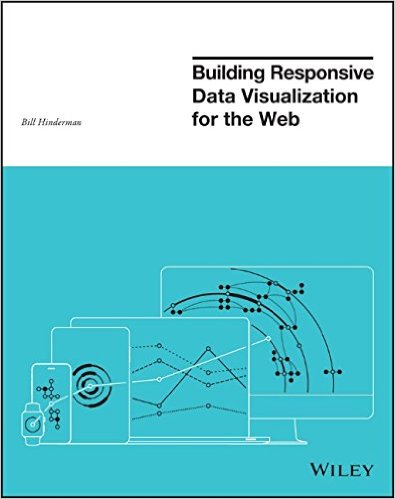
Building Responsive Data Visualization for the Web book cover

Building Responsive Data Visualization for the Web by Bill Hinderman is a new book that just came out in November. I had the pleasure of helping Bill as the Technical Editor on the book last year, and I can say it's a fantastic guide to structuring your data and building your code for interactive data visualizations that work perfectly on every screen size.

January Giveaway! This month I am giving away one signed copy to a randomly chosen winner. Register on the GIVEAWAYS page by 11:59pm CT on January 31, 2016 to be entered. A winner will be randomly selected on February 1st.

Data is growing exponentially, and the need to visualize it in any context has become crucial. Traditional visualizations allow important data to become lost when viewed on a small screen, and the web traffic speaks for itself – viewers repeatedly demonstrate their preference for responsive design. If you're ready to create more accessible, take-anywhere visualizations, Building Responsive Data Visualization for the Web is your tailor-made solution.

Building Responsive Data Visualization for the Web is a handbook for any front-end development team needing a framework for integrating responsive web design into the current workflow. Written by a leading industry expert and design lead at Starbase Go, this book provides a wealth of information and practical guidance from the perspective of a real-world designer. You'll walk through the process of building data visualizations responsively as you learn best practices that build upon responsive web design principles, and get the hands-on practice you need with exercises, examples, and source code provided in every chapter. These strategies are designed to be implemented by teams large and small, with varying skill sets, so you can apply these concepts and skills to your project right away.

Responsive web design is the practice of building a website to suit base browser capability, then adding features that enhance the experience based on the user's device's capabilities. Applying these ideas to data produces visualizations that always look as if they were designed specifically for the device through which they are viewed. This book shows you how to incorporate these principles into your current practices, with highly practical hands-on training.

  • Examine the hard data surrounding responsive design
  • Master best practices with hands-on exercises
  • Learn data-based document manipulation using D3.js
  • Adapt your current strategies to responsive workflows


I asked Bill to answer a few questions about his book:

Who is the book intended for?

The book is for a development and design team that is looking to shift toward responsive, mobile-first practices.  While it's certainly geared most toward data visualization projects, the book spends a hefty amount of time building responsive design tenets before then getting specifically into visualization.


What’s the most important thing to make a great data visualization?

In my mind, the most important thing in making a great data visualization is the output being actionable.  The goal of a visualization is always to make something more clear, right?  All of the data is already...there, in its raw form.  So the initial goal, the more achievable goal, is clarity. But making something clear, and then also making it actionable - that is - pushing the reader/viewer/user toward actually doing something with the data, is where greatness shows up.


Do you see everyone moving towards responsive data visualization, or are a lot of companies holding back?

No, I actually don't.  I see a huge amount of people holding back, really with the same reasoning that plagued responsive design in its early stages.  That being: "People don't want to do that on mobile."  Which is, quite frankly, ridiculous.  Every study Pew has put out (I reference plenty of them in the book) shows that as soon as someone is given the opportunity to do something on mobile, they do it.  Moreover, there's an increasing amount of mobile-only users, rather than simply mobile-first.  Very soon, desktop users are going to be seen as an antiquated, legacy type of use case, rather than the default.


What's the difference between Responsive Data Visualization and Responsible Data Visualization?

Responsive data visualization is the practice of building data visualizations in such a way that they adapt, respond to, and feel natural regardless of whatever device type a user is accessing them with, and whatever the data set looks like.  In this way, it is the responsible way to visualize data.  So...there isn't one, I suppose.


What do you mean in the book by “Think Small”?

So a concept that's very closely tied to responsive design is thinking mobile-first.  That is: designing first for your most limited use case: a small screen, a bad network, sloppy, finger-based gestures.  In data visualization, we actually have an even more limited use case: no screen at all.  That's where building a good API comes into play.  Thinking of the smallest, most limited use case, say, an external call to your API from a different website, and building toward that first.  That way, as you gain real estate, features, bandwidth, you are simply enhancing something that already has a great foundation.


What are your thoughts on D3.js and its future?

It's the best, and I love it and if I could, I would shower it with chocolates.  D3.js is, if you're able to devote a development resource to learning it, the absolute best way to create a visualization on the web, because it uses all the languages of the web.  Because it isn't some applet, or some plugin, or some...image, I suppose, it just works intuitively like you are building normally for the web.  Because of this, I think the future is bright.  Even if it were never to be updated again (which isn't the case), it would still implicitly grow in functionality as web languages evolve and grow around it.


What’s available for readers on the book website: http://responsivedatavisualization.com/?

The website has snippets from every chapter of the book, along with exercises and code samples that go along with the practice sections in the chapters.  All of the code links to GitHub, and can be forked, built locally, and compared with solutions.


Are you speaking at any upcoming presentations or webinars?

I am!  I'll be speaking at Strata + Hadoop World San Jose in March (http://conferences.oreilly.com/strata/hadoop-big-data-ca).


Where’s the best place to follow you online?

The best places to follow me online are my own website (billhinderman.com), LinkedIn (linkedin.com/in/williamHinderman), or Twitter (twitter.com/billHinderman).