About
Randy Krum
President of InfoNewt.
Data Visualization and Infographic Design

Infographic Design

Infographics Design | Presentations
Consulting | Data Visualizations

DFW DataViz Meetup

Join the DFW Data Visualization and Infographics Meetup Group if you're in the Dallas/Fort Worth area!

Search the Cool Infographics site

Custom Search

Subscriptions:


Feedburner

The Cool Infographics® Gallery:

How to add the
Cool Infographics button to your:

Cool Infographics iOS icon

- iPhone
- iPad
- iPod Touch


Read on Flipboard for iPad and iPhone

Featured in the Tech & Science category

Flipboard icon

Twitter Feed
From the Bookstore

Caffeine Poster

The Caffeine Poster infographic

Entries in ebook (3)

Thursday
Nov292018

Big Data & Infographics eBook Bundle

Humble Bundle and Wiley Tech have teamed up to offer the Big Data & Infographics Book Bundle! This is a limited-time offer, and EXPIRES on Monday December 3rd, 2018 at 2pm EDT! I love that this deal is supporting Doctors Without Borders!

HUMBLE BOOK BUNDLE: BIG DATA & INFOGRAPHICS BY WILEY

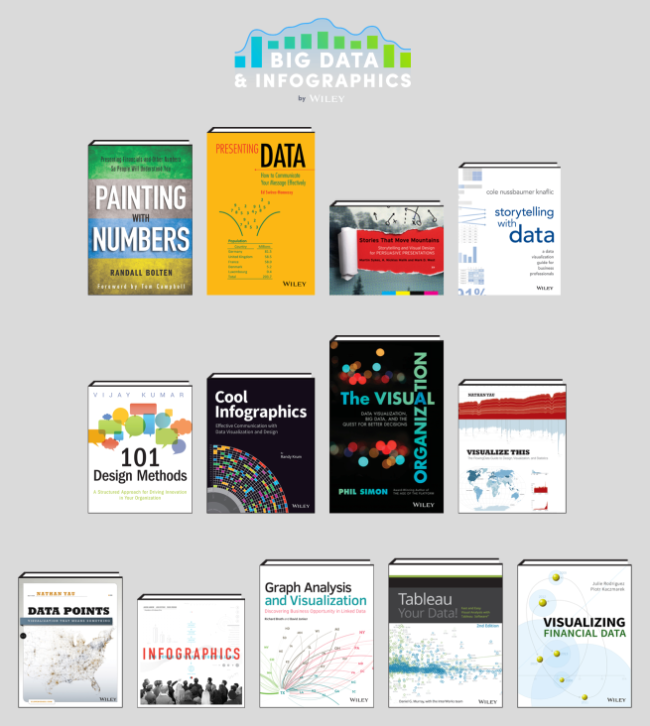
We've teamed up with Wiley for our newest bundle! Get titles like 101 Design Methods: A Structured Approach for Driving Innovation in Your Organization, Cool Infographics: Effective Communication with Data Visualization and Design, and The Visual Organization: Data Visualization, Big Data, and the Quest for Better Decisions. Plus, your purchase will support Doctors Without Borders!

My book, Cool Infographics, is part of the deal, but I'm not getting a portion of the bundles. No affiliate link, no sponsorship fee, no kickbacks. I didn't even know about the deal until I noticed other people talking about it on Twitter! I'm just excited for my book to be included in the bundle for promotion!

(I did notice they used the dataviz design from my book cover for their promotional graphics)

It is a fantastic collection of books, and you should grab it while it's available! I have most of these on my shelf!


Monday
Aug082016

23 Reasons to Get Excited About Data (Free eBook)

23 Reasons to Get Excited About Data IBM eBook

The team at IBM Watson Analytics has released a free, new eBook 23 Reasons to Get Excited About Data that explores the latest trends, practical applications and predictions about big data. I'm honored to have been included in the book as an expert on data visualization, along with all of the other IBM Watson Analytics applications!

These days, everyone’s tossing around the term “big data.” The term is nothing new – businesses have been collecting and analyzing data since the 1950s, before the two words were ever even uttered. Take a look back in time and you’re likely to see someone laboriously poring over a sheaf of spreadsheets, manually going through row after row to identify trends and gain insights.

More people are doing more things – personally and professionally – with data, and best practices will continue to develop. Self-serve, more democratized data analytics will Get Bigger, Get Faster and Get Cloudier!

I participated in an IBM video series about big data and visualization that you can see HERE. Data visualization is such an important conponent for humans to the analyze data, discover insights and communicate our findings to others! I'm very passionate about helping people understand how important data visualization truly is! Here are a couple of the thoughts I contributed to the ebook:

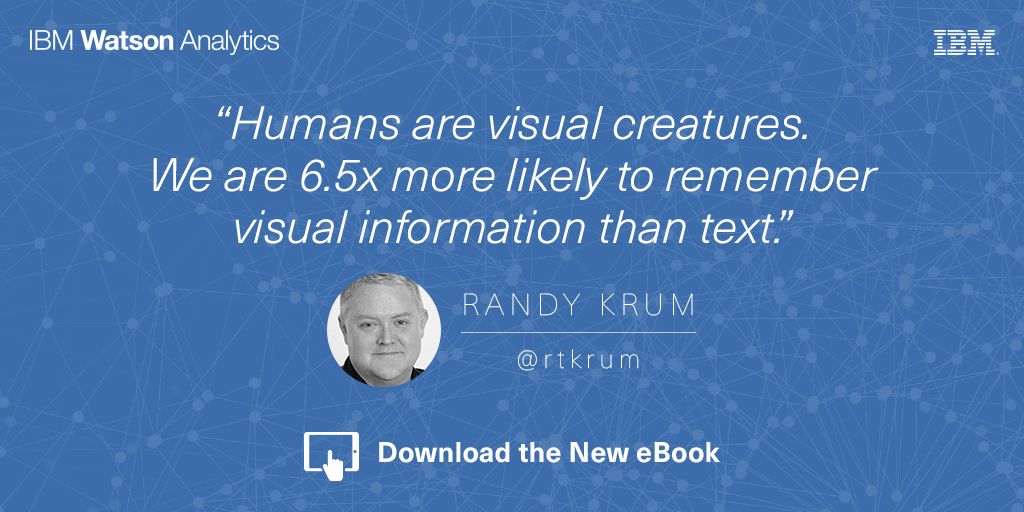
Humans are visual creatures. We can process visual information extremely fast, and are 6.5 times more likely to remember visual information than text. These are incredibly important facts when you are trying to communicate data to others. Use data visualizations to help your audience understand your information, and remember it later when it could influence their decisions or behavior. - Randy Krum

Data visualization is a language of context. You dramatically improve comprehension of your data when you design a visualization that puts your data into context for the audience. This can be a series of data points over time, or comparing your data to reference data to give the audience the perspective of how your data fits into a bigger picture. Storytelling with data is more than designing a chart, it’s the art of communicating specific insights from your data. - Randy Krum

Are you doing everything you could with your data? The future of data, along with predictive analytics and data visualization, is very exciting! Grab the free ebook now!

23 Reasons to Get Excited About Data IBM eBook Randy Krum Quote

Wednesday
Jun252014

Who's Stealing eBooks?

Who's Stealing eBooks? infographic

Who’s Stealing eBooks? infographic from Who is Hosting This? looks at some of the data and opinions from experts about ebook piracy.  

Production and sales of eBooks increased rapidly in the last decade. Indie authors may have led the way, but bestsellers (and their publishers) soon joined the eBook revolution. Publishers begot lawyers;  copyrights, DRM, and royalties soon followed.

Who’s stealing eBooks, and who is paying?

What’s the future for digital rights management, and how does this affect publishers and authors? Our research into eBook piracy found some interesting statistics illustrated in the graphic.

With the release of the Cool Infographics book, I now have a personal reason to take this topic much more seriously.  As an author, of course I want as many readers as possible to be exposed to the book, but I also invested over a thousand hours writing the book and had to pass up paying design projects to get it done.