About
Randy Krum
President of InfoNewt.
Data Visualization and Infographic Design

Infographic Design

Infographics Design | Presentations
Consulting | Data Visualizations

DFW DataViz Meetup

Join the DFW Data Visualization and Infographics Meetup Group if you're in the Dallas/Fort Worth area!

Search the Cool Infographics site

Custom Search

Subscriptions:


Feedburner

The Cool Infographics® Gallery:

How to add the
Cool Infographics button to your:

Cool Infographics iOS icon

- iPhone
- iPad
- iPod Touch


Read on Flipboard for iPad and iPhone

Featured in the Tech & Science category

Flipboard icon

Twitter Feed
From the Bookstore

Caffeine Poster

The Caffeine Poster infographic

Entries in search (22)

Wednesday
Feb212018

16 SEO Myths You Should Ignore Completely

16 SEO Myths You Should Ignore Completely infographic

SEO or Search Engine Optimization can be a tricky subject. The 16 SEO Myths You Should Ignore Completely infographic from My Biz Niche gives some clarity to some popular misconceptions.

From the very beginning, the world of SEO has been rife with myths that have somehow managed to pass themselves off as facts and fool a whole generation of webmasters and even SEO practitioners. After proving itself indispensable in increasing traffic and achieving prime rankings in the SERPs, SEO should be free of these myths by now. But several Google algorithm updates have passed, and these myths still stand and continue to mess with the heads of webmasters and SEO practitioners alike.

This is a very text-heavy topic and design. There's no data to visualize, but the descriptions are short, and easy to understand. If readers want more information, that's available on the website.

Found on Rocks Digital!

Wednesday
Sep242014

How To Be a Google Power User

How To Be a Google Power User infographic

Sometimes, no matter how you word your question, Google’s search engine’s results will not come up with what you are looking for. How To Be a Google Power User infographic from Who is Hosting This? tackles the Google search engine problem with a few tips and tricks to help you find the answers to the questions you are seeking.

It’s a familiar frustration for most of us: You type your precise, specific search terms into Google, and expect to find what you need on the first page.

Instead, you’re faced with millions of search results, and the first few links are so off-the-wall unrelated you wonder if you mistyped something.

But your search terms are correct, so why doesn’t Google know what you’re looking for? And how are you supposed to narrow down the millions of irrelevant results?

Luckily, Google has quite a few hidden tips and tricks for searching that will help you quickly find exactly the results you’re looking for.

Just by learning a few formatting and punctuation tricks, you can tell Google how your search terms are related, or exclude certain words or phrases. You can also narrow down your search with criteria like location or pricing, or use Google to search within a single website.

If you’re still not getting the results you need, Google has several other little-known features that can widen your search. Webmasters can easily find images for their websites and blogs with Google Images, and researchers need only visit Google Books or Google Scholar to search through print publications and research papers in any field.

Faster and more accurate searches aren’t the only benefit to becoming a Google power user. Google also has a few hidden functions you can unlock with the right search query, including calculations and conversions, stock quotes and sports scores, and film showings and flight statuses. With the right search, you can get immediate results telling you the current weather and today’s sunrise and sunset times, or quickly look up the definition of a word and get a translation into one of dozens of available languages.

With the time you save as a Google power user, you’ll even be able to fit in a game of Atari Breakout on Google Images. Just follow the steps int he infographic to find out how!

This is a great instructional, how-to infographic design. It’s informative, without making any kind of hard sales pitch for a companies products or services, and that usually leads to more sharing activity.  It would help to have the URL to the original infographic landing page in the footer.

The color scheme is spot-on with Google as the topic, and the sections are easy for readers to follow with minimal text. For example, the design shows you how to use the Search Operators using an example without a lengthy text explanation.

Found on Digital Information World and State of Digital

Tuesday
Dec172013

Robots Rule the Internet

Bot Traffic Report 2013 infographic

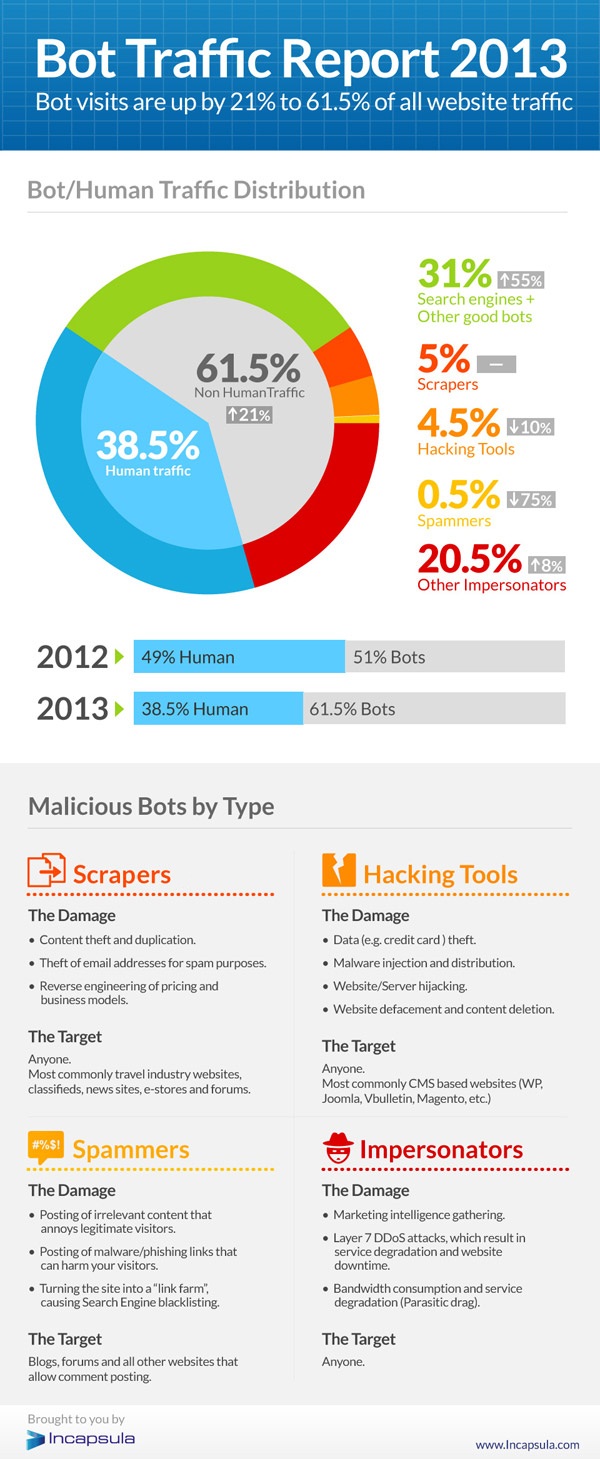
The Bot Traffic Report 2013 from Incapsula clearly shows that robots already rule the world…I mean the Internet.  Humans are now just a minority of the traffic online.

We see a 21% growth in total bot traffic, which now represents 61.5% of website visitors. The bulk of that growth is attributed to increased visits by good bots (i.e., certified agents of legitimate software, such as search engines) whose presence increased from 20% to 31% in 2013.

31% of Bots Are Still Malicious, but with Much Fewer Spammers

While the relative percentage of malicious bots remains unchanged, there is a noticeable reduction in Spam Bot activity, which decreased from 2% in 2012 to 0.5% in 2013. The most plausible explanation for this steep decrease is Google’s anti-spam campaign, which includes the recent Penguin 2.0 and 2.1 updates.

Nice infographic with a focus on telling one story really well.

Thanks to Jordan for posting on Google+


Monday
Dec092013

Google’s 200 Ranking Factors

Google’s 200 Ranking Factors infographic

Google’s 200 Ranking Factors is a very detailed list of the known 200 aspects that Google considers in their ranking formulas.  The overall length of the infographic is the major visual feature that catches your attention, and communicates a clear message about Google’s immensely complicated algorithm and how difficult SEO can be.  The second level of of the design is the actual details about each and every one of those ranking factors that the audience can read if they want specific information.

Google has confirmed that they use approximately 200 ranking signals in their algorithm. However, they’ve never publicly listed them all. While this infographic is by no means official, it aggregates the best information we have about how Google ranks pages and websites.

The infographic was published on Entrepreneur.com, designed by Single Grain and based on information collected and published by Backlinko.

Found on Holy Kaw! and Search Engine Journal

Wednesday
Oct022013

Measuring Google AdWords Conversions

Measuring AdWords Conversions in a Multi-Screen World infographic

Google AdWords released some fantastic stats about cross-device conversions on their Inside AdWords blog, and included the infographic Measuring AdWords Conversions in a Multi-Screen World to help communicate some of the information.

Estimated cross-device conversions will begin rolling out globally to all AdWords advertisers starting today and continuing over the next few weeks. To see these new statistics, you’ll need AdWords conversion tracking and a sufficient volume of conversions on which to base a reliable estimate.

In the last few months, we’ve analyzed data across thousands of AdWords advertisers to learn more about cross-device conversion patterns.

More results from other verticals can be seen below.

The visual diagram helps readers understand the information by narrowing down the scope of the data; clearly identifying it as only a portion of the Estimated Total Conversions.   However, they made one of the biggest design mistakes.  Big fonts are not data visualizations!   Making the percentage numbers big doesn’t put these values into context for the readers and doesn’t make the data any easier to understand.

Found on the D/FW SEM Facebook feed.

Thursday
Mar142013

A Delicious Pie Chart for Pi Day!

A Delicious Pie Chart for Pi Day infographic

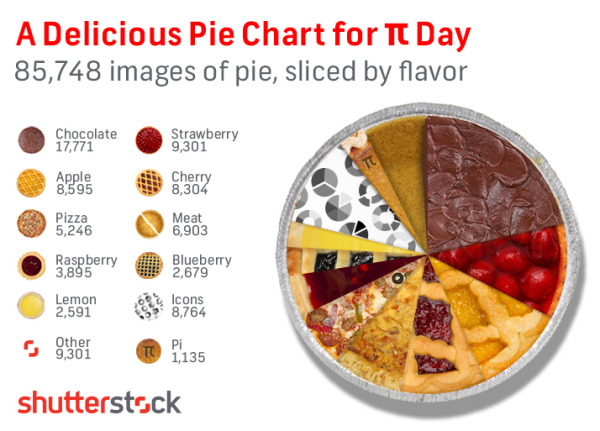
A fun little Pie Chart for Pi Day from the team at Shutterstock that looks at the search results from their own image library.

In honor of Pi Day (3/14) we took a dive into our library to suss out some Pie Knowledge, and ended up with the above appetizing infographic revealing the flavor breakdown of the 85,748 “pie” search results from our library. Yes, we know that “Pi” equals 3.14159… and not “Pie,” but we couldn’t resist the delicious comparison. Any way you slice it, this is some tasty data, and our mouths water for data here at Shutterstock.

Now I’m hungry…

Thanks to Danny for sending in the link!

Monday
Jan142013

SEO & Infographics - an Interview with Eric Enge

Eric Enge, Author and SEO GuruRecently, I had an amazing opportunity to interview Eric Enge about SEO & Infographics.  Eric has incredible insight in the world of SEO as a consultant, author, speaker and entrepreneur.

Eric Enge is the CEO of Stone Temple Consulting, a consulting company that provides a full range of Internet marketing optimization services including: strategic business planning, on page search engine optimization, link building, content optimization, conversion optimization, social media optimization, user engagement, and pay-per-click campaign development and optimization. Eric is co-author of the book The Art of SEO, a speaker at numerous search marketing events, and a contributing author to Search Engine LandSearch Engine Watch, and SEOmoz

 The interview covers some of the hottest topics that impact the infographics design industry today:

  • Infographics as part of a content marketing strategy
  • How Google’s changes to their algorithm impacts infographics
  • Infographics relevance and accuracy
  • Using attribution links, anchor text and embed code for infographics
  • Infographics on Pinterest 

You can read the complete interview on the InfoNewt blog

Friday
Jun292012

The Massive Challenge of Search Engine Complexity

Search Engine Complexity Infographic
Courtesy Stone Temple Consulting

The complexity of generating Search results online is HUGE.  The What’s So Hard About Search? infographic from SEO expert Eric Enge at Stone Temple Consulting takes a look at the massive numbers involved with indexing and searching the Web.

Building a search engine is a very complex task. I often find myself trying to justify to people why it is that search engines can’t understand their site. They seem fixated on believing that a search engine should understand it if a human can understand it. The short answer is that with an infinite amount of time the search engine could, but the scale of the Internet makes it oh so VERY hard.

The infographic below tries to give you some sense of the scale of the problem. Please note that a few numbers are hard to truly pin down, but I pulled them from the best sources I could. For example, no one really knows how many pages there are on the web, though Majestic SEO is aware of 3.7 trillion (the number I used) or the average web page size.

Regardless, the message is the same either way. The web is a really complex place!

Designed by InfoNewt, the design gathers data from a number of different sources to put together the picture of complexity.  Combining the number of web pages, the average number of links on each web page, the amount of data online and the number of searches every minute, you begin to understand the scale of the challenge search engines face.

This design takes a different approach by citing each data source along with it’s visualization instead of gathering them all at the bottom.  I think it works well with this many different data sources, and is easier for the readers to understand where each part of the data comes from.  All of the key elements are included at the bottom: copyright, brand logo and the URL to the infographic landing page so readers can always find the original (even when blogs repost it without linking or using the embed code).

I just have to say “Cheers!” to the developer teams that tackle this problem every day.  The scope of this challenge will only get bigger in the future!

Thanks to Eric and the team at Stone Temple for being great to work with!

Tuesday
May032011

Demand Media - Breaking the Bank

Demand Media - Breaking the Bank is a cool infographic published on OnlineMBA.com by designer Ricky Linn.

The content itself in interesting, and I remember reading the Wired article listed in the sources.  I like that the infographic combines the process flow of content creation, but also visualizes relevant statistics about how big and profitable Demand Media has become.  Overall it tells a good story.

Found on SiliconValleyWatcher.

Friday
Nov122010

The Brutal Decline of Yahoo!

Here’s a fun one from Scores.org The Brutal Decline of Yahoo! examines the troubled history of Yahoo! in search, advertising and acquisitions.

Designed by our friend, Jess Bachman, this one relies heavily on visuals related to the events on the timeline over the last 16 years.  A little text heavy for my tastes, but I had forgotten at least half of this stuff that Yahoo! messed up.  It’s a little amazing that they’re still as big as they are.