About
Randy Krum
President of InfoNewt.
Data Visualization and Infographic Design

Infographic Design

Infographics Design | Presentations
Consulting | Data Visualizations

DFW DataViz Meetup

Join the DFW Data Visualization and Infographics Meetup Group if you're in the Dallas/Fort Worth area!

Search the Cool Infographics site

Custom Search

Subscriptions:


Feedburner

The Cool Infographics® Gallery:

How to add the
Cool Infographics button to your:

Cool Infographics iOS icon

- iPhone
- iPad
- iPod Touch


Read on Flipboard for iPad and iPhone

Featured in the Tech & Science category

Flipboard icon

Twitter Feed
From the Bookstore

Caffeine Poster

The Caffeine Poster infographic

Entries in starship (15)

Monday
Feb092015

The Massive SciFi Starship Size Comparison Chart

The Final SciFi Starship Spaceship Size Comparison Chart infographic

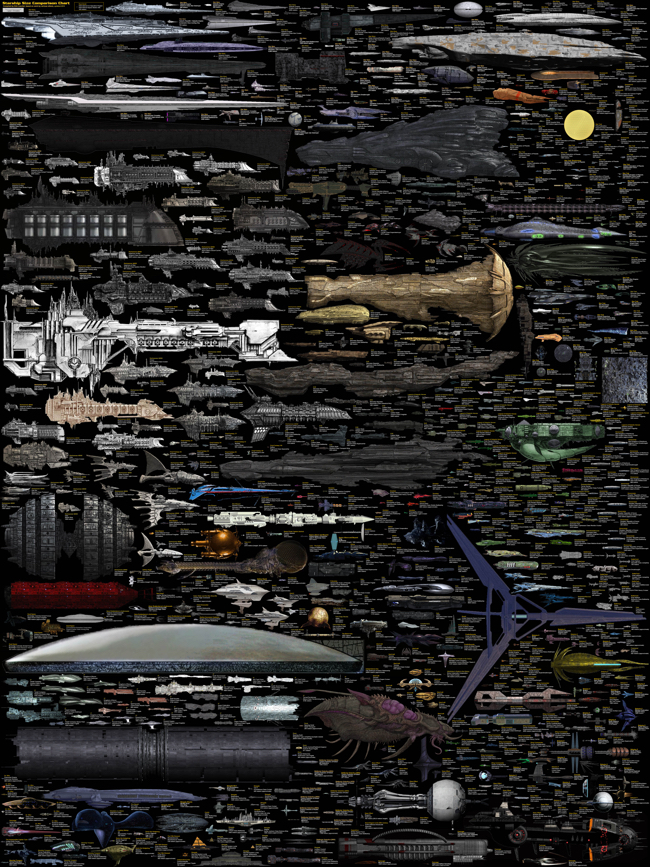
The massive SciFi Starship Size Comparison Chart is one of my favorite infographic design projects. Designed by Dirk Loechel and shared on DeviantArt, this is a project he has been working on for years. I posted an earlier version of his design in 2013 here which was hugely popular. Dirk’s notes claim that this may be the last update.

The last update

For real this time: This is the final major content update, though if there are issues I’ll still fix them. I also haven’t forgotten I wanted to vectorize the writing. It’s still on the radar. But content-wise, I think that is about all I can put in. 

Also, I added the ISS. For scale. It’s on top, with a yellow frame so it’s relatively easy to find.

Lots of errors fixed, lots of new ships too. Well, off for now, but I’ll be replying in the comments more or less regularily. 

This is probably at least for the forseseeable future the last round of adding ships. I have pretty much all I wanted now (excepting some old scifi, and many Anime series, which tend to not have many usable images). Lots of new content.

And that’s it for now. Enjoy the new-and-improved chart! 

This is one of the visual designs that clearly demonstrates why visuals can be much more effective than text descriptions. Especially when it comes to comparing size and scale. You just don’t comprehend the scope when someone tells you that the Star Wars Executor Class Super Star Destroyer is 19,000 meters long. You have to see it in comparison to something you already know.

The images on DeviantArt are high enough in resolution, that you can download and print it out as a poster yourself to hang on your wall. The full-size poster resolution is 4,268 x 5,690 pixels. Most of the ships are clustered by franchise (Star Wars, Star Trek, Halo, Eve, Warhammer, etc.). As a reality check, the International Space Station (ISS) is included for reference.

Found on Geyser of Awesome, Nerd Approved and Nerdist

Friday
Sep272013

SciFi Starship Comparison Chart

SciFi Starship Comparison Chart infographic

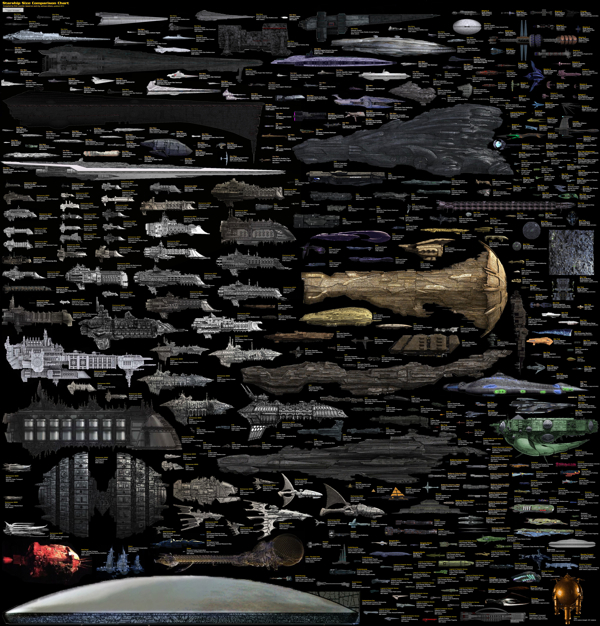
This is a massive Starship Size Comparison Chart, created by designer Dirk Loechel and posted on DeviantArt.

The design gathers ships from many different science fiction movies, tv shows and games, and sizes them down to a common scale so viewers can grasp the relative size of how large and small the ships they recognize are.

As this get shared heavily online, it would be nice to have the URL back to the original, full-size version included in the design.

I love this size comparison design!  The subtitle mentions that Dirk's design is "based on the work of others"  A much smaller Starship Size Comparison Chart was one of the first posts on Cool Infographics back in July of 2007, and that version is no longer available online.

Thanks to Mary Kaye for sending me the link!

Friday
Feb192010

NASA's New Budget [infographic]

GOOD has a good timeline of NASA’s budget over the last 50 years.

The Obama administration announced a new budget for NASA, which despite a nominal increase, cuts future programs and the prospect of more space exploration. This is a look at NASA’s budget over time, and the major missions it accomplished with that budget.

A collaboration between GOOD and 
Karlssonwilker.

Although, since the timeline wraps like text to keep it on one page, I think the bars that represent the different programs should stay in the same order.  And what’s with the flashing images when you view the large infographic?

Tuesday
Feb022010

Big Brothers: Satellites Orbiting Earth

Michael Paukner has created a great infographic, Big Brothers: Satellites Orbiting Earth.  Visually showing which countries own all of the space junk currently orbiting Earth (functional, dysfunctional and floating debris).  We apparently have Saturn-envy as we attempt to create rings around our planet.

You’ve got to feel bad for countries like Chile, who used to have a single working satellite in orbit, but the warranty ran out and it doesn’t function anymore.

View the high-resolution image on Flickr.

Tuesday
Oct132009

50 Years of Space Exploration - Visual Flight Map


National Geographic published this amazing flight map that shows the flight paths of all 200 space missions in the last 50 years.  A zoomable map is on the NG website, and a high-res image is available from Adam Crowe on Flickr.

Art by Sean McNaughton, National Geographic Staff, Samuel Velasco, 5W Infographics.

Found on Fast Company.

Tuesday
Feb242009

Space Debris video


Sticking with the Space Debris theme, the ESA (European Space Agency) has this hi-res video on their website showing how crowded Earth orbit has become from 1968-2000.  Same issue as the image yesterday, that the objects are not to scale.  At this scale you would expect constant collisions, but at actual scale you wouldn't be able to see any objects at all.
In this animation, catalogued space debris are shown accumulating around Earth in 4-year increments, including payloads, rocket bodies, and fragments. While the debris objects are not shown to scale, the representation of their density is accurate.

Monday
Feb232009

Space Debris image


Great image from MSNBC PhotoBlog that tries to demonstrate how much space junk we have put into orbit around Earth.  I think the downside of this image is that the satellites aren't to scale.  If they were all this large, they would be running into each other all the time.

If you have Windows, you can see this high-res version with Microsoft HDView, but it doesn't work on a Mac.  I was able to see it with Parallels running on my MacBook.

A computer-generated artist's impression released by the European Space Agency (ESA) depicts an approximation of 12,000 objects in orbit around the Earth. A communications satellite belonging to US company Iridium collided with a defunct Russian military satellite on February 12, 2009.  (ESA via AFP - Getty Images/)
Thanks Karen for sending in the link!

Monday
Dec012008

Voyager Infographic video


Voyager from Jaime Arvizu on Vimeo.

Jaime Arvizu, a student at the Vancouver Film School, sent me a link to this infographic video that he and his team mates (Tyler Lemermeyer and Leo Aguiar) created for their Motion Design class.  You can find a high resolution version at Jaime's blog.

Thanks for sending this in Jaime, I love it!

Saturday
Nov292008

How Star Wars Changed the World


The original Star Wars has certainly gone on to produce more than just sequels.  It has created the people and the technologies that are now considered the best in the industry.  Michelle Devereaux created this family tree for Wired magazine back in 2005 and I love how the line colors indicate people, technologies and company connections, but the tree is organized into movies, sound, effects and technologies.

I actually believe the tree is incomplete.  I think Star Wars had far greater reach and influence that what Michelle mapped out here.

It all started with a band of rebels who wanted to help a farmboy follow his dream.  Three decades later, the Star Wars empire has grown into one of the most fertile incubators of talent in the worlds of movies (Lucasfilm), visual effects (Industrial Light & Magic), sound (Skywalker Sound), and videogames (LucasArts).  Along the way, some of the original Lucas crew has gone on to become his biggest competitors.  This chart maps the people, companies and technologies touched by the Force. - Michelle Devereaux
Thanks Alwyn!

Wednesday
Jul302008

Bio-Suit EVA Infographic Poster

From the Man Vehicle Lab at MIT, an infographic poster from professor Dava Newman and illustrator Cam Brensinger.  The poster shows the technology development in spacesuits and some future design concepts.