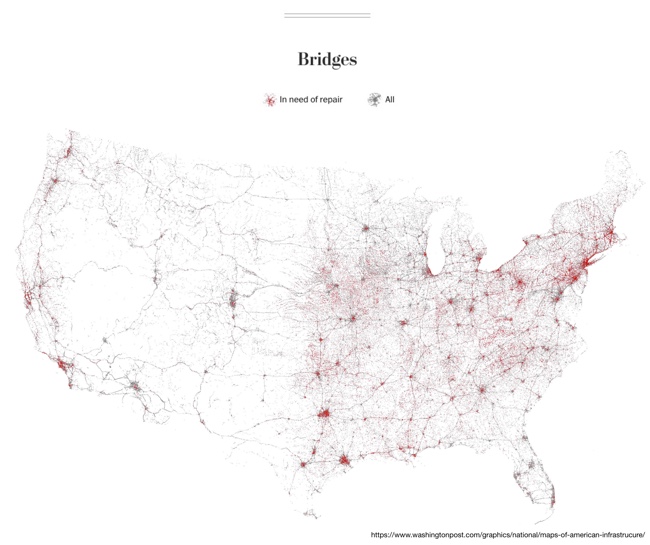
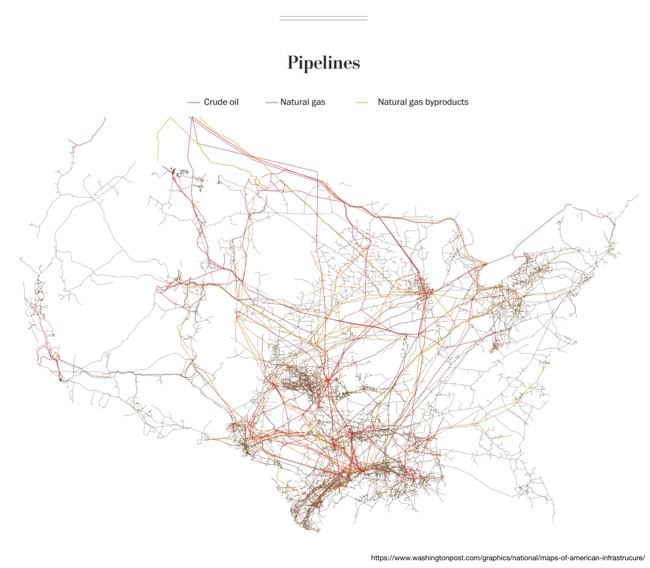
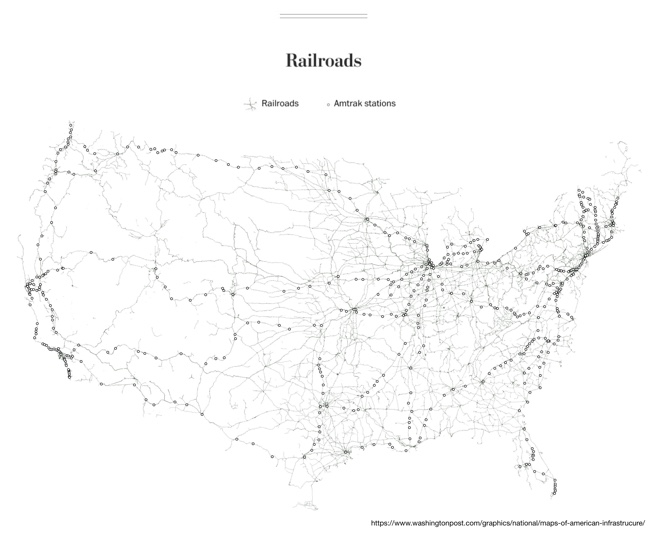
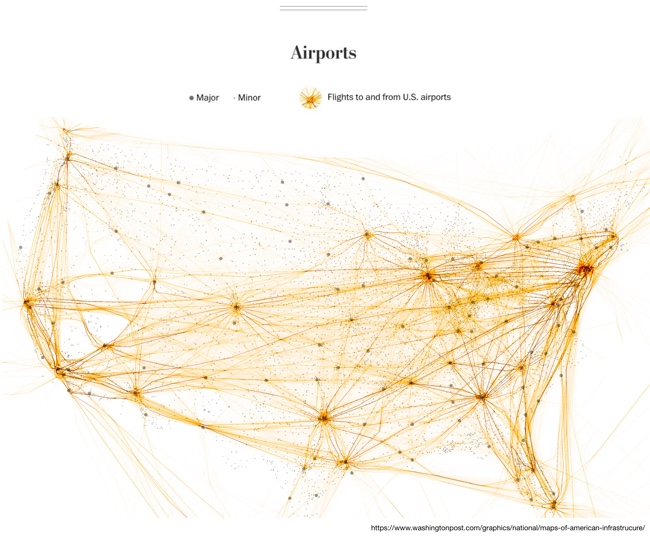
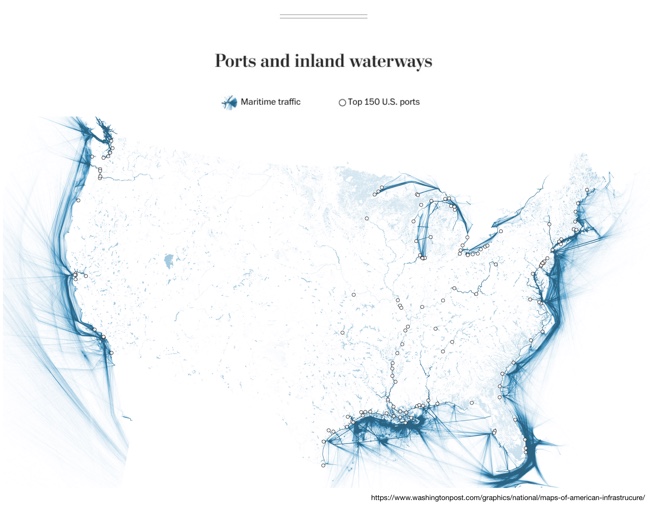
Tim Meko, a graphic reported at the Washington Post, designs some fantastic data visualizations. Six Maps that Show the Anatomy of America’s Vast Infrastructure is a great visual exploration of what makes America run. Check out the original article for more explanation of each map and more visual details.
Winter Storm Jonas hit the East coast of the U.S. last weekend, and dropped an estimated 6.6 trillion cubic feet of snow, with 2.7 billion cubic feet on the nation's capital alone. (Data estimated by Ryan Maue, a digital meteorologist for Models Weatherbell) Javier Zarracina at Vox Media visualized that immense amount of snow as the Snowzilla Snowball.
These are absurd numbers, too big to really comprehend. To make them more understandable, I used a 3D modeling program to show what all that snow would look like in one snowball.
I started with just Washington's snowfall — this is what it looks like compared with the US Capitol building.
The results get even more mind-boggling when you look at all the snow that fell across the United States over this past weekend.
As a general rule, I don't like 3D visualizations. However, I like this use of 3D modeling to visualize the volume of the sphere of snow. It gives the real-world perspective of space and size.
The Never BUI (Boating Under the Influence) infographic helps share some of the grim statistics about the boating deaths caused by alcohol. This is a perfect topic for an infographic by Boat Ed, a source for Official Boater Safety Courses and Boat Safety Education Materials.
Before the thought of drinking on a boat crosses your mind, consider the physical and legal consequences of boating under the influence of alcohol. Not only is operating a boat while intoxicated illegal in all 50 states, it’s also dangerous and can have deadly consequences.
Alcohol use is the leading known contributing factor in fatal boating accidents; where the primary cause was known, it was listed as the leading factor in 21% of deaths. Safe boating means never boating under the influence (BUI).
Safe boating means sober boating. While it may be tempting to crack open a can of beer while cruising, keep in mind that your record, license, and life may be at stake!
I really like this design. Simple, clean design that focuses on telling one story really well. Easy to read. Easy to Understand the data. Easy to share.
Now that a 100-foot wave has been surfed, the bar has been raised yet again for somebody to step up and set a new record. Until then, we take a look at some other feats of record height to get a better perspective on just how big the biggest waves ever surfed really were.
Clear design that tells one story really well. The visual comparison to the Statue of Liberty is instantly recognizable to readers.
Water in the Anthropocene is a very cool infographic video looking at the different ways we humans are changing the global water cycle.
Water in the Anthropocene is a 3-minute film charting the global impact of humans on the water cycle.
Evidence is growing that our global footprint is now so significant we have driven Earth into a new geological epoch — the Anthropocene.
Human activities such as damming and agriculture are changing the global water cycle in significant ways.
The data visualisation was commissioned by the Global Water Systems Project for a major international conference (Water in the Anthropocene, Bonn, Germany, 21-24 May, 2013). conference2013.gwsp.org
The film is part of the first website on the concept of humans as a geological force, anthropocene.info
The USA is lucky to be in the top 5 countries that have annual renewable water resources. Because of this, we are very wasteful. This is considered to be “Water Rich”. For the countires that are considered Water Poor, they do not have the wasteful luxury, in fact 88% of fatal cases are due to inadequate water access. The Water Rich vs Water Poor infographic by seametrics.com tells the story of both water rich countries and water poor countries.
While some might say gold or diamonds, as far as human life goes, water is the world’s most precious commodity. As the world population increases, and industry continues to expand, Earth’s freshwater reserves are being stretched dangerously thin. See the disparity in water consumption between wealthy and underdeveloped nations.
This is a good side-by-side comparison design, that has a lot of information. Maybe too much information, because it can be overwhelming to readers.
Thanks to Ngoc for sending in the link!
Side note: There are only 5 DAYS LEFT to participate in the Cool Infographics Start 2013 Clean charity drive! If you are able, please visit our campaign on Charity:Water and donate to the cause of providing clear, drinkable water to everyone that needs it.
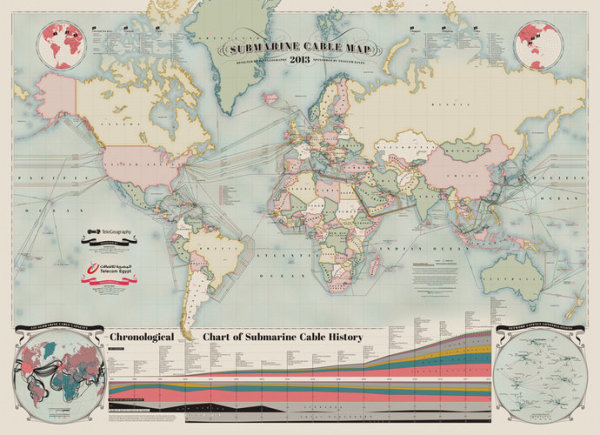
A beautiful map of the World’s undersea Internet cables, The Submarine Cable Map 2013. Brought to us be TeleGeography, sponsored by Telecom Egypt and design credit is listed as Nick Browning, Markus Krisetya, Larry Lairson, Alan Mauldin.
Cables depicted include all active international and U.S. domestic cables. In-service cables have an announced Ready for Service (RFS) date by December 31, 2012. Planned cables include those actively under construction and those that have announced they were fully funded as of year-end 2012. Map does not depict proposed cables that have not announced landings or configuration. Cable routes are stylized and do not reflect physical cable location.
I love the hand-drawn design style, meant to pay homage to old maps, but overlaid with very current information. This is also available for purchase as a poster 36” x 50” for $250.
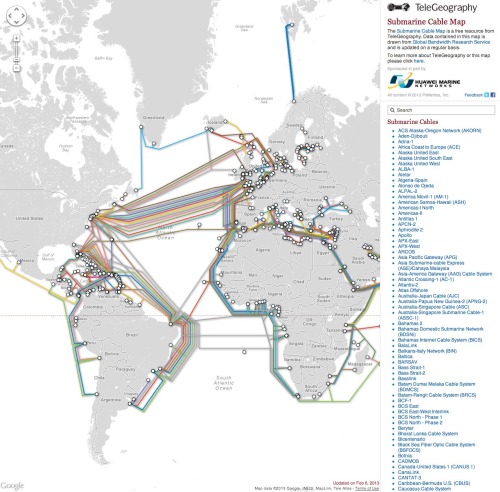
An interactive website with more information about all of the cables is also run by TeleGeography and can be found at submarinecablemap.com
I have heard it argued that clean water has been the single greatest medical advancement in mankind’s history. With effects including longer lifespan, reducing diseases, reducing birth defects and generally improving health, it’s easy to undertand how important clean water is. Water Changes Everything is an infographic promotional for the Charity Water organization.
I’ve started the “Start 2013 Clean” campaign to raise $1,000 for Charity Water from Cool Infographics readers. Start off 2013 right, and help me support making the world a better place.
Almost a billion people live without clean drinking water. We call this the water crisis. It’s a crisis because it only starts with water — but water affects everything in life.
Health. Education. Food security. And the lives of women and children, especially.
We can end the water crisis in our lifetime. But first we have to let everyone know it’s happening. Learn how water changes everything — and share this with everyone you know.
It was an infographic map design by John Snow in 1854 that led to the discovery that a cholera outbreak in Soho, London was geographically tied to the location of a water well. At the time, the popular belief was that cholera was airborne, and people would become sick by breathing “bad air.” But John Snow’s early data visualization of reported cases was used to convince local officals to shut down the potentially contaminated well (by removing the handle). This action is commonly credited with ending the epidemic.
Original map made by John Snow in 1854. Cholera cases are highlighted in black.
Video was designed by Jonathan Jarvis, who also designed the Crisis of Credit infographic video, and the voiceover is Kristen Bell.
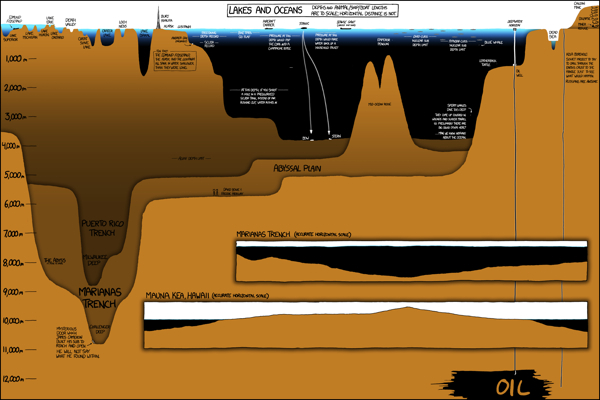
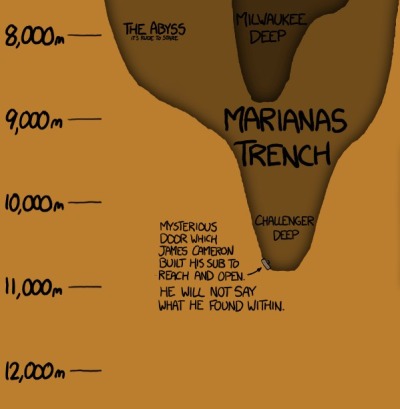
Another great infographic from Randall Munroe’s xkcd online comic. Lakes & Oceans visualizes the various depths of the worlds water, and even includes…a mysterious door that James Cameron built his deep-sea submersible to reach at the bottom of the Marianas Trench and open?
Unlocking the Mystery of Humpback Whales is a cool new infographic from MauiWhaleWatchTours.com that shows the reader a handful of easy-to-understand facts about the humpback whales. The design is clear and stays focused on a narrow topic. Very informative design.
The Humpback Whale infographic above was built to show some of the annual migration routes across the globe, the most common surface behaviors and the least common (in our experience), names of anatomical parts of a humpback whale, length and weight of a typical humpback whale, tips on whale watching, and some mysteries that have yet to be solved. We hope you like it! ALOHA!


 Randy
Randy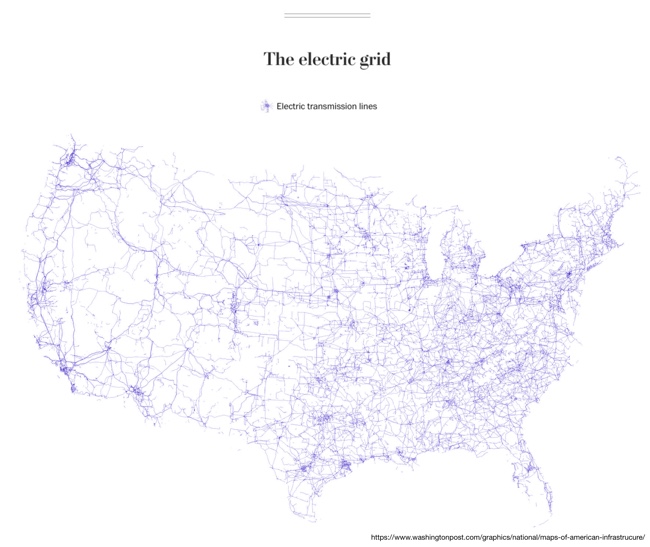

/cdn0.vox-cdn.com/uploads/chorus_asset/file/5938139/Snowzilla_DC1.0.jpg)
/cdn0.vox-cdn.com/uploads/chorus_asset/file/5938277/Snowzilla_US2.0.jpg)