About
Randy Krum
President of InfoNewt.
Data Visualization and Infographic Design

Infographic Design

Infographics Design | Presentations
Consulting | Data Visualizations

DFW DataViz Meetup

Join the DFW Data Visualization and Infographics Meetup Group if you're in the Dallas/Fort Worth area!

Search the Cool Infographics site

Custom Search

Subscriptions:


Feedburner

The Cool Infographics® Gallery:

How to add the
Cool Infographics button to your:

Cool Infographics iOS icon

- iPhone
- iPad
- iPod Touch


Read on Flipboard for iPad and iPhone

Featured in the Tech & Science category

Flipboard icon

Twitter Feed
From the Bookstore

Caffeine Poster

The Caffeine Poster infographic

Entries in employment (11)

Tuesday
May102016

What's Your Ideal Workplace?

What's Your Ideal Workplace? infographic

Based on your own individual personality, the What's Your Ideal Workplace? infographic from Quill.com examines the best types of office environments to maximize your work performance.

Are you looking for a new position in a more fitting workplace? Or are you attempting to create an office setup that will maximize your employees’ skills? This infographic will help you match common work personality types with their ideal office spaces, from cubicles and open workspaces to co-working and work from home options.

Don’t know your work personality? Take the test.

Many companies are just beginning to realize that workplace design directly impacts employee performance, yet research shows that 3 in 4 U.S. workers are not in optimal workplace environments.

I love the connection to taking your own work personality test. This makes the infographic design personal and relevant to each individual reader. It's informative, but personal.

The illustration of each different workplace layout helps readers understand the differences almost instantly. It's a design with conceptual illustrations, but the statistics are also visualized, making them easier to understand as well. The personality color-coding is consistent throughout the design.

Great layout on the infographic landing page as well. Descriptive text with links, social sharing buttons, the full infographic and embed code at the bottom. The URL of the landing page is also included in the infographic image file itself, to make it easy to find the original, full-size version from sites that share but don't link. Everything needed to make it easy to find and easy to share.

Thanks to Cheryl for sharing the link!

Thursday
Apr022015

The True Cost of a Bad Hire

The True Cost of a Bad Hire infographic

The True Cost of a Bad Hire infographic from Executives Online in the UK puts into perspective the £4.13 billion a year that UK businesses are losing from a bad hire. With one £50 note being less than 1 mm thick, the stack would reach about 933 meters tall. London’s Big Ben is 96 meters tall.

People are a businesses most valuable resource. Actively finding and attracting top talent is a never-ending task for any company that aspires to be the best.

The amount of new hires that don’t work out is frightening – in fact a study by leadership IQ across a range of industries and job roles found that up to 48% of new hires fail within 18 months. It’s a problem that’s estimated to cost UK businesses over £4 billion a year.

So What’s The True Cost When One Of These New Hires Doesn’t Work Out? 

Outside of the obvious salary cost, there are a significant number of tangible and intangible factors that can drive the cost of a failed hire much higher than initially estimated. 

We used an example of a £100k per annum executive to answer one question: “What’s the true cost of a bad executive hire?” We factored in salary, benefits, the cost of the recruitment and sourcing process, and the knock on effects of having a poor performing individual in a role for up to a year.

Using data from a range of external sources and our own databases we arrived at a final figure showing this cost to be around three and a half times more than a year’s salary. To demonstrate the scale of this cost we laid it all out in a infographic as well as breaking down how that cost was arrived at.

So Why Do Bad Hires Happen?

Part of this failure to make successful hires is down to company policies focussing on hiring cost rather than ROI.

As Steve Jobs put it: “A small team of A+ players can run circles around a giant team of B and C payers… I’ve noticed that the dynamic range between what an average person could accomplish and what the best person could accomplish was 50 or 100 to 1”.

Next time you’re making an executive hire, remember what it will cost if it doesn’t work out! 

It’s a long/tall infographic design, but I think that the length is actually part of the visual story in this case.

Visually, the grids would be easier for readers to understand if the rows were 10 icons across instead of 20. We live in a Base-10 society. Rows of only 10 would make the infographic twice as long, but an alternative would be to add some spacing to visually separate the left 10 from the right 10. Same thought for vertical spacing. It would help to have a gap in the icon grids every 10 rows.

The confusing part is that every icon is a £50 note, so with 20 icons, each row represents an even £1,000. That’s why I think they designed the rows to be 20 icons across.

Odd that they published the infographic as a transparent PNG file.

Thanks to Alex for sending in the link!

Friday
Feb272015

Overtime Pay Laws

Call Center Employee Overtime Pay Laws infographic

The Call Center Employee Overtime Pay Laws infographic from overtimepaylaws.org is in informative design can help both employees and employers understand the rules when it comes to paying overtime.

Call centers employ thousands of workers throughout the United States. Many call center employees are required to perform tasks before a shift and after a shift that are not considered “on the clock” by their employer, such as booting up a computer or loading dialing software. This additional time spent on these tasks can give rise to an overtime pay lawsuit brought under the Fair Labor Standards Act. Our Call Center Overtime Pay Infographic Explains the important issues in these cases.

This design follows a simple story format with only a few steps:

  1. What’s the Problem?
  2. What’s the Impact?
  3. What can the Reader do?

 I love that this design simplifies the information, and doesn’t try to include too much detail.

Thursday
Apr102014

3 Common Time Wasters at Work

3 Common Time Wasters at Work infographic

Do you feel like your employees are slacking? The 3 Common Time Wasters at Work infographic from Biz 3.0 points out the time wasting problems so that you can target them and create a more efficient work day.

No business can afford to have wasted time at work, especially when growth and profitability is directly tied to how productive your employees are. So check out our new infographic that identifies the top three reasons why people waste their time at work, so that you can find possible solutions to eliminating them. 

Great data with fun illustrations that engage the audience.  Great topic for a productivity software company.  The design is informative and will appeal to a broad audience, while being directly related to their product.

However, with all of the number values shown in circles, very few of them are visualized.  For the percentages, the circles could at least have been doughnut charts coloring only the appropriate portion of the circumference.  A good infographic design is supposed to make the data meaningful and relevant to the audience.  This helps them better understand the data, and you have to visualize the information to make that work.

Thanks to John for sending in the link!

Friday
Apr042014

44 Simple Daily Activities To Enjoy Your Work

44 Simple Daily Activities To Enjoy Your WOrk infographic

Here are 44 Simple Daily Activities To Enjoy Your Work created by OfficeVibe to help keep the motivation high and add some fun back in your work day!

You might think it’s a truism, but most people tend to forget this crucial fact:

You should always make the effort to build good habits that will make you healthier, happier, and more productive over time.

Also, when it comes to new habits, it’s important to remember that these are things to do for long term changes.

This infographic will give you an overview of 44 habits to improve your productivity, your health and the overall quality of your workdays.

A fun infographic for Friday!  There is some fantastic information included in here.  The topic choice will also have a long Online Lifespan, and has the potential to be relevant to readers for years.

The design is visually very busy.  I understand the color-coding of the different activities, and those should be the visual highlight.  The illustrations in the background should be less “noisy” with simpler illustrations and fewer colors.  I might even consider making the background illustrations grayscale to make the 44 activities stand out even more.

The font choices in the text boxes seems too small, and clicking the image on the infographic landing page doesn’t open up a larger version.  I think this was done to allow more of the background illustration to be visible, even though that shouldn’t be the focus of the design.  The designer didn’t want all of their background illustration work to be covered up by the important information?  This also made the great activity icons too small to understand.

The point scores for each activity were intended to add the element of gamifying these activities, but that gets lost in the overall design.  There aren’t any score total categories, so there’s no benefit to the readers from adding up their scores.

The additional text on the infographic landing page is a little out of control.  Every one of the 44 activities has a few paragraphs of text on the page providing more details.  WAY more information that readers will stick around for, but thankfully they kept that separate from the infographic design.  

The infographic should include the URL to the landing page so readers can find this additional information about the activities as well as the original, full-size version of the infographic.  They include the URL to the OfficeVibe home page, but there are no links to the infographic there.

Thanks to @JacobShirar on Twitter for sending in the link!

Monday
Oct142013

The Modern Workforce

The Modern Workforce infographic

The Modern Workforce infographic from unum shows that the workforce demographic has changed in the last 30 years, but the benefits have not evolved to support this. There are more women, disabled, and older people in the modern workforce, but the protection, time away from work, and services given to employees are not keeping up.

The research finds significant gaps have opened up between employer-provided benefits and the protection required by today’s workforce. At a time when the demographics of the modern workforce are shifting towards employees that have a greater need for financial benefits, the research shows that the ratio of wages to employee benefits is outdated.

As a result, we’re more likely to fall into financial difficulty than we were 30 years ago. And, if we’re in financial difficulty we’re less productive, so it’s in an employer’s best interests to better protect their people.

We’ve published research called Keeping Pace? Financial Insecurity in the Modern Workforce with Cass Business School. It paints a picture of how the make-up of our workforce has changed. It also makes recommendations about what employers should do to better protect their people.

The infographic has some great data from their case study research, but the design could have done a better job making the information easier to understand for readers.  Many of the visualizations don’t match the data from the study.

For example, the pie slices shown in the Demographic Changes section changed their radius instead of their angle.  This creates a false visualization because the area of a pie slice with twice the radius is much larger than the data values.  So, the visualization is displaying a much larger increase than the data actually shows.  This design mistake with the radii was repeated in the Social Changes section, so that visualization doesn’t match the data either.

Unum also created a motion graphic video to share some of the research findings as well.  I would have recommended tying these two content types together, using the same design assets in both.  They already have the data visualizations from the static infographic, so use them in the video as well.


Thanks to Ed for sending in the link!

Tuesday
Jun112013

The Entrepreneurial Mindset

The Entrepreneurial Mindset infographic

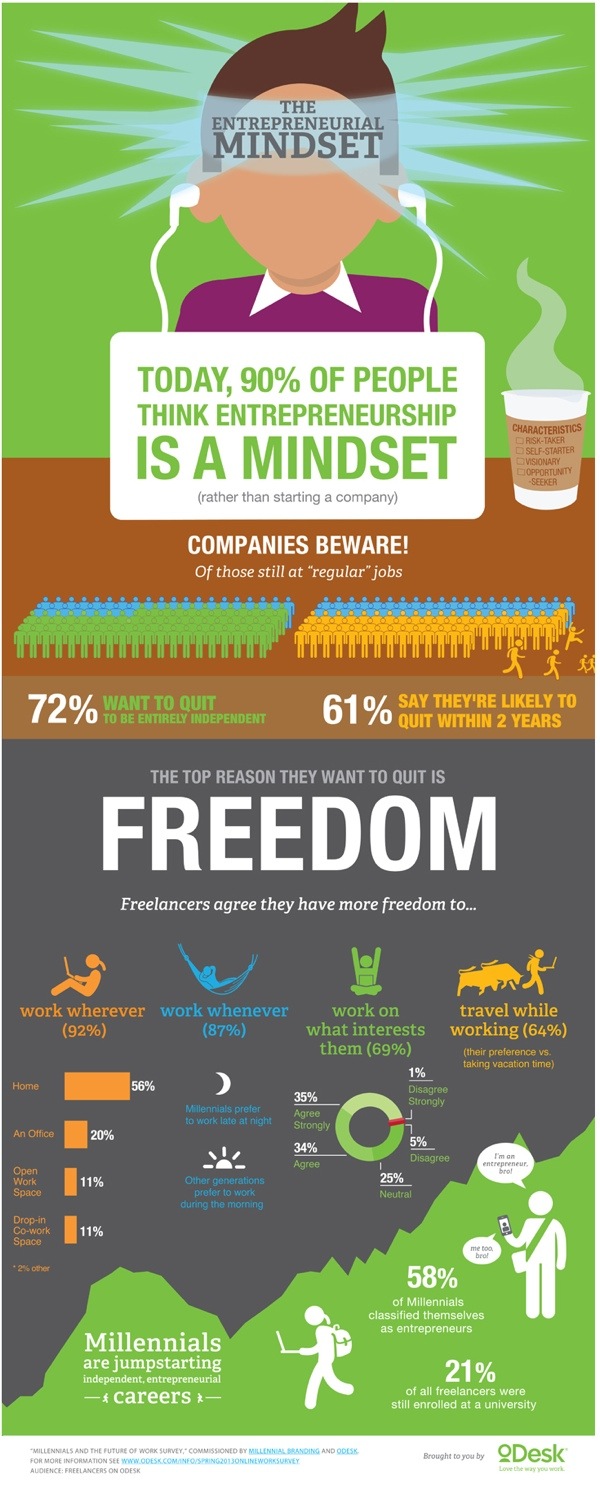
The era of “regular” jobs is coming to an end. The Entrepreneurial Midset infographic from oDesk warns us of the changing mindset of workers. They want more freedom and are more likely to quit their current jobs in search of what they want.

Workers want freedom, and this desire is driving them towards independent (and often entrepreneurial) career paths. Following a prior study on disruption of work from the perspective of businesses, this survey examines the future of work as envisioned by professionals. Results found that many are planning their escape from corporate jobs — 72% of freelancers still at “regular” jobs want to quit entirely, and 61% say they are likely to quit within two years.

Millennials in particular are pursuing independent careers that foster faster progression than traditional hierarchical organizations. Of almost 2,000 Millennial respondents, 58% classified themselves as entrepreneurs. These responses (from more than 3,000 freelancers worldwide who have worked online) quantify the mindset of freelancers today, providing a glimpse into the professional landscape of tomorrow.

There are some great statisitics in this design, but it’s disappointing that some of the data near the end is just shown in text instead of visualized.

I really apprecaite the data transparency.  They also published the full results of the survey in a SlideShare presentation.

Thanks to Alexia for sending in the link!

Monday
Jun102013

How to Woo a Designer

How to Woo a Designer infographic

Want to learn how to woo a designer instead of offending them? The How to Woo a Designer infographic from 99designs.com gives us a look into the designers’ world.  Both the best sides and the worst sides. 

The 99designs designer survey was conducted in September and October 2012 and received 2,379 responses. Survey sources include graphic designers active in 99designs’ community and graphic designers not affiliated  with 99designs. 

We asked our survey respondents to list some of the best and worst things a client has ever said to them

Good information whether you’re an inside designer or a design freelancer working for clients!  Some of the data could have been visualized better.  The ranking of misconceptions looks like a bar chart with the colored rectangles behind the text, but they fit the text size and don’t represent the data.

The design should include a clear title in the infographic (not just on the web page), the URL link back to the original infographic, some type of copyright or Creative Commons license statement and credit to the designer.  Come on, it’s an infographic about designers on an online marketplace for graphic designers!  Give the designer some credit!

Thanks to Lauren for sending in the link!

Wednesday
Apr182012

Where the Startup Jobs are

Where the Startup Jobs are infographic from StartUphire.com aims to help raise awareness of the lack of qualified people filling technical positions in startups.

StartUpHire, with support from the National Venture Capital Association, is releasing a new infographic today depicting 2011 hiring data for startups.  What’s the biggest take away? While most of the country is still sluggish on job creation, startups face the opposite problem- a glut of open technical jobs.

36 percent of all open jobs at startups last year were engineering or technical jobs. However, those two sectors saw only 15 percent of the overall applicant pool trying to fill those positions.  This supports evidence of an ever-tightening market for specific skills out there, and the need to keep developing and attracting qualified talent to young startup companies remains critical.

I think if the country wants to know who holds the best hope for meaningful economic growth, we need look no further than our own home grown, innovative, and passionate startup ecosystem.

This is an interesting story to tell, and an infographic is a great way to do it.  In a down economy with higher unemployment, there are certain job sectors that still aren’t getting enough qualified candidates!

Obviously, everyone assumes there are startup jobs in California (in Silicon Valley), but the map clearly shows startup positions that have been filled across the country.  Visually, the size of the state callout boxes and text seems to imply how big the numbers or for each state; however, that’s not the case and it’s misleading the reader.  Massachusetts had a higher number of job posts than Texas, but the callout text is much smaller.

The circle sizes in Job Posts by Industry appear accurate, which is where many designs make mistakes.  I also like the Areas of Expertise chart, and how the positions are arranged along the X-axis in order of the disparity between open positions and the number of applicants.  That conveys an additional level of information to the reader.

I was disappointed to see the last couple of statistics in the design didn’t get the data visualization treatment.  Show a visualization of 27% and give the 502 number some visual context to show how big that number actually is.  The URL for the original infographic is included at the bottom, but there should also be a copyright statement in the design.

Thanks to Robin for sending in the link!

Monday
Jan232012

Job Growth at the 100 Best Companies

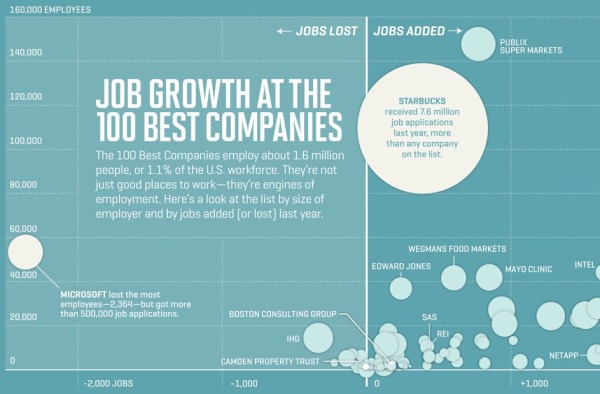
Designed by Nicolas Rapp, with Anne Vandermey (@Vandermy), Job Growth at the 100 Best Companies is a companion infographic for the Fortune feature article, 100 Best Companies to Work For.

Fat paychecks, sweet perks, fun colleagues, and over 70,000 jobs ready to be filled — these employers offer dream workplaces. Like Google, which reclaims the top spot this year to become a three-time champion. Meet this year’s top 100, network with the winners on LinkedIn, and more.
In the latest issue of Fortune Magazine.

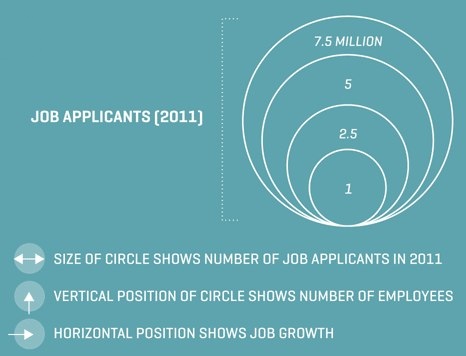
This is a great Bubble Map visualization that shows the reader three different dimension of information: Job growth (or loss), total company employees and total job applications over the course of the last year.


I do wish that all of the bubbles had been identified in the infographic.  There are many company bubbles unmarked, but the reader assumes they are a part of the Top 100 list.  Just my personal preference, but I would have used the company logos instead of text to identify the bubbles too.

Head over to Nicolas’ site to see the full-size version: