About
Randy Krum
President of InfoNewt.
Data Visualization and Infographic Design

Infographic Design

Infographics Design | Presentations
Consulting | Data Visualizations

DFW DataViz Meetup

Join the DFW Data Visualization and Infographics Meetup Group if you're in the Dallas/Fort Worth area!

Search the Cool Infographics site

Custom Search

Subscriptions:


Feedburner

The Cool Infographics® Gallery:

How to add the
Cool Infographics button to your:

Cool Infographics iOS icon

- iPhone
- iPad
- iPod Touch


Read on Flipboard for iPad and iPhone

Featured in the Tech & Science category

Flipboard icon

Twitter Feed
From the Bookstore

Caffeine Poster

The Caffeine Poster infographic

Entries in photo (47)

Friday
May252018

Digital Photography 101

Digital Photography 101 infographic

The Digital Photography 101 infographic from The Backdrop Store is a great primer for newcomers to the basics of photography.

This is a great use of an infographic as a high level summary that invites people to your website and to their much more detailed Digital Photography 101: The Definitive Guide for 2018

I usually advise against full color photos in infographics because they are visually noisy, and multiple photographs add multiple color palettes to one infographic design. However, in this case the topic is specifically about photography, so the use of photos is very relevant and appropriate. Notice the simple color scheme of the rest of the infographic so the photos can stand out and don't compete against the basic design.

Thursday
Jun292017

How the iPhone Changed Visual Communication

How the iPhone Changed Visual Communication infographic

How the iPhone Changed Visual Communication is a tribute to the profound impact the iPhone has had looking boack on it's 10th anniversary. From Shutterstock

Monday
May092016

Kitchen Trends to Consider and Avoid

Kitchen Trends to Consider and Avoid infographic

Kitchen Trends to Consider (and Avoid) for Your Remodel is a comprehensive infographic from The Home Depot, covering the current kitchen design trends and top reasons to remodel your own.

A kitchen makeover can seem daunting and out of reach, but simple updates to cabinets, countertops, and colors can help an old and ignored kitchen feel fresh, fashionable, and, best of all, functional.

The following infographic from The Home Depot gives expert designer Kerrie Kelly’s tips on the hottest trends in new cabinets, countertops, colors and accents, and pointers for how to take your kitchen from drab to fab. Kelly’s design advice (don’t be afraid of color!) as well as warnings against what to avoid (go easy on the patterns), will give you all the latest in kitchen remodel trends. From the light, airy look of white cabinets, to the natural, organic look of elements like limestone and forestry, there is a trendy style for every taste.

And if keeping up with DIY television shows isn’t enough reason to get started, we’ve got three essential reasons for you to roll up your sleeves and get moving on your kitchen renovation. An updated kitchen affects your biggest investment — your home — as well as your quality of life. (Hint: Did you know that 90 percent of people report a greater desire to be home after a remodel?) Read the infographic for more reasons to get started, and visit this remodel planning guide for actionable ideas and advice.

Generally, I recommend against using photos in an infographic design, but the use of photos here is crucial to communicating the different design trends and kitchen looks. The combination fo photos with simple, one-color data visualizations works very well, and clearly communicates the different aspects of each design and function.

This is also a fantastic case-study in choosing an infographic topic that is compatible and related to your business. This isn't an advertisement for Home Depot, linking to specific products on their site. Instead, it's informative to consumers and actionable information they use to make their own purchase decisions. The information included is valuable to everyone that has a kitchen, and is likely to be shared often.

Thanks to The Daily Meal for sharing the infographic!


Thursday
Sep242015

Know Your Image Formats Mega Cheat Sheet

Know Your Image Formats Mega Cheat Sheet infographic

Know Your Image Formats Mega Cheat Sheet from Make a Website Hub is helpful when working with image files. You can't just use one image format for all your needs. You need to choose based on your use. Learn how to choose between JPEG, GIF, TIFF, PNG, or BMP.

Not all image formats are created equal. All have different uses and different attributes. Know exactly what image format to use for web use, print, social platforms, logos, and much more with this handy cheat sheet.

Found on http://infographicjournal.com

This is a little more detailed than a similiar infographic I posted on Cool Infographics last year that can be found here: http://www.coolinfographics.com/blog/2014/12/12/when-to-use-jpeg-gif-png-image-file-types.html

Wednesday
Sep022015

The Science of Instagram

The Science of Instagram infographic

The Science of Instagram by Dan Zarrella is a study on 1.5 million photos on Instagram about which photos get more likes and comments. 

If you want to see data like this about your account specifically, check out the Instagram analytics tool I released: PicStats.com

When I’m speaking at a conference, one of the most common questions I’m asked is what do I think the future of social media is. I’m not great at distant future predicting, but I do believe the story of the present and near-future of social media is visual content. From the impact of images and video on Facebook and Twitter to the new crop of media-centric social platforms like Instagram and Pinterest, it’s clear that inbound marketers need to be turning out great visual content.

I recently spent some time collecting a large Instagram database and analyzing it to identify the characteristics that make images work (or not work). The result is the infographic below. If you’re curious about the nerdy details of the dataset, there are details at the bottom of it.

Be sure to come see me present my all new edition of The Science of Social Media next week in Boston at INBOUND. I’ll be speaking on Wednesday the 17th at 1:45PM. There will be tons of never before seen data, including lots about visual content. Oh, and follow me on Instagram!

I like the simplified charts in this infographic. Removing the unnecessary gridlines, axes and other chart clutter helps them clearly communicate their content to the readers.

The footer should include a copyright (or Creative Commons) license statement and the URL to the infographic landing page so readers can find the original full-size version when bloggers repost the infographic without a link. I always include a link back to the original but most do not.

Found on http://www.marketingprofs.com/

Friday
Dec122014

When to Use JPEG, GIF, & PNG Image File Types

When to Use JPEG, GIF, & PNG Image File Types infographic

Image file types are confusing to many people, but the Know Your File Types: When to Use JPEG, GIF, & PNG infographic from WhoIsHostingThis? Is here to save the day. Too many people just JPG image file because they don’t understand the differences.

Trying to save space on image files?

It can be tough to know exactly which filetype is the best to use. If you save your image as the wrong type, you could end up blurring a beautiful photo, losing all the detail of your logo, or turning a transparent background black.

If you’d like to know exactly which is the perfect image filetype to use for which images, and save a lot of space and bandwidth in the process while maintaining a quality image, check out the handy reference below for the facts.

Great topic for an infographic! A complex, confusing subject that needed the infographic design treatment to simplify the information.

The URL to the infographics landing page should be included in the footer so readers can find the original, full-size version from sites that don’t link back to the original source.

Found on LifeHacker


Wednesday
Jul022014

Secrets of a Killer Blog Post: Images

Secrets of a Killer Blog Post: Images infographic

It can be hard to run a successful blog. Here at Cool Infographics, we strongly believe in graphics and images (big surprise right?). But if you still need a little persuading, the Secrets of a Killer Blog Post: Images infographic can tell you more great things about images and what they can do for your blog.

You already know that well-researched, high-quality content is the backbone of a killer blog post. But don’t underestimate the importance of a strong visual component when you’re composing your latest and greatest update for your audience

The human brain processes images in as little as 13 milliseconds—less than the blink of an eye.

A post with an image is far more enticing to the bounce-happy readers of the Internet than one without, and is more likely to be shared on social media as well.

There’s a lot of information in this one!  Everything this design mentions about photos and images applies to posting infographics as well.

Published by whoishostingthis.com

Thursday
Feb062014

Shutterstock's Global Design Trends 2014

Shutterstock's Global Design Trends 2014 infographic

Shutterstock’s Global Design Trends 2014 infographics is essentially a visual press release.  Based on their own internal web stats from their users, they are sharing the most popular image searches and trends from 2013.  And of course is should be shared visually!

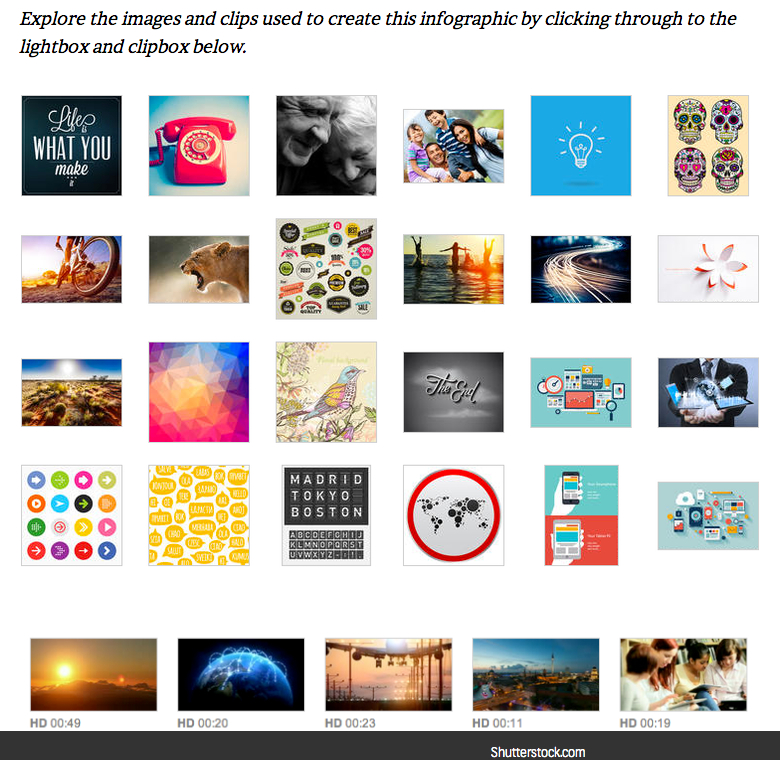
One of our favorite annual traditions at Shutterstock is sharing our hard-earned design-trend data with the world. For this, our third annual infographic, we used data from our 350 million all-time downloads to explore recent and emerging trends from around the globe.

Check out the infographic below, then scroll on to view a lightbox featuring images showcased in the design, get the code to embed the infographic on your site, and share your own thoughts and insights in the comments.

Searches for infographic design elements in 2013 were up 332% compared to 2012!

Many infographics include data sources, but this one is based on their own internal data!  As a alternative, I love that they include clickable links to all of the stock photos, vectors and videos included in the design on the infographic landing page.  However, it would have been helpful to readers for the infographic to include the longer URL directly to that landing page on the Shutterstock blog, instead of just the front page.  Readers that make it that far, then have to search for the specific blog post to find the links and the original infographic.  Today, it’s the most current post and easy to find, but after a few more blog posts it will be much harder to find.


Thanks to Danny for sending in the link!

Wednesday
Dec182013

The 100 Most Influential Cameras in History

The 100 Most Influential Cameras in History infographic poster

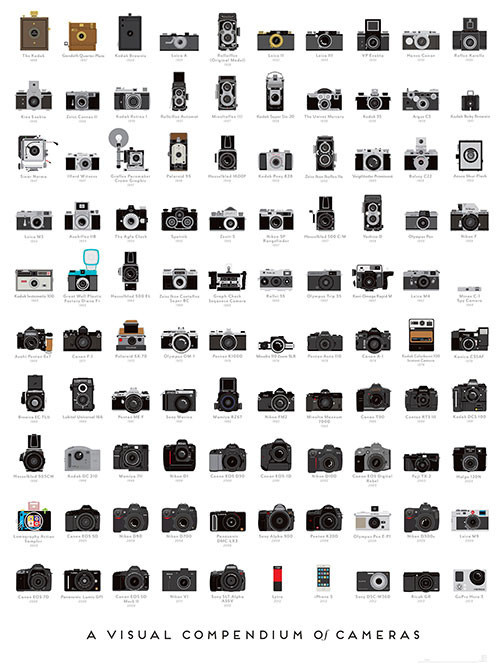
Another great infographic poster from the team at Pop Chart Lab!  A Visual Compendium of Cameras lines up the 100 most influential cameras in history in Chronological order.

A meticulously illustrated catalog of 100 landmark cameras, culled from over a century of photographic history, depicting both professional and consumer models and tracing photography’s history from the first models to today’s digital wonders.

Available unframed for $28 from the Pop Chart Lab Store.

Found on Fast Company Design!


You can see this one and many other infographic posters collected on the Cool Infographic Posters page or my Infographic Posters board on Pinterest!

Tuesday
Jun252013

Planets in Orbit Around Earth!

What if we had a planet instead of a Moon? Saturn

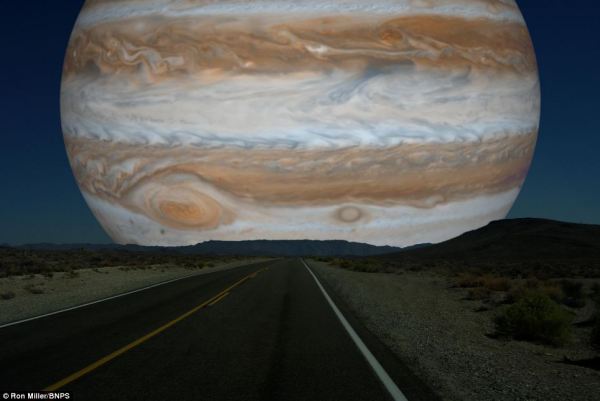
What if we had a planet instead of a Moon?  Photographer, space artist, illustrator and former art director for the National Air & Space Museum’s Albert Einstein Planetarium, Ron Miller, created a series of very cool images that visualize how the rest of the planets in our solar system would appear if they orbited Earth at the same distance as the Moon.  

I’ve posted a number of different data visualizations and infographics that help visualize the sizes of the different planets, and this is a very cool approach that might make the relative sizes more relevant and understandable to a bigger audience that is already used to seeing the Moon in our sky.  For comparison, here is the original photo of the Moon:

What if we had a planet instead of a Moon?

From Ron’s description:

At a distance of about 240,000 miles, the Moon occupies a space in the night sky about half a degree wide. By sheer coincidence, this is almost exactly the same size the sun appears, which is why we occasionally get total solar eclipses.

But it’s interesting to imagine what the night sky might look like if one of the Solar System’s planets were to replace our moon. (We’d have to ignore things like tides and gravitation, but that’s the advantage of doing things in the mind’s eye.)  Saturn would be an astonishing sight. Almost 35 times larger than the Moon, this golden globe would cover nearly 18 degrees of the sky. We’d be a little further away from Saturn than its satellite Dione. In fact, we’d be more likely to be a satellite of Saturn ourselves than the other way around. The rings would stretch nearly from horizon to horizon.

Of course, the gas giant Jupiter is downright scary!

What if we had a planet instead of a Moon? Jupiter

View all of the full size images in Ron’s post on io9!

Found on My Modern Met and The Daily Mail