About
Randy Krum
President of InfoNewt.
Data Visualization and Infographic Design

Infographic Design

Infographics Design | Presentations
Consulting | Data Visualizations

DFW DataViz Meetup

Join the DFW Data Visualization and Infographics Meetup Group if you're in the Dallas/Fort Worth area!

Search the Cool Infographics site

Custom Search

Subscriptions:


Feedburner

The Cool Infographics® Gallery:

How to add the
Cool Infographics button to your:

Cool Infographics iOS icon

- iPhone
- iPad
- iPod Touch


Read on Flipboard for iPad and iPhone

Featured in the Tech & Science category

Flipboard icon

Twitter Feed
From the Bookstore

Caffeine Poster

The Caffeine Poster infographic

Entries in Characters (12)

Tuesday
Jul112017

Fictional Travel Times Compared

Fictional Travel Times Compared Infographic

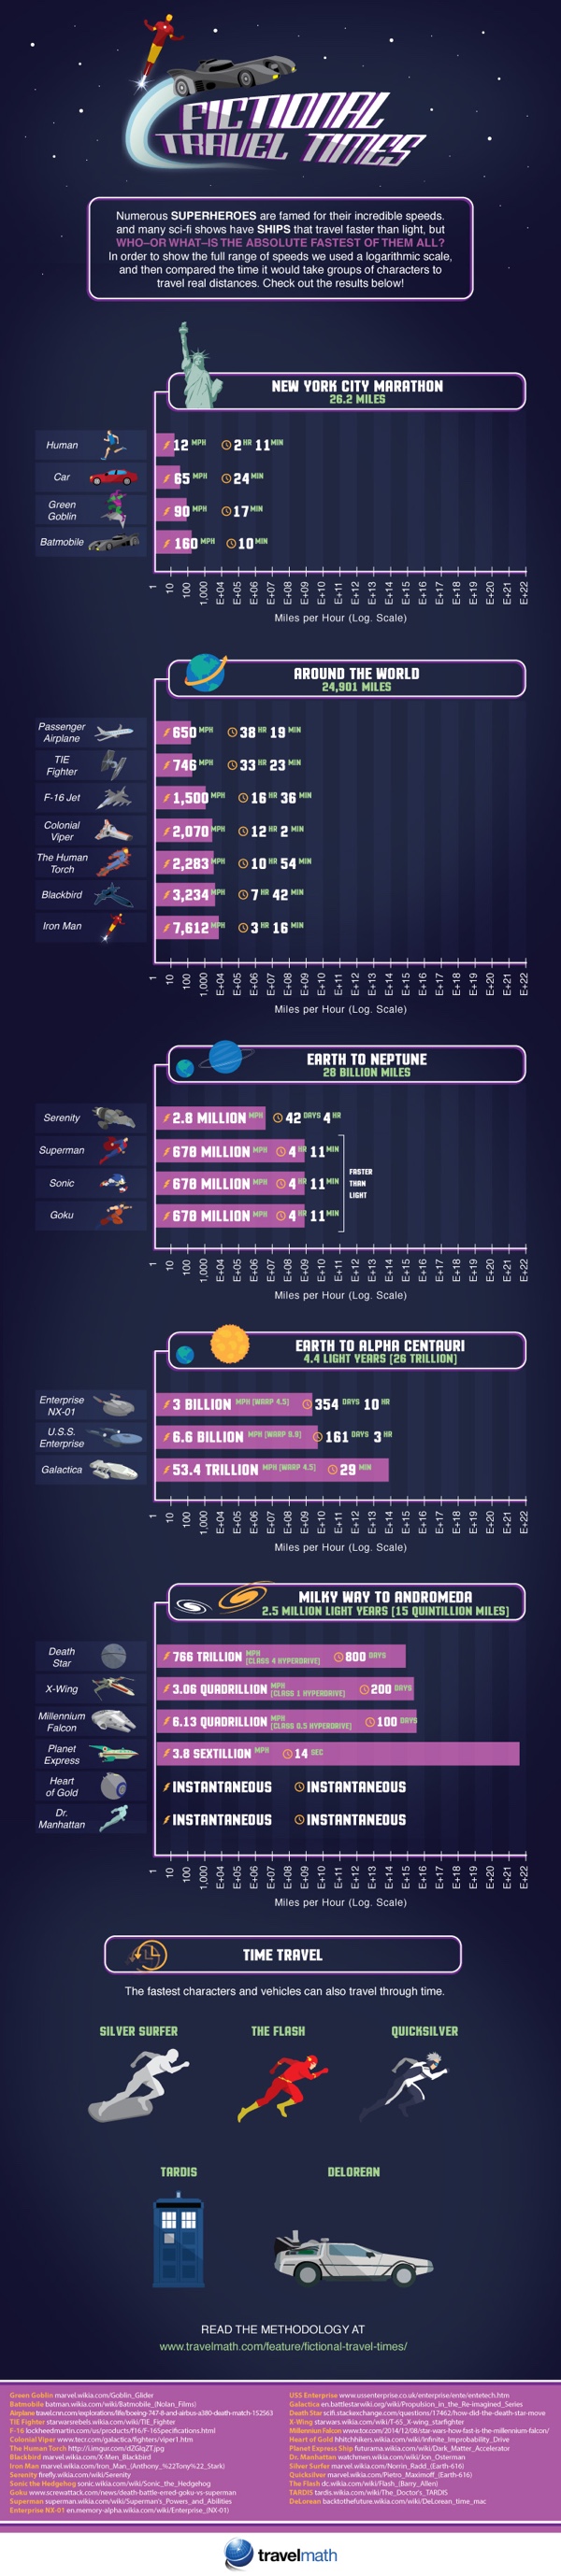
The Fictional Travel Times infographic from TravelMath compares the speeds from many fictional characters and vehicles from comics, TV and movies.

The universe is a big place – being faster than a speeding bullet is a crawling pace when it comes to interplanetary travel. Science fiction authors have needed to bend the laws of physics to create engines that are capable of going faster than light in order to complete these journeys in any reasonable amount of time. For this reason, there are a handful of superheroes who can travel faster than light, and in some cases, back in time.

See how your favorite superheroes and ships stacked up below, and read our methodology at the end to learn more about the science behind these fictional travel times.

What's your opinion on using Log scales in infographics?

Personally, I don't think enough people are data visualizaiton literate enough to visually understand log scales. Many readers will not understand why the bars don't seem to match the numbers, or won't read the numbers and assume the length of the bars is linear.

Thoughts?

Found on CBR.com

Monday
Dec012014

The Internet Is a Zoo: The Ideal Length of Everything Online

The Internet Is a Zoo: The Ideal Length of Everything Online infographic

Short, sweet, and to the point! The Internet Is a Zoo: The Ideal Length of Everything Online infographic from a partnership between SumAll and Buffer explains the fine line between when extra words are helpful, and when they become too much information. Whether you are posting a facebook post to your friends, or a blog post to your avid followers. This infographic will help make sure your posts reach the most readers!

Have you ever woken up in cold sweat in the middle of the night wondering exactly how many characters long a tweet should be to get the most engagement, or how many words long a blog post should be so that it actually gets read?

Ok, that may just be me, but knowing exactly how many characters a Facebook post should be or what the ideal subject line length is should be endlessly fascinating (and useful) information to most people who are active on social media.

So, to make all this data digestible and easy to understand, we partnered with our awesome friends over at Buffer to produce an infographic that shows the optimal length of pretty much everything on the internet.

Great design that tells one story really well, totally focused on the length of posts on different social media platforms. The footer should include the URL to the infographic landing page so readers can find the full-size original when the infographic is posted without links.

They went one fantastic step further, and created a more print friendly version near the bottom of the landing page that spans multiple printed pages. The pages are formatted to fit on standard Letter-size paper or in presentation slides. This is a great example of using the research and design from the original infographic to share the information in additional formats.

Infographic was found on SumAll

Friday
Sep192014

Marketing Artists vs. Marketing Scientists

Marketing Artists VS Marketing Scientists infographic

The Marketing Artists vs. Marketing Scientists infographic from Pardot highlights the assets of both kinds of marketers in the modern age. But the alliance between the two groups will create the best end product.

In a great article published last week, Stan Woods of Velocity Partners offered his thoughts on how fast marketing has developed over the past few months, and the new marketing roles this change has created.

In his closing paragraph, Woods distinguishes between the creative-driven and data-driven marketers by referring to them as “marketing artists” and “marketing scientists,” respectively. Although a slight oversimplification, these distinctions hold a lot of truth about the current divide that exists within many marketing departments.

Technology has given marketers the ability to track, quantify, and optimize marketing processes at a level that was unheard of only a year ago. The marketing scientist has come to dominate this new arena of objective measurement and data-driven thinking, while the marketing artist continues to thrive on creative ideas and a more abstract way of thinking.

But while these two differently-minded marketers may sometimes disagree over where the focus should lie,  the marketing departments that will truly excel in this new age of marketing are those that recognize the value in both approaches. We have put together the infographic below to help highlight the tremendous assets marketing artists and marketing scientists can bring to the table, and the advantage of finding a balance between the two.

This is a purely informational design with no numerical data, but tells a good story. There are two aspects to marketing represented by the illustrated personas. I would prefer less text and more icons or illustrations, but the infographic does a great job of telling one story really well.  That keeps the design short, easy to share and easy to read.  The dominant central visual is also appealing and attracts attention.

The footer should include the URL to the infographic landing page, not just Pardot.com.  When readers come looking for the full-size version, don’t make them search your site for it.

Found on http://www.business2community.com/

Tuesday
Jul152014

House of Cards: Power Connections

House of Cards: Power of Connections infographic

We’ve all have heard the saying, “It’s not what you know, it’s who you know.”  The House of Cards: Power Connections infographic from Linkedin brilliantly uses the House of Cards show to show a good example of being connected. How powerful is your connection network?

Relationships Matter

From college internships to becoming President of the United States, who you are connected to and how you leverage those connections matters.

We wrote the post 4 sales strategy lessons from Frank Underwood to take some learnings from the show and how they can apply to your professional growth. It was an amazing use of social media that we got a response from the House of Cards Twitter profile and felt we should lean-in on some of the content.

The best way for us to illustrate the valuable connections of a character like Frank Underwood is to create a LinkedIn InMap infographic with Frank at the center.

I love the idea of using a famous fictional person to show the “Power of Connections” instead of a real person that people might not be familiar with. Color-coding is always a helpful tool to minimize words on an infographic, and it’s used well here. Also, the use of faces for the key people on the graphic break up the names to keep it interesting. However, the reasoning behind the use of different sizes of circles around the names is unclear. Always make sure to include the URL of the infographic landing page at the bottom so that viewers can find the original.

This is based on the same network map visualization tool that you can use to automatically visualize your own connections on Linkedin.  Login with your Linkedin account on the Linkedin Labs page: http://inmaps.linkedinlabs.com/

Found posted on Google+ by Jason Lankow

Tuesday
Nov122013

Star Wars Episodes IV-VI Character Poster

Star Wars Episodes IV-VI Character Poster

The Star Wars Episodes IV-VI Character Poster from designer Wes Anderson is a fantastic visual tribute to the Star Wars series.  The limited run of 500 printed posters sold out in a few days on Spoke Art, but everyone can still admire the design online.

In 1978 my father took me as an excuse to go see that movie about silly robots and spaceships that everybody was talking about. I didn’t get much at that time, since I was very young, but what I do remember well is how much I enjoyed beginning my first geeky action figures collection that came right after the movie. My first figure ever was Luke Skywalker, a figure that got lost over the years. I’m still looking for it on my parent’s attic. Where are you Luke Skywalker?

With the time I became a fan, of course. As homage to that great moment of my life, here’s a new poster featuring (almost) every character of the first Star Wars trilogy in order of appearance. It is of course limited and numbered. If you want a copy, this link will take you to Spoke Art Gallery’s online shop where you can easily order one and receive it at your front door. We gave the mailmen specific orders to be dressed as Storm troopers during delivery, but they didn’t take it so well, so they probably won’t.

Star Wars Episodes IV-VI Character Poster detail


Found on Nerd Approved, Technabob, and the Fire Wire blog

Thursday
Oct312013

Highest Grossing Movie Franchises

Highest Grossing Movie Franchises infographic

The Highest Grossing Movie Franchises infographic from Buzzfeed makes good use of a stacked bar chart to put the various movie series into perspective. Design by John Gara.

Listed below are the most successful action/adventure movie franchises of all time. Each box represents an individual movie within that franchise, its width reflective of its contribution to the franchise’s box office success. We used worldwide box office totals from The-Numbers. com and adjusted them for inflation. All movies within each franchise are displayed chronologically from left to right.

Great design that really does a fantastic job of comparing the franchises.  I’m especially impressed that they took the time to adjust the data for inflation, a step that designers normally forget.  The color coding within each franchise is also easily explained with colored text under the stacked bars.  No need for a chart legend!

The franchises are sorted in descending order as shown by the bars, but the extra graphic design to the right of each bar is visually misleading.  To some, this will look like an extension of the data, but it’s just artistic, with the images spaced out so they don’t overlap.

The footer should have included both a copyright statement, and the URL link back to the original landing page so readers can find the original full-size version.

Found on GeekTyrant

Wednesday
Oct162013

The Ultimate Loss

The Ultimate Loss infographic

The Ultimate Loss infographic from Confused highlights some of the most famous SciFi characters that are the last survivors of their home worlds destruction.

Sci-Fi characters who survived their planets’ destruction.

It’s a popular theme laced throughout science fiction movies and television shows: characters who survive the loss and utter destruction of their home worlds.  Here’s a look at some of the most notable sci-fi survivors.

Knowing the infographic image will be shared on other sites, this design is missing some crucial information in the footer.  The biggest omission is a mention or logo from the company that published it, Confused.com.  The footer should also include a copyright statement, and the URL to the infographic landing page where readers can find the original full-size version.

Found on visualnews.com

Wednesday
Sep042013

The Guide to Star Trek Uniforms

The Guide to Star Trek Uniforms infographic

The Gude to Star Trek Uniforms infographic from Costume Supercenter. Make sure you know what uniform your wearing!

When the original Star Trek television series started, male and female officers wore similar outfits. The male Star Trek uniforms consisted of black pants, black boots and a velour shirt with the symbol on the left side. Females wore the same type of shirt, with black boots and tights, and a black skirt, although in some cases they wore black pants. The color of shirt worn identified the branch the crew member belonged to. Those in green shirts worked for command personnel, while beige stood for operations, and blue was for medical personnel only. The velour shirts were changed to nylon shirts starting in the third season. You can find many of the Star Trek Costumes here.

Don’t be the red-shirted ensign!

The footer of the design should include the copyright information and the URL to the original infographic landing page so readers can see the full-size infographic.  The Costume Supercenter logo should also be somewhere on the design to connect the infographic to the publishing company.

Found on Visual.ly

Monday
Sep242012

Star Wars Infographic Flowcharts

Star Wars infographics

Marc Morera has designed some amazing Star Wars infographics charting the character progression, deaths and conflicts in the Star Wars movies, the animated series, comic books and major novels.  On the landing page, you will find them organized chronologically, so the Animated Series fits in between movies II and III.

Characters are illustrated as recognizable isotypes.  Each character’s plot line is color-coded, and the lines from the appropriate characters converge at circles representing the major conflicts along each story timeline. 

Star Wars infographics

The two examples shown here are reduced in size to fit on the blog, so go check out all of them on Marc Murera’s site for high-resolution versions.

Wednesday
Feb292012

The Startup Ecosystem: Predator vs. Prey

The Startup Ecosystem: Predator vs. Prey is a fun but informative infographic from udemy.  It looks at the different roles related to tech startup companies in an amusing way by personifying them as fish in the sea.

The startup waters are murky and full of hidden dangers. Below the surface, the ecosystem rests in a delicate balance between predators and prey.

To help you navigate these stormy seas, we’ve created the infographic below. Read on to find out where you stand in the startup food chain.

This one is light on data, but does convey valuable information to the reader.  The visual scale of Ubiquitous to Endangered is easy to understand, and the color coding is consistent throughout the design.

Found on Best Infographics