About
Randy Krum
President of InfoNewt.
Data Visualization and Infographic Design

Infographic Design

Infographics Design | Presentations
Consulting | Data Visualizations

DFW DataViz Meetup

Join the DFW Data Visualization and Infographics Meetup Group if you're in the Dallas/Fort Worth area!

Search the Cool Infographics site

Custom Search

Subscriptions:


Feedburner

The Cool Infographics® Gallery:

How to add the
Cool Infographics button to your:

Cool Infographics iOS icon

- iPhone
- iPad
- iPod Touch


Read on Flipboard for iPad and iPhone

Featured in the Tech & Science category

Flipboard icon

Twitter Feed
From the Bookstore

Caffeine Poster

The Caffeine Poster infographic

Entries in speed (4)

Tuesday
Jul112017

Fictional Travel Times Compared

Fictional Travel Times Compared Infographic

The Fictional Travel Times infographic from TravelMath compares the speeds from many fictional characters and vehicles from comics, TV and movies.

The universe is a big place – being faster than a speeding bullet is a crawling pace when it comes to interplanetary travel. Science fiction authors have needed to bend the laws of physics to create engines that are capable of going faster than light in order to complete these journeys in any reasonable amount of time. For this reason, there are a handful of superheroes who can travel faster than light, and in some cases, back in time.

See how your favorite superheroes and ships stacked up below, and read our methodology at the end to learn more about the science behind these fictional travel times.

What's your opinion on using Log scales in infographics?

Personally, I don't think enough people are data visualizaiton literate enough to visually understand log scales. Many readers will not understand why the bars don't seem to match the numbers, or won't read the numbers and assume the length of the bars is linear.

Thoughts?

Found on CBR.com

Wednesday
Aug172016

The Fastest Men in the Olympics Since 1896

The Fastest Men in the Olympics Since 1896

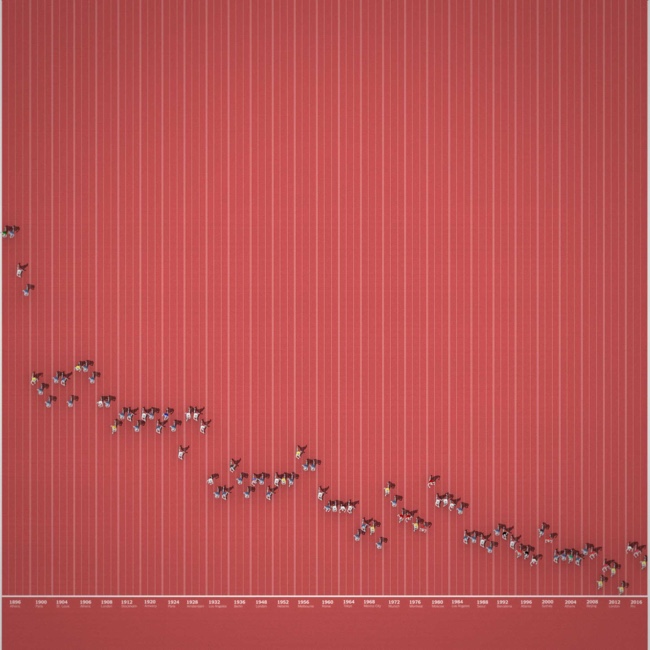
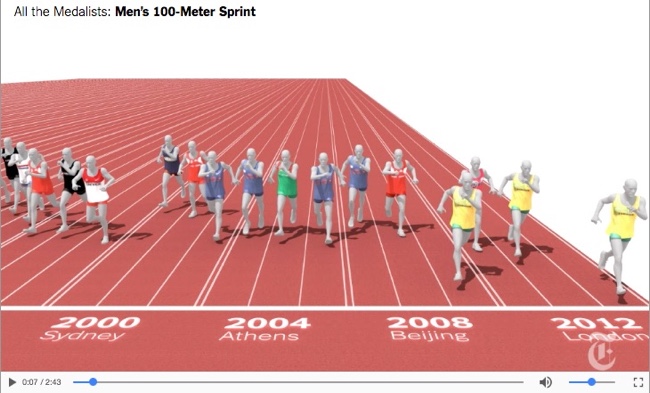
To put Usain Bolt's 3rd consecutive Olympic Gold Medal for the 100m dash into perspective, the NY Times designed this great graphic showing Usain Bolt and the Fastest Men in the World Since 1896 – on the Same Track.

Usain Bolt’s historic third consecutive gold medal in the men’s 100-meter dash cemented his status as history’s greatest sprinter and the world’s fastest man. He edged out Justin Gatlin, an American, and Andre De Grasse, a Canadian, on his way to the gold.

But how does Bolt compare to the full Olympic field in the 100-meter dash – not just this year, but against every Olympic medalist since 1896? To answer that question, we created a massive (and imaginary) track with 88 lanes – one for every medal awarded in the 100-meter dash in the modern Olympics.

We then pitted these runners against each other in an imaginary race, using their average speeds. We froze all the runners at the moment the winner crossed the finish line.

This is an update to the same graphic they created in 2012 when he broke his own World Record. The 2012 piece also included this great infographic video explaining the significance of his win:

Found on FlowingData

Wednesday
May132015

The Slow Speed of Light

Riding Light from Alphonse Swinehart on Vimeo.


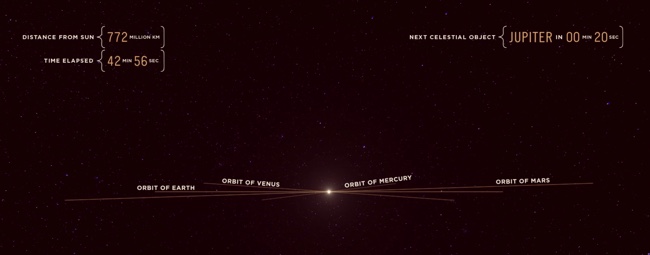
We think of the speed of light as incredibly fast, but in the video Riding Light, by Alphonse Swinehart, we ride along with light as it starts in our Sun and moves out past Jupiter in our solar system. The video is 45 minutes long and helps show both how large our solar system is, and that it still takes light a long time to travel these large distances.

In our terrestrial view of things, the speed of light seems incredibly fast. But as soon as you view it against the vast distances of the universe, it's unfortunately very slow. This animation illustrates, in realtime, the journey of a photon of light emitted from the surface of the sun and traveling across a portion of the solar system, from a human perspective.

I've taken liberties with certain things like the alignment of planets and asteroids, as well as ignoring the laws of relativity concerning what a photon actually "sees" or how time is experienced at the speed of light, but overall I've kept the size and distances of all the objects as accurate as possible. I also decided to end the animation just past Jupiter as I wanted to keep the running length below an hour.

During the course of the video, I also love the data visualziations shown during the flight, like how large the orbits of different planets appear to us as we move outward.

Also available on YouTube:

Tuesday
May212013

Speed Comparison Chart

Speed Comparison Chart infographic

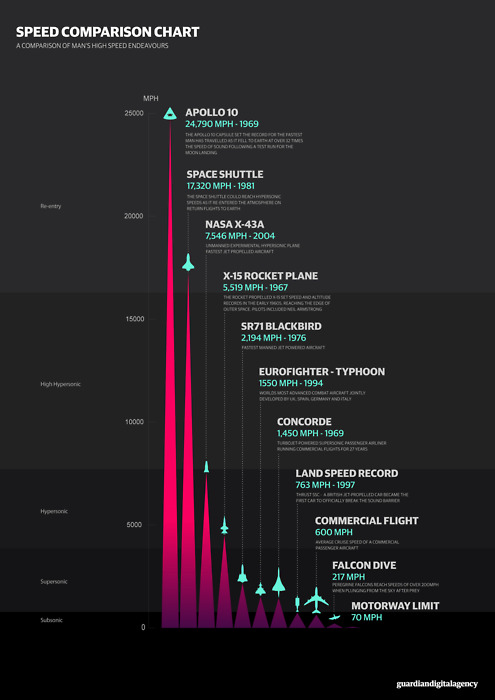
The Speed Comparison Chart, from the Guardian Digital Agency on Tumblr, compares the speeds of different vehicles, from cars to planes to spaceships.

Cool infographic design that tells one story really well.