About
Randy Krum
President of InfoNewt.
Data Visualization and Infographic Design

Infographic Design

Infographics Design | Presentations
Consulting | Data Visualizations

DFW DataViz Meetup

Join the DFW Data Visualization and Infographics Meetup Group if you're in the Dallas/Fort Worth area!

Search the Cool Infographics site

Custom Search

Subscriptions:


Feedburner

The Cool Infographics® Gallery:

How to add the
Cool Infographics button to your:

Cool Infographics iOS icon

- iPhone
- iPad
- iPod Touch


Read on Flipboard for iPad and iPhone

Featured in the Tech & Science category

Flipboard icon

Twitter Feed
From the Bookstore

Caffeine Poster

The Caffeine Poster infographic

Entries in social (50)

Friday
Apr132018

Creating Clickable Social Cards

Creating Clickable Social Cards infographic

The How to Create Clickable Social Cards infographic walks you through the process of using the AnyImage.io site to create social media cards for any of the major social media platforms, such as Facebook, Twitter, Google+ and LinkedIn.

AnyImage is a unique web-based tool that enables you to transform regular images into clickable social cards, linking to any web page of your choice. The cards can be shared on a number of social platforms including Facebook, Twitter, LinkedIn and Google+ 

study by Facebook themselves reported that users were able to increase traffic from the platform by a whopping 250%, simply by using clickable social cards. Thanks to AnyImage, you can begin creating your own cards in just a matter of seconds (for free). 

We’ve created this useful infographic (below) to explain exactly how AnyImage works. Enjoy! 

This is a fantastic use of an infographic as How-To explanation for a company's product or service! Most products have at least a small learning curve, and a clear infographic design can help get your customers over that initial hurdle using your service.

Tuesday
Aug182015

The State of the Social Marketing Team

The State of the Social Marketing Team infographic

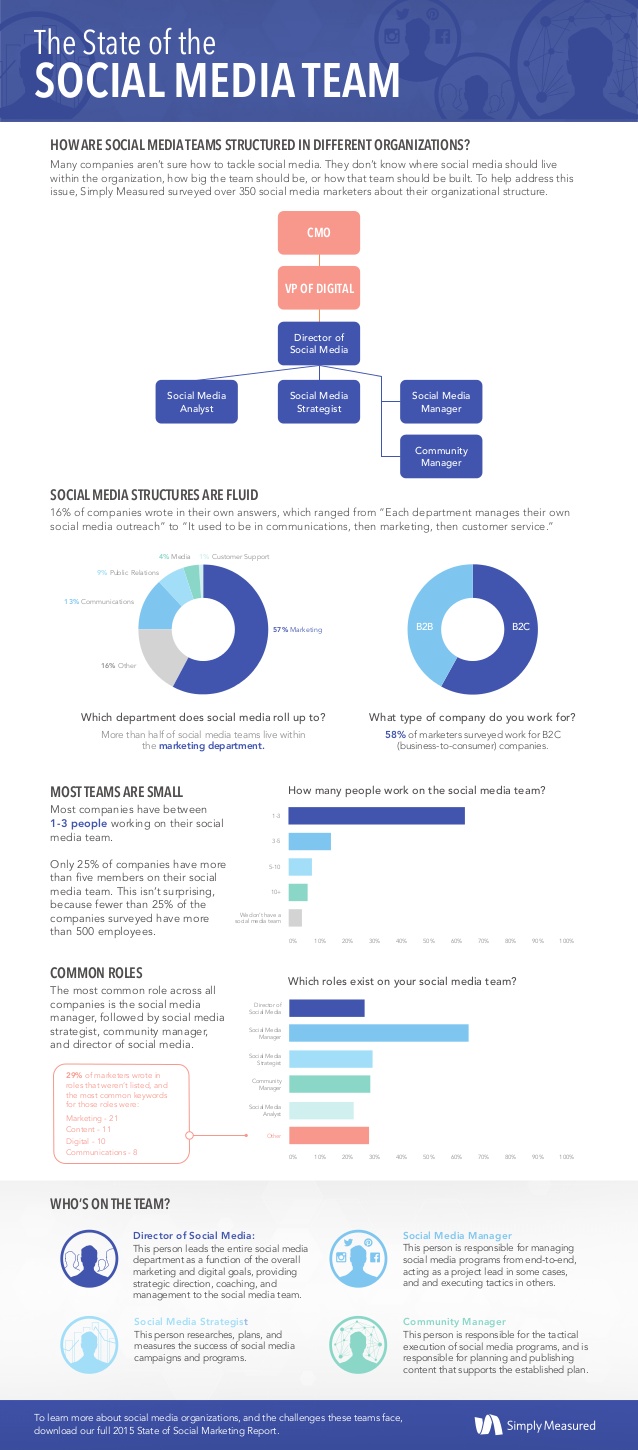
The State of the Social Marketing Team is an infographic from a survey that SimplyMeasured put together and shared in the full 2015 State of Social Marketing report. This is the right way to use an infographic as the visual summary of deeper content hidden behind a registration wall.

Many companies are still trying to figure out how to tackle social media. They’re constantly asking themselves questions like, “Where should social media live in our organization?,” “How big should my team be?,” or “How should our social media team be built?”

To help address this common issue, we surveyed over 350 social media marketers about their team structures and compiled our findings into this infographic! More information from the survey (as well as a separate look at the pain points these marketers face), download a complimentary copy of our 2015 State of Social Marketing Report.

This is a really good infographic. Packed with good information and keeps the design simple and to the point. My only issue with the design is that some of the text is small and in light colors that are hard to read against the white background.

I noticed that SimplyMeasured posted the original infographic on SlideShare and then posted it in their blog by using the SlideShare infographic wrapper for sharing. SlideShare introduced the Infographics Player in 2013, but I haven't seen many people using it. The potential advantage is that most of the view metrics from mutliple sites are combined together in SlideShare. The potential disadvantge is that people go to SlideShare to view your infographic and never make it to your website. 

Found on MarketingProfs

Friday
Sep262014

The Interactive Purriodic Table of Internet Cats

The Interactive Purriodic Table of Internet Cats infographic

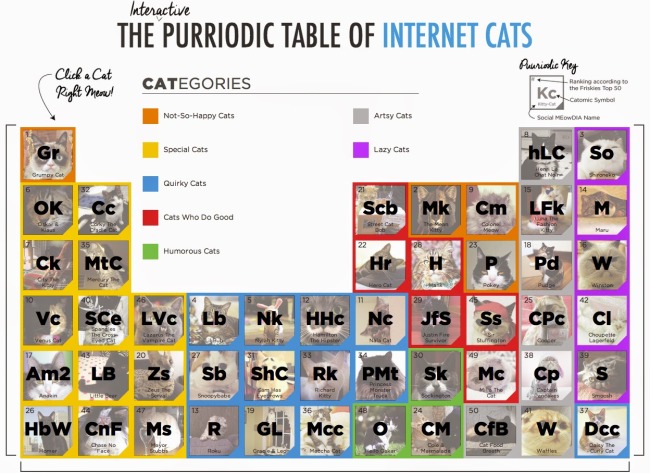
The Interactive Purriodic Table of Internet Cats is a fun way to make sure you’re up-to-date on all of the top Internet cat memes!  Just in case that’s something important to you.

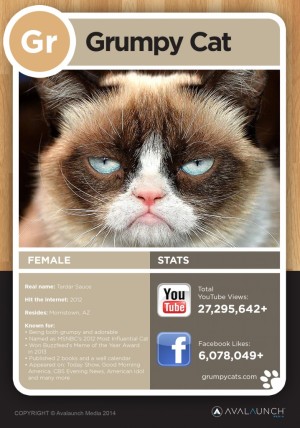
Earlier this week, we launched our latest ‘CATSterpiece’: The PURRiodic Table of Internet Cats. The PURRiodic Table is an amazing interactive graphic that serves as a reference point for the internet’s amazing cats.  Within these pages of the interweb, you can find everything you could ever want to know about your favorite feline, all wrapped-up in a baseball card style view (see image of Grumpy Cat below).

The interactive PURRiodic Table allows users to click on an image of any of 50 felines to learn their stories and view their social-media-star stats.  One of our favorite discoveries in putting the PURRiodic Table together was learning that more than half of these cats are rescue cats, which emphasizes the importance of animal adoptions.


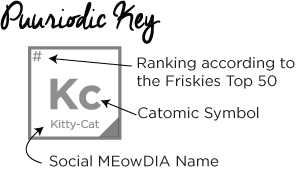
Based on data from the Friskies 50: Most Influential Cats, the design obviously builds on the visualization idea of a periodic table.  Grouped by CATegory and ranked using the Friskies data set, each cat is clickable to get more information and all of their social media links.

This is definitely a design built to entertain audiences! The challenge for interactive infographics like this one is s share-ability and Avalaunch Media has done a fantastic job of preprogramming the social media sharing buttons on the infographic landing page to include a static image to include in posts.  

Thanks to Mat for sending in the link!

Wednesday
May072014

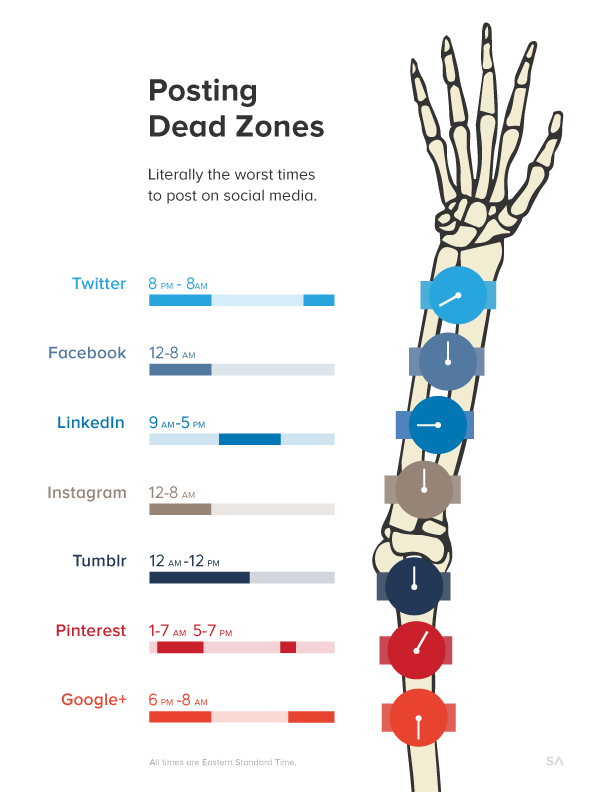
The Dead Zones: When Not to Post on Social Media

The Dead Zones: When Not to Post on Social Media infographic


The Dead Zones: When Not to Post on Social Media infographic from SumAll takes a look at the the worst times to post content on social media.

Now that everyone knows the best times to post on social media – and if you don’t, take a look at our infographic for a refresher–we started thinking about the flip side to the golden hours: the dead zones.

We researched what hours of the day your post will be seen by the fewest number of people and collected them all into this infographic. Beware.

Tell one story really well is one of the keys to a successful infographic, and this design does just that!

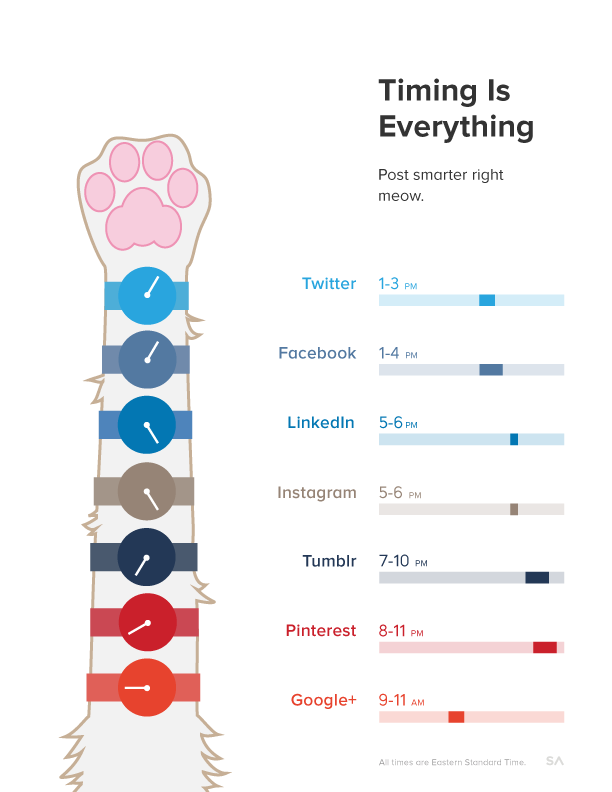
Here’s their prior infographic about the BEST times to post for comparison:

BEST times to post on social media infographic


Thursday
Jan302014

Cool Infographics: Best Practices Group on LinkedIn

Cool Infographics LinkedIn Group

I am excited to announce the launch of a new LinkedIn Group, Cool Infographics: Best Practices. I have personally been a part of many great discussion groups over the years and believe that this group fills an unmet need.  Please accept this invitation to join the group to share your own experiences and wisdom.

There are many groups that share infographics, but I felt that a discussion group dedicated to the craft of infographics and data visualization was missing.  This group will feature questions and case studies about how companies are leveraging infographics and data visualization as a communication tool.  Any posts that are just links to infographics will be moderated to keep the focus on engaging discussions.  Topics and questions from the Cool Infographics book will also be discussed.

Join us in a professional dialogue surrounding case studies and strategies for designing infographics and using them as a part of an overall marketing strategy.  We welcome both beginning and established professionals to share valuable tactics and experiences as well as fans of infographics to learn more about this growing field.

-Randy


Monday
Dec302013

The State of Social Media 2013

The State of Social Media 2013 infographic

The State of Social Media 2013 summarizes some of the major milestones and events in social media that happened during the last 12 months.

What a wild year it’s been. You could say that 2013 was the year of social media and you’d be correct. What was once a novelty for people bored and surfing on the ‘net has risen to be an industry in and of itself that companies large and small have embraced around the world as a powerful cornerstone of their marketing initiatives.

In case you got lost in the details of 2013, we’ve laid out all the notable moments of the year, month by month, in this handy infographic.

There are a handful of statistics listed in the design that should have been visualized instead of just shown in text.  The use of logos and images from the web do a good job of showing the specific events.

Designed by Infographic Promotion UK

Friday
Dec062013

29 Powerful Tools for a Social Media Marketer

29 Powerful Tools for a Social Media Marketer infographic

A Productive Day in the Life of a Social Media Marketer from Razor Social is a great use of an infographic design within a larger content strategy online.  The larger piece is an article that lists out all 29 tools, with links and descriptions, but the infographic shows a character using all of the tools throughout the day.  So the infographic grabs the attention of the audience and gets shared frequently, with links back to the full article.

The demands on us to market our products and services using social media is constantly increasing and the technology/tools required to support this is also increasing.

We start early morning and we finish late at night.  How many of you check your Twitter or Facebook account last thing in the evening and first thing in the morning?

So we thought it would be a good idea to take a look at a very busy day in the life of a Social Media Marketer.  During the  day there are so many tools and tasks.  If you work alone then we certainly wouldn’t expect you to do everything listed here or use all the tools we suggest, but if you are part of a team then you could share out the tasks and tools to make it easier.

A special thanks goes to Donna from Socially Sorted who is my go to person when I want anything visual done.  Thanks Donna.

The infographic design does a good job of removing most of the text descriptions and just using icons and logos to represent the various tool.  Interested readers can dig into the full article for more information.

The footer is missing the URL link back to landing page with the article.  When people post infographics on blogs and social media sites, they aren’t always good about linking back to the original.  By including the text URL in the infographic itself, you can make sure all of the readers can find the landing page.

Friday
Jul122013

Battle of the (Social) Sexes

Battle of the (Social) Sexes infographic

The Battle of the (Social) Sexes infographic from InternetServiceProviders.org explores some of the demographic data behind social media.

You’ve no doubt heard the old, oft-quoted adage, “men are from Mars, women are from Venus,” used to denote the fact that men and women may not always see completely eye to eye. While this light-hearted statement isn’t taken literally, when it comes to the virtual world of Internet interactions, similar sentiments may be formed surrounding the different ways men and women use social networking. While the majority of adults in the US are plugged into some sort of social media outlet, not all of them are used in equal measure, and not all of them are used by both genders equally. For instance, the average Google+ user spend just three minutes per month on the network, while the average Facebook user will spend 405 minutes per month updating statuses, posting pictures, and checking out others’ profiles. So what can be learned about men and women in the world of the web? As is turns out, men and women tend to dominate very different social media networks. The following infographic takes a look at some of the differences between male and female-dominated social media sites: How many users each one has, as well as how they interact.

There’s so really good data they have compiled in here, and most of the data visualizations are easy to understand.  I would not have expected to see that Twitter has 40 million more female users each month.

There are a handful of minor tweaks that would help improve the design:

  • The salmon/orange/peach color for women is unexpected compared to the traditional pink.
  • Go ahead and use the official Twitter and Facebook icons.  No need to design their own.
  • The pie slices for time spent would work much better with colors that are more distinct.  The different shades of gray are very hard to differentiate.
  • For the pie charts, the text label should be placed next to the pie slice its describing, instead of the opposite side as shown in this design.  Flipping the pie charts horizontally would fix that easily.

I appreciate the clear Creative Commons license in the footer, but the URL to the original infographic lansing page is missing.  Since the infographic image file is shared by itself, the URL always helps readers to find the original.

Found on Ragan’s PR Daily


Friday
Jul052013

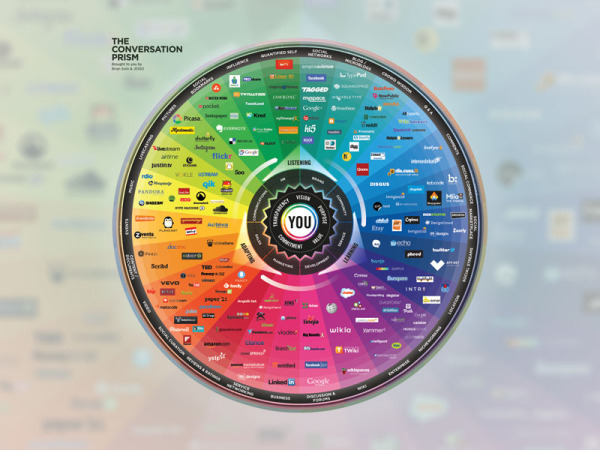
The Conversation Prism 4.0 for 2013

The Conversation Prism 4.0 for 2013 infographic

Brian Solis has released the new Conversation Prism 4.0, with updated companies and categories for 2013.  This project series has been a favorite on Cool Infographics since version 1.0 was released in 2008, and we haven’t seen an update since version 3.0 was released in 2010.

What is The Conversation Prism?

Developed in 2008 by Brian Solis, The Conversation Prism is a visual map of the social media landscape. It’s an ongoing study in digital ethnography that tracks dominant and promising social networks and organizes them by how they’re used in everyday life.

Version 4.0 brings about some of the most significant changes since the beginning. In this round, we moved away from the flower-like motif to simplify and focus the landscape. With all of the changes in social media, it would have been easier to expand the lens. Instead, we narrowed the view to focus on those that are on a path to mainstream understanding or acceptance. The result was the removal of 122 services while only adding 111. This introduces an opportunity for a series of industry or vertical-specific Prisms to be introduced so stay tuned.
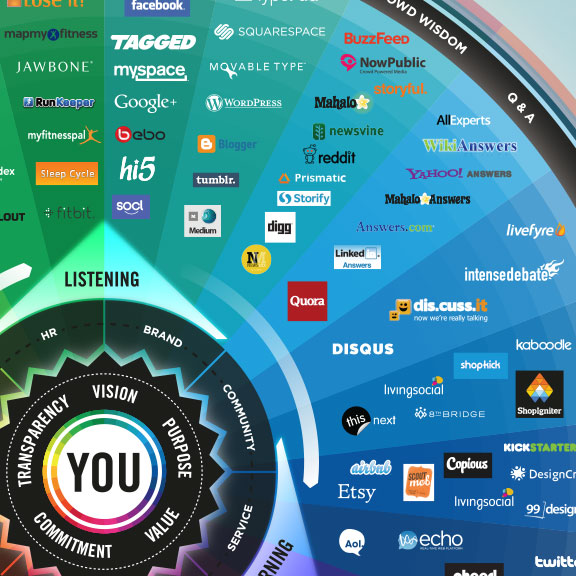
The Conversation Prism 4.0 for 2013 closeup

The design highlights the major companies in 26 different categories of social networking services.  This update loses the flower-like design style of the last three versions, and changes to a more straightforward circle with equal sized pie slices.

The inner circles have always been a little confusing for readers and marketers because the intent is that the inner labels can be adjusted depending on the user.  They don’t necessarily relate specifically to the services they are located near in the outer slices.

As a snapshot of the current social media landscape, this is a fantastic tool for marketers to consider the tools and services they want to engage for any particular campaign.  Three years was too long to wait for an update, since this landscape is changing and evolving very quickly.  That’s why 122 individual services were removed and 111 services were added. 
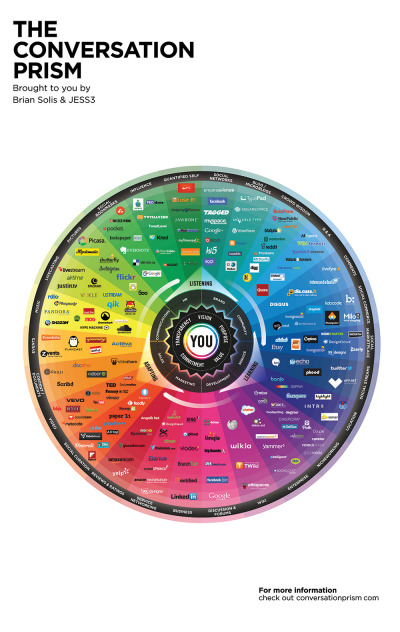
The Conversation Prism 4.0 for 2013 poster

The Conversation Prism 4.0 is available as a free high resolution JPG image download (great for computer wallpaper/desktop) of for purchase as a 22”x28” wall poster for $19.

Thanks to Jarred for sending in the link!  Also found on Mashable and The Next Web.


Thursday
Jul042013

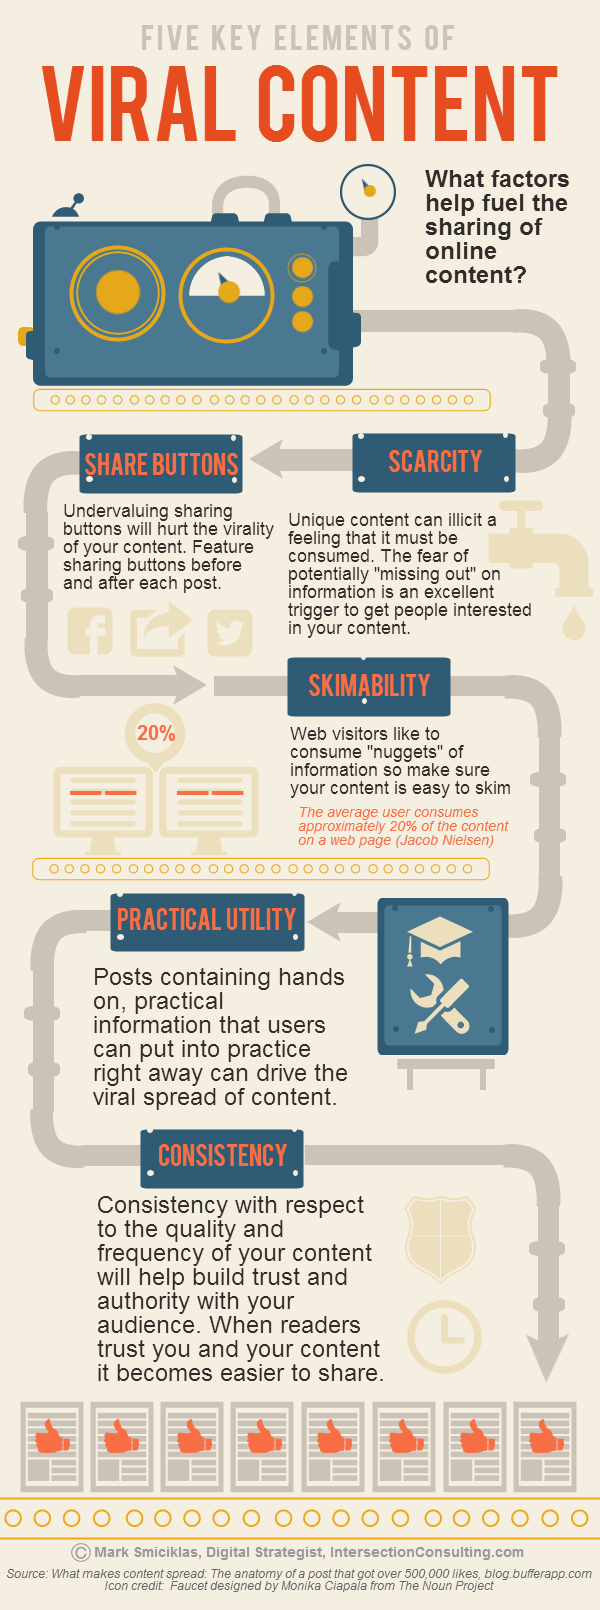
5 Key Elements of Viral Content

Mark Smiciklas from Intersection Consulting and author of The Power of Infographics, designed this helpful infographic The Five Key Elements of Viral Content.

The goal of every content marketer is to have his/her information shared across digital channels by their audiences. This is often easier said than done. What factors contribute to people sharing the content they consume online?

In researching the content for this infographic I came across a post in my Delicious archive that helps answer this question. Leo Widrich over on the Buffer Blog wrote a great post about what makes content spread. In it, he analyzes some of the elements that helped one particular blog post get over half a million likes. He also references an interesting research paper about what makes online content go viral.

This infographic highlights five key elements of viral content: scarcity, share buttons, skim-ability, practical utility and consistency. Are there any others you would add? The comments are yours.

Originally posted on Social Media Explorer

I would like to see the URL links to the sources and to the infographic landing page in the footer of the design so they travel with the infographic image as it gets shared across the Internet.