About
Randy Krum
President of InfoNewt.
Data Visualization and Infographic Design

Infographic Design

Infographics Design | Presentations
Consulting | Data Visualizations

DFW DataViz Meetup

Join the DFW Data Visualization and Infographics Meetup Group if you're in the Dallas/Fort Worth area!

Search the Cool Infographics site

Custom Search

Subscriptions:


Feedburner

The Cool Infographics® Gallery:

How to add the
Cool Infographics button to your:

Cool Infographics iOS icon

- iPhone
- iPad
- iPod Touch


Read on Flipboard for iPad and iPhone

Featured in the Tech & Science category

Flipboard icon

Twitter Feed
From the Bookstore

Caffeine Poster

The Caffeine Poster infographic

Entries in how-to (67)

Wednesday
Oct102018

4 Ways to Set Up Your Talking Head Shots

4 Ways to Set Up You're Talking Head Shots infographic

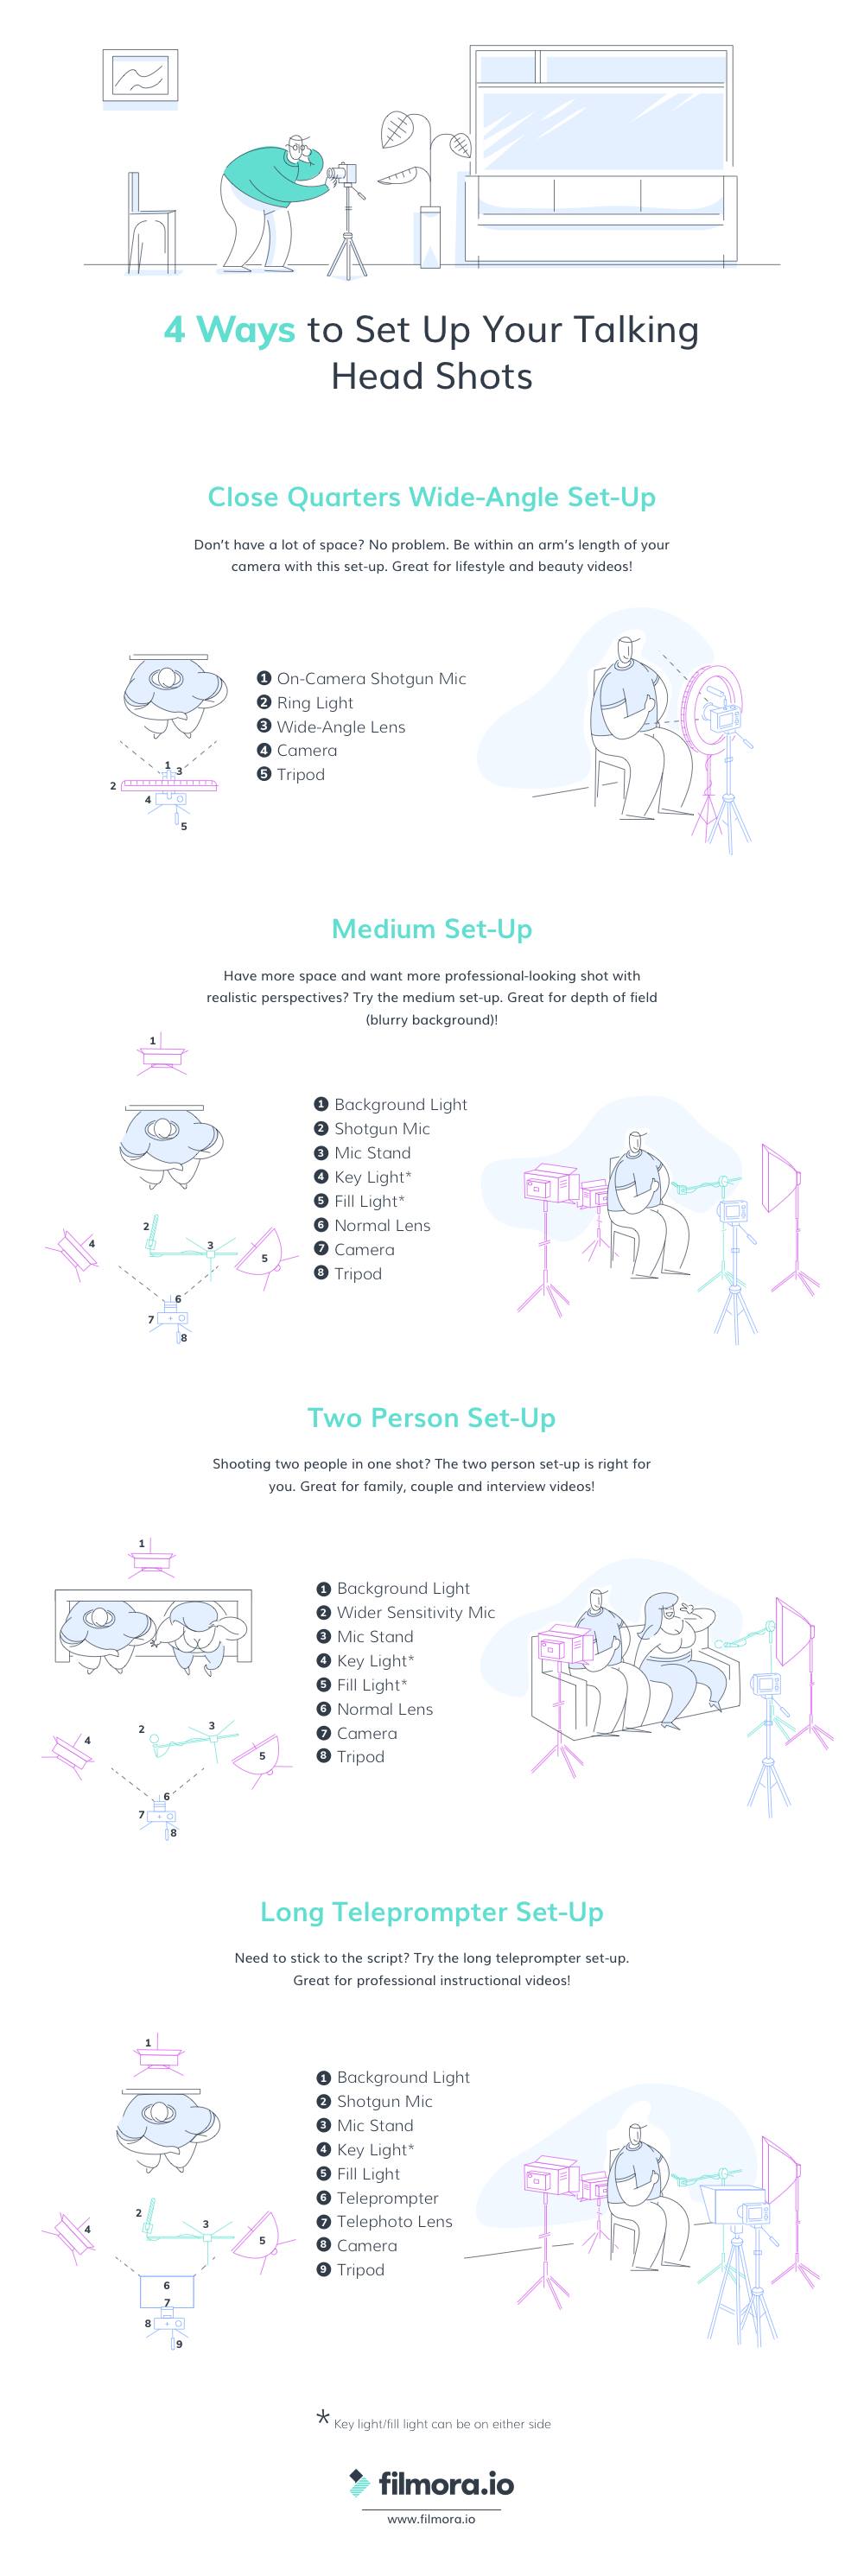
When you have something important to say, the last thing you want to stress about is your camera set up. Filmora.io has created the 4 Ways to Set Up Your Talking Head Shots infographic as a tool for aspiring YouTubers. The infographic can be used to help determine which camera set-up to use and the equipment required for it.

A big part of being a YouTuber involves talking to the camera. How you set up your talking-head shot depends on many factors, including how much space you have, what kind of look you’re going for, and how many people you want to fit in one frame. Here are four ways to set up your talking-head shots for YouTube.


Thanks to Erica for sending in the link!

Monday
Aug062018

An Introduction to Hydroponics

An Introduction to Hydroponics infographic

Hydroponics is a method of growing plants without soils. An Introduction to Hydroponics infographic goes over the benefits of using the technique, and a couple of different methods you could use. It is a great visual explanation of each setup and could really come in handy for any newbies interested in the field. Just make sure you read the section on what plants are best for hydroponics! You can find the full details at Green and Vibrant

Hydroponics is a dirt-free, space-saving, water-effective method of growing soilless.

This practice is not new. In fact, the earliest records of Hydroponics dated back to the ancient civilizations. And modern Hydroponics has been used widely in the commercial greenhouses as well as at home for over 30 years.

If you're just getting started with Hydroponics, or you're looking to hone and your knowledge and skills.

You come to the right place.

In this guide, you'll learn about the most important details about Hydroponics and all the basic knowledge to set up a year-round hydroponic garden of your own.

Read more at https://www.greenandvibrant.com


Found on Green and Vibrant

Friday
Apr132018

Creating Clickable Social Cards

Creating Clickable Social Cards infographic

The How to Create Clickable Social Cards infographic walks you through the process of using the AnyImage.io site to create social media cards for any of the major social media platforms, such as Facebook, Twitter, Google+ and LinkedIn.

AnyImage is a unique web-based tool that enables you to transform regular images into clickable social cards, linking to any web page of your choice. The cards can be shared on a number of social platforms including Facebook, Twitter, LinkedIn and Google+ 

study by Facebook themselves reported that users were able to increase traffic from the platform by a whopping 250%, simply by using clickable social cards. Thanks to AnyImage, you can begin creating your own cards in just a matter of seconds (for free). 

We’ve created this useful infographic (below) to explain exactly how AnyImage works. Enjoy! 

This is a fantastic use of an infographic as How-To explanation for a company's product or service! Most products have at least a small learning curve, and a clear infographic design can help get your customers over that initial hurdle using your service.

Thursday
Nov172016

Men's Hats - The Complete Guide

Men's Hats - The Complete Guide infographic

Can't find a hat that looks good on you or don't even know where to start? Samuel Windsor created the Men's Hats - The Complete Guide infographic to clear the confusion on the matter. Feel confident enough to talk the talk at a hat shop, as well as pick the right style for your face shape.

Hats give a man distinction, confidence and protection. This diagrammatic guide will help you find the perfect hat to top your appearance. Confused about what crown to request? Will a flat cap suit a square face? Do you know your bowlers from your boaters?

Nice clean design that does a great job of "show, don't tell". You understand the differences much faster with a visual design like this.

This is also a good design example of a Long Online Lifespan. Hat shapes, styles and face shapes don't change every year. This infographic will be popular and relevant for years to come.

Two things missing from the footer of the design:

  • URL to the origial landing page and website. How can readers find your website?
  • A copyright or Creative Commons license

Thanks to Matt for sending in the link!

Wednesday
Aug242016

The Right Wine in the Right Kind of Glass

The Right Wine in the Right Kind of Glass infographic

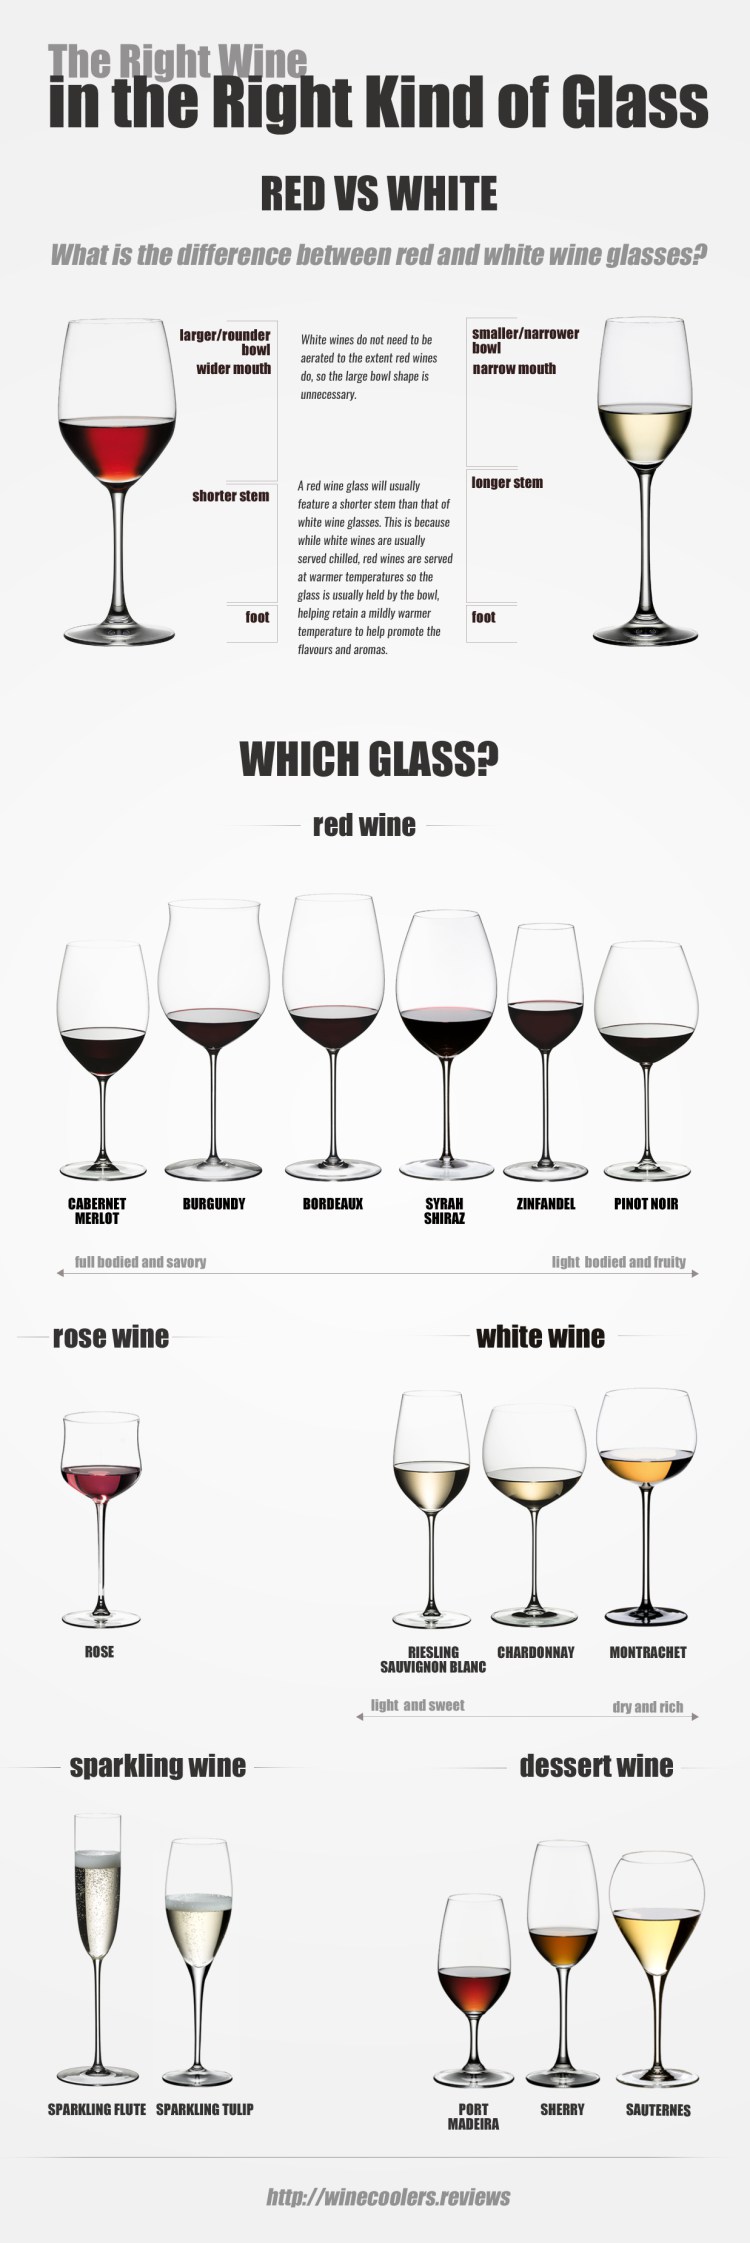
Just like how specific wines bring out the best flavors in certain foods, specific wine glasses bring out the best characteristics of each wine. The Right Wine in the Right Kind of Glass infographic from Wine Coolers starts off by showing us some general characteristic differences between red and white wine glasses, then shows us the correct wine glass to pair with each wine.

Have you ever wondered why there are different kinds of wine glasses? This article will illuminate the reason for different sizes and differently shaped wine glasses and help you smell the rich aroma of the right kind of wine enjoyed out of the right kind of glass for that wine.

Each type of wine has its own characteristics that stimulate the senses. These characteristics differentiate them from other wines. Every wine should be served in the most appropriate wine glass that will effectively enhance our reception of its unique characteristics.

Wine glasses come in a variety of shapes, and like wines, they too have different characteristics or features that make them different. Some wine glasses are made specifically for wines that come from specific types of grapes, or from certain regions. A wine glass’ shape is designed to bring out the best in the wine that it’s made for. So certain wine glasses can really affect the flavor of specific kinds of wines.

You can read more details about which wine to pair with each glass at http://winecoolers.reviews.

Thanks to Kathrin for sending in the link!

Tuesday
May242016

Massive Infographic of Star Wars A New Hope

Star Wars A New Hope Infographic

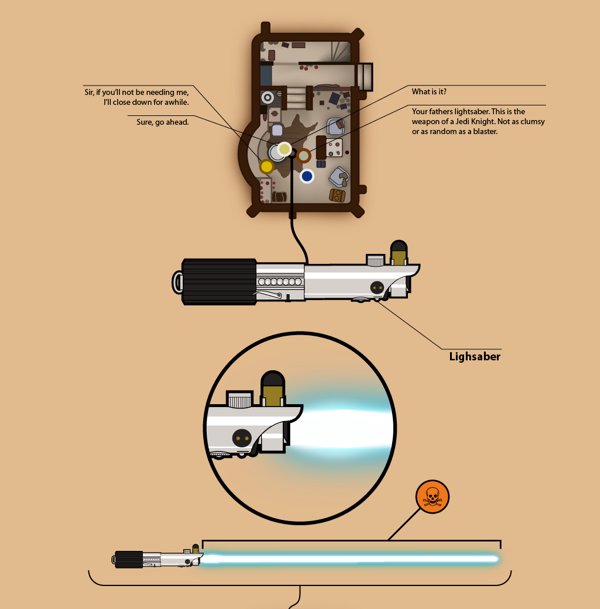
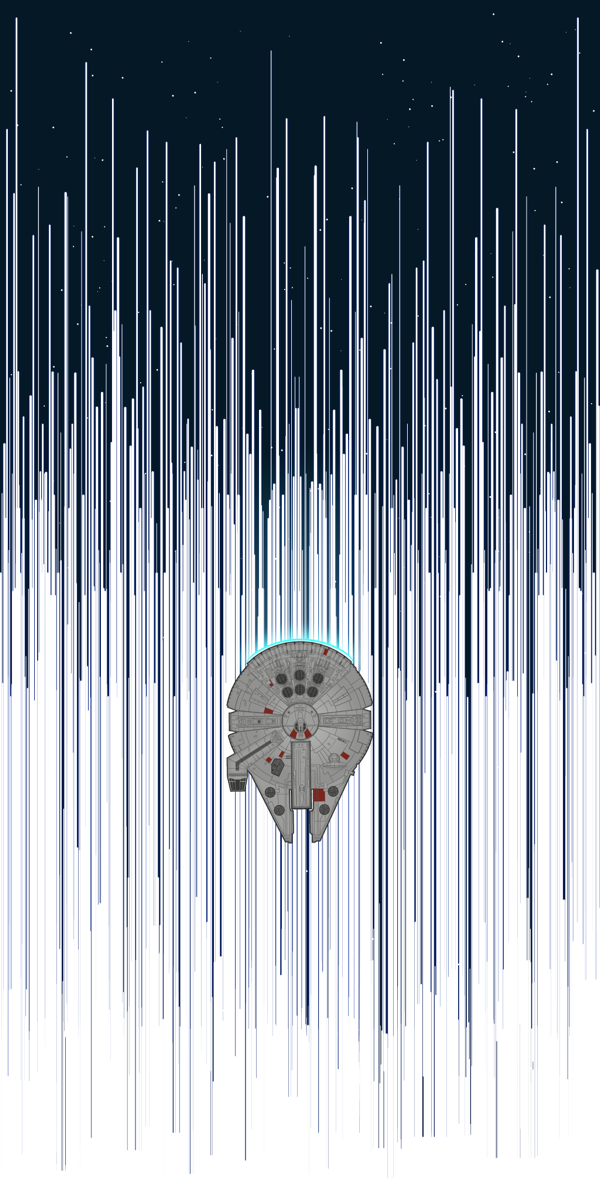
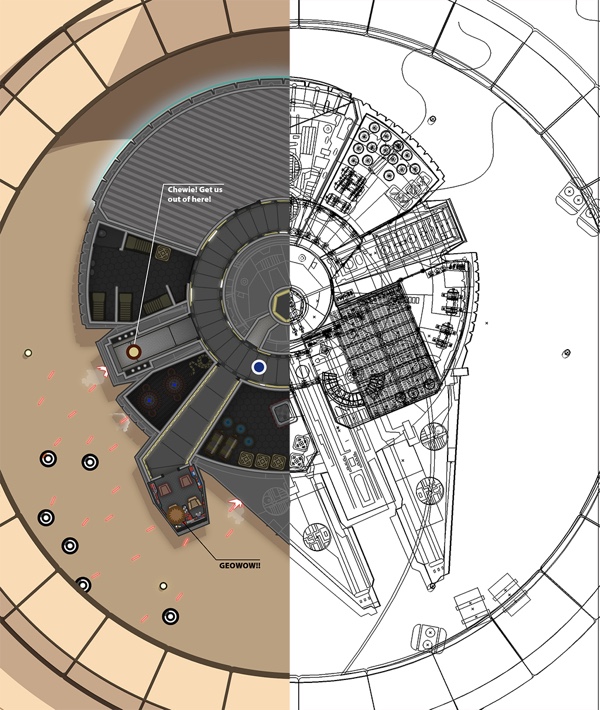
This is a massive infographic depicting the entire story of Star Wars IV: A New Hope. Printed it measures 123m long (over 400ft). Online this infographic is 1,024 pixels wide by 465,152 pixels long! Designed by illustrator and graphic novelist Martin Panchaud, it was designed in Adobe Illustrator CC.

SWANH.NET is an adaptation of Star Wars Episode IV in a style that was inspired by infographics. One story in one piece of 123 meters length.

It was created with Adobe Illustrator CC in 2016. Its exact measures are: 1024 x 465152 px / 27 x 12307 cm / 10.6 x 4845.3-inch

This long ribbon reminds the ancient Chinese script rolls that had to be rolled in and rolled out simultaneously in order to be read. I like this stretch between ages, cultures, and technologies.

However, internet likes short stories and summaries, quickly understandable contents. With my work I aimed to create a contrast to that.

These are only a few small pieces. You go immediately to the SWANH site to view the entire, fantastic infographic!


Martin also posted a number of great images as a Making Of feature to show the development process of the infographic.

Monday
May092016

Kitchen Trends to Consider and Avoid

Kitchen Trends to Consider and Avoid infographic

Kitchen Trends to Consider (and Avoid) for Your Remodel is a comprehensive infographic from The Home Depot, covering the current kitchen design trends and top reasons to remodel your own.

A kitchen makeover can seem daunting and out of reach, but simple updates to cabinets, countertops, and colors can help an old and ignored kitchen feel fresh, fashionable, and, best of all, functional.

The following infographic from The Home Depot gives expert designer Kerrie Kelly’s tips on the hottest trends in new cabinets, countertops, colors and accents, and pointers for how to take your kitchen from drab to fab. Kelly’s design advice (don’t be afraid of color!) as well as warnings against what to avoid (go easy on the patterns), will give you all the latest in kitchen remodel trends. From the light, airy look of white cabinets, to the natural, organic look of elements like limestone and forestry, there is a trendy style for every taste.

And if keeping up with DIY television shows isn’t enough reason to get started, we’ve got three essential reasons for you to roll up your sleeves and get moving on your kitchen renovation. An updated kitchen affects your biggest investment — your home — as well as your quality of life. (Hint: Did you know that 90 percent of people report a greater desire to be home after a remodel?) Read the infographic for more reasons to get started, and visit this remodel planning guide for actionable ideas and advice.

Generally, I recommend against using photos in an infographic design, but the use of photos here is crucial to communicating the different design trends and kitchen looks. The combination fo photos with simple, one-color data visualizations works very well, and clearly communicates the different aspects of each design and function.

This is also a fantastic case-study in choosing an infographic topic that is compatible and related to your business. This isn't an advertisement for Home Depot, linking to specific products on their site. Instead, it's informative to consumers and actionable information they use to make their own purchase decisions. The information included is valuable to everyone that has a kitchen, and is likely to be shared often.

Thanks to The Daily Meal for sharing the infographic!


Wednesday
Feb032016

Men's Dress Codes Made Simple

Men's Dress Codes Made Simple infographic

Men's Dress Codes Made Simple from Samuel Windsor will answer your questions about men's attire for any function.

Want to look the business? This visual guide to men’s dress codes helps you guarantee an impeccable appearance at any function.

Why can’t you wear a watch with white tie? Is a pinstripe suit or blazer best for business? Are brogues or Oxford shoes most suited to smart casual?

Our infographic below solves these and other dress code conundrums in seconds.

Simple use of illustrations to help make a dry topic significantly more engaging for readers. Infographics don't always need big, numerical datasets to be able to visualize information.

Thanks to Jenny for sending in the link!

Wednesday
Oct212015

How To Make Your Movies Better

How To Make Your Movies Better infographic

How to Make Your Movies Better is a great infographic from Moviehouse Eatery, which is a new movie theater concept in Texas.

This is a fantastic use of an infographic, to show the simple step-by-step process of buying tickets and going to the movies. Using infographics as how-to information about your products and services is a highly effective way to communicate directly to your customers.

Notice how the simple design makes the overall process feel easy before you even start to read any of the instructions. It's not cluttered with a lot of text, which keeps this design easy to read.

I would recommend making the overall length of the infographic shorter. This one includes large illustrations, nicely spaced out, but the length can be intimidating. I would keep the content the same, but make the illustrations smaller to reduce the length.

Also, the footer should include a copyright (or Creative Commons) license statement, and the URL to the infographic landing page so readers can find the original, full-size version.

Thursday
Sep032015

The Psychology of Colors in Marketing

The Psychology of Colors in Marketing infographic

The Psychology of Colors in Marketing infographic is a comprehensive guide to what a colors means in marketing materials. The infographic, created by Homestead, not only covers the meanings of the colors but how to use contrast and the intensity as well. The last bit gives examples of how big corporations use the colors to their advantage.

Do you feel inexplicably calm when surrounded by a sea of blue water or a forest of green trees? Perhaps you feel a slight agitation when looking at a red stop sign or stop light?

The reality is that color has a powerful psychological impact - and that this affect can be harnessed by webmasters and digital marketers alike to promote different buyer behaviors online. To learn more, check out our new "The Psychology of Colors in Marketing" infographic:"

The infographic is a little text heavy, but does a good job of using black text and icons for the descriptions so the colors only appear when they are meant to convey meaning in the infographic as an example.

The footer should include a copyright (or Creative Commons) license statement and the URL web page address directly to the infographic landing page so readers can find the original full-size version when bloggers repost the infographic without a link. I always include a link back to the original but most do not.

Found on http://www.digitalinformationworld.com