About
Randy Krum
President of InfoNewt.
Data Visualization and Infographic Design

Infographic Design

Infographics Design | Presentations
Consulting | Data Visualizations

DFW DataViz Meetup

Join the DFW Data Visualization and Infographics Meetup Group if you're in the Dallas/Fort Worth area!

Search the Cool Infographics site

Custom Search

Subscriptions:


Feedburner

The Cool Infographics® Gallery:

How to add the
Cool Infographics button to your:

Cool Infographics iOS icon

- iPhone
- iPad
- iPod Touch


Read on Flipboard for iPad and iPhone

Featured in the Tech & Science category

Flipboard icon

Twitter Feed
From the Bookstore

Caffeine Poster

The Caffeine Poster infographic

Entries in twitter (42)

Thursday
Mar102016

The 2016 Social Media Image Sizes Cheat Sheet

The 2016 Social Media Image Sizes Cheat Sheet infographic

Sometimes, one image size doesn't fit all. The 2016 Social Media Image Sizes Cheat Sheet from Hub Spot will help you optimize your images for all of your social media sites.

When you're designing cover photos, graphics, and other social media assets, sometimes knowing the bare bones image dimensions isn't enough.

What if you wanted to place text or an arrow on your Facebook cover photo without it getting covered by the profile photo? And what about the shared link thumbnails on Facebook or in-stream photos on Twitter ... how big should those be?

These change so often, a current infographic guide like this is always helpful.

Friday
Dec042015

What Social Media Platforms Are Best Suited For Your Business

It doesn't matter if you have a well established business or a new one, everyone can benefit from learning to use social media better. But which platform is right for you? The What Social Media Platforms Are Best Suited For Your Business infographic from Quick Sprout helps you determine which platform your target audience uses so you can save yourself some time.

With all the social media sites available today, which ones should you leverage? In an ideal world, you would use them all. As a small business, however, you don’t have enough time and money to do so.

With your limited resources, which social media platform would you pick?

If you think Facebook and YouTube are your best bets because they are most popular, think again. Just because a site is popular doesn’t mean it is a good fit for you business.

To help you decide which social media platform is best suited for your business, I’ve created an infographic that explains what social sites you should be leveraging based on real data.

Good use of colors and logos to differentiate the different services. This infographic is a good example of the difference to readers between visualized data and text-only data. Readers' attention will gravitate to the visualized statistics, and any numbers shown as just text are often skipped and considered to be secondary information.

Thanks to Juntae for the link!

Friday
May082015

Stop Being A Social Loser

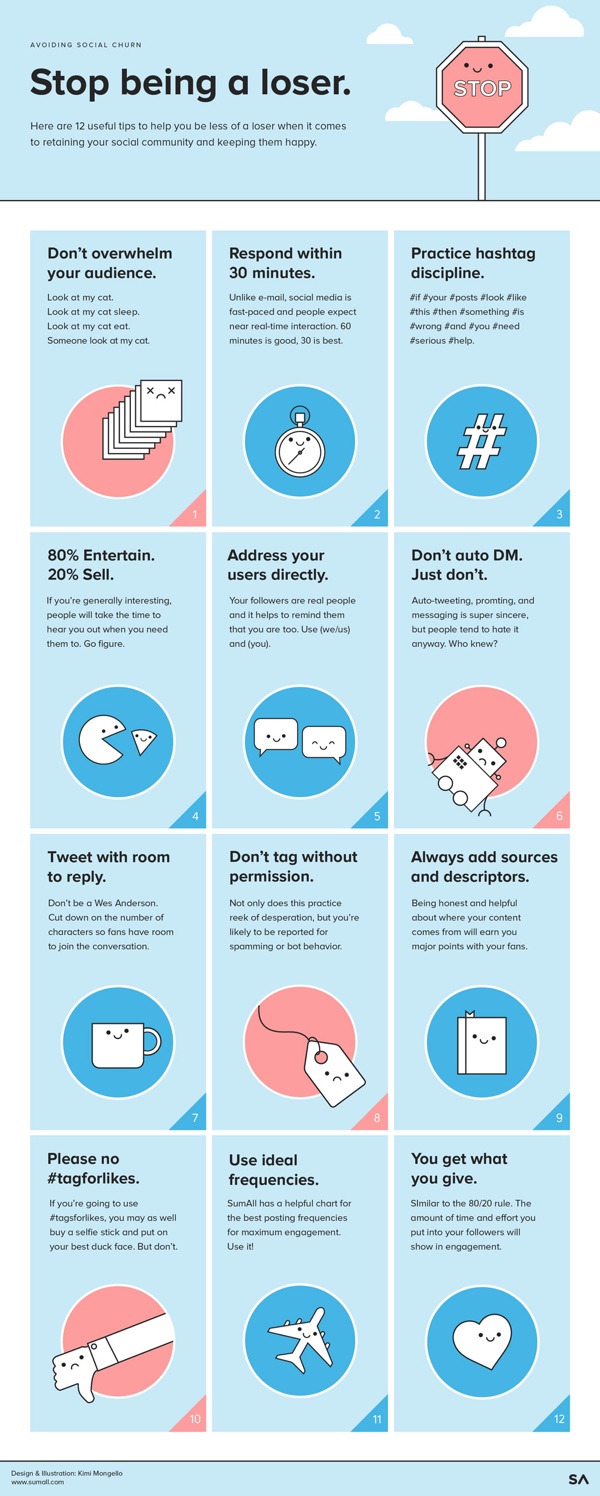
Good advice from SumAll in their new infographic Stop Being a Loser: 12 Tips to Avoid Social Churn

Nobody loves cats more than I do. Chunks of my day are routinely lost looking at cat GIFs, videos, photos, anything to satisfy my admittedly unhealthy love for these furry companions. But even I have my limits.

If I’m browsing my Instagram feed and I see somebody post five photos in quick succession of their cat, that’s a surefire way to get an unfollow from me – and this is coming from somebody that dresses up their cat as a different Disney character every Halloween. So, step away from the hashtag, don’t even think about taking out that selfie stick, and check out this infographic for 12 tips on what you should and shouldn’t do on social media to get a loyal following.

I would have liked to see more data about social churn. This is a lot of text with illustrations for each point. Really good information, but I know SumAll has data to back these tips up.


Monday
Dec012014

The Internet Is a Zoo: The Ideal Length of Everything Online

The Internet Is a Zoo: The Ideal Length of Everything Online infographic

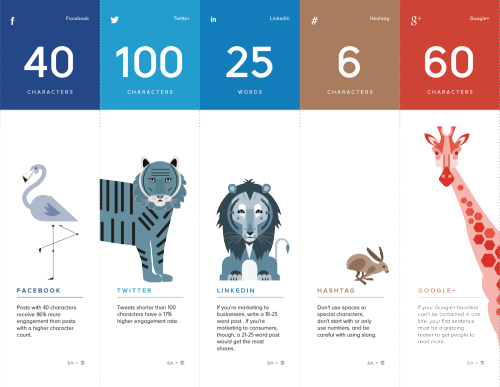
Short, sweet, and to the point! The Internet Is a Zoo: The Ideal Length of Everything Online infographic from a partnership between SumAll and Buffer explains the fine line between when extra words are helpful, and when they become too much information. Whether you are posting a facebook post to your friends, or a blog post to your avid followers. This infographic will help make sure your posts reach the most readers!

Have you ever woken up in cold sweat in the middle of the night wondering exactly how many characters long a tweet should be to get the most engagement, or how many words long a blog post should be so that it actually gets read?

Ok, that may just be me, but knowing exactly how many characters a Facebook post should be or what the ideal subject line length is should be endlessly fascinating (and useful) information to most people who are active on social media.

So, to make all this data digestible and easy to understand, we partnered with our awesome friends over at Buffer to produce an infographic that shows the optimal length of pretty much everything on the internet.

Great design that tells one story really well, totally focused on the length of posts on different social media platforms. The footer should include the URL to the infographic landing page so readers can find the full-size original when the infographic is posted without links.

They went one fantastic step further, and created a more print friendly version near the bottom of the landing page that spans multiple printed pages. The pages are formatted to fit on standard Letter-size paper or in presentation slides. This is a great example of using the research and design from the original infographic to share the information in additional formats.

Infographic was found on SumAll

Monday
Oct072013

The Perks of Working at Google, Facebook, Twitter and More

The Perks of Working at Google, Facebook, Twitter and More infographic

When you get on your computer and pull up Google or Facebook, do you ever wonder about the people that make the site run? Resumebear put together an infographic for Mashable called The Perks of Working at Google, Facebook, Twitter, and More to share information like “Amenities in the Office” or “Medical and Retirement Benefits”. After reading about these jobs, you might decide to apply there yourself! 

It’s no secret that Silicon Valley has a problem finding the talent it needs to fill all the high-tech jobs available in the region. The area expects jobs in information and communications technologies to grow 15 percent during the next two years, Menlo Park Patch reports.

The trick for many employers is how to attract — and keep — the best talent in the field. Beyond handsome salaries, many tech firms also lavish their workers with benefits, leading to some unique and even quirky offerings.

Such corporate perks can be as simple (and routine) as Facebook’s discounted gym memberships or the onsite gyms at search-engine giant Google and Gaia Online, an animation-themed social networking site.

Great use of icons and illustrations to show a comparison between company benefits!

Found on mashable.com!

Friday
Jul122013

Battle of the (Social) Sexes

Battle of the (Social) Sexes infographic

The Battle of the (Social) Sexes infographic from InternetServiceProviders.org explores some of the demographic data behind social media.

You’ve no doubt heard the old, oft-quoted adage, “men are from Mars, women are from Venus,” used to denote the fact that men and women may not always see completely eye to eye. While this light-hearted statement isn’t taken literally, when it comes to the virtual world of Internet interactions, similar sentiments may be formed surrounding the different ways men and women use social networking. While the majority of adults in the US are plugged into some sort of social media outlet, not all of them are used in equal measure, and not all of them are used by both genders equally. For instance, the average Google+ user spend just three minutes per month on the network, while the average Facebook user will spend 405 minutes per month updating statuses, posting pictures, and checking out others’ profiles. So what can be learned about men and women in the world of the web? As is turns out, men and women tend to dominate very different social media networks. The following infographic takes a look at some of the differences between male and female-dominated social media sites: How many users each one has, as well as how they interact.

There’s so really good data they have compiled in here, and most of the data visualizations are easy to understand.  I would not have expected to see that Twitter has 40 million more female users each month.

There are a handful of minor tweaks that would help improve the design:

  • The salmon/orange/peach color for women is unexpected compared to the traditional pink.
  • Go ahead and use the official Twitter and Facebook icons.  No need to design their own.
  • The pie slices for time spent would work much better with colors that are more distinct.  The different shades of gray are very hard to differentiate.
  • For the pie charts, the text label should be placed next to the pie slice its describing, instead of the opposite side as shown in this design.  Flipping the pie charts horizontally would fix that easily.

I appreciate the clear Creative Commons license in the footer, but the URL to the original infographic lansing page is missing.  Since the infographic image file is shared by itself, the URL always helps readers to find the original.

Found on Ragan’s PR Daily


Tuesday
Apr022013

Social Network Overload

Social Network Overload infographic

How often have you checked your social media accounts today? Feeling unplugged is a problem for many people.  Social Network Overload from mylife.com talks about how people are addicted to social media, and what they rather do than give up their Internet lifeline. 

Afraid you’re missing something important on your email, Facebook, Twitter, or other accounts? You are not alone. Two out of three people feel the same way. In the same survey, three out of five people wished there was a solution to monitor their various communication options.

Here’s an interesting infographic based on a survey by Harris which illustrates a growing trend—social media overload

The isometric illustrations of people and the data visualizations are fun, and the light-hearted data makes this one appealing to share.  The design is missing the URL to the infographic landing page, so that readers can find the original when they see thie infographic posted on other sites.

Found on The Undercover Recruiter and Visual Loop.

Friday
Feb222013

Top 250 Internet Retailers Q3 2012 Update

Top 250 Internet Retailers Q3 2012 Update infographic

Top 250 Internet Retailers Q3 2012 Update infographic from the Campalyst blog

Back in May we published an infographic about Top 250 Internet Retailers’ presence on social media. The infographic was perceived really well by our readers, customers and the media; thanks a lot to all the people sharing it on Facebook, Twitter, Pinterest and their blogs!

Now we are happy to present you with the Q3 update! Spoiler: those were two incredible quarters for Pinterest! Amazing growth in terms of the number of brands building their presence on Pinterest and the size of their communities!

I like the color scheme and the variety of data visualizations used in this infographic.  Bars, icons, arcs and proportional circles.  The use of the Internet retailer logos in the circles is especially effective.

I wish the Social Media site logos had been used, especially in the first three sections.  I shouldn’t have to read the text and match the color to figure out what the visualization represents.  That’s too much work for the reader.  How many people does each of the people icons represent in the “How Many Followers Do They Have?” section?  The lines look “relatively right”, but the number of icons seems to have no relationship to the actual numbers shown.

The footer needs both a copyright statement (or Creative Commons license) and the infographic landing page URL so readers can find the original when they see this posted on other sites (like this one!).  Many bloggers are not good about linking back to your original site correctly, and you want your audience to be able to find it easily.

Found on Fresh Peel and Visual Loop


Tuesday
Jan082013

The Ultimate Complete Final Social Media Sizing Cheat Sheet

The Ultimate Complete Final Social Media Sizing Cheat Sheet infographic


The Ultimate Complete Final Social Media Sizing Cheat Sheet by LunaMetrics is a huge (and very long) informational infographic that shows the readers all of the important image sizing requirements for the major social networks.

In June of this year, we published an infographic listing all of the sizing information for images on Facebook, Twitter, Google+, and Pinterest. It was a wildly successful piece of content, totally blowing our expectations out of the water. Unfortunately, while its popularity has flourished, nearly every social network instituted changes to their image sizes, rendering most of the information on the infographic out of date.

We knew we needed to update the information on the cheat sheet, but we weren’t comfortable with simply adjusting one or two figures on the blog post and leaving it as-is. We’d also received a lot of feedback, both on the design and information it contained. We decided to redesign the entire sheet and incorporate a few more social networks.

We also decided to permanently redirect the old sheet here, so that shared tweets, pins, likes, and so on, would lead to the correct sizing dimensions. Additionally, as sizing changes are implemented across social networks, we’ll actively update this sheet – meaning that if you use the embed code at the bottom to share this sheet on your own site, the image will automatically update with changes as they are rolled out. No more out-of-date information.

I love that all of the sizes are shown in correctly proportional rectangles!  Based on their claim, this infographic should also update correctly as they revise it to match the ongiong changes from all of the social networks.  

Some color of the official logos of the different social media networks at each section break would have been helpful to the reader.  The light typeface used at each section break is hard to distinguish from the rest of the design.

Found on Social Media and Social Good

Monday
Nov262012

What Makes a Travel Writer?

What Makes a Travel Writer? infographic

For those who would love to travel and write, the What Makes a Travel Writer? infographic from hotelclub.com is the infographic for you. This infographic covers the ages and careers of these writers, and also what technology they use.

If you’ve ever wanted to become a travel writer, you’ve probably wondered about the tools and resources the pros use to make their jobs possible. The trade secrets of those who successfully turn international adventures into paychecks are an enticing mystery. Does the key lie in social networking? Is it finding the right technology that makes all the difference? Or have these professionals stumbled onto some obscure websites that the rest of us are ignorant about?

Unfortunately, there isn’t one explicit answer that will transform you into a travel writer overnight. It is a combination of all of these things that enable the professionals to do their jobs well enough to afford a warm meal and their next plane ticket.

So to gain some insight into the tricks of the trade, and hopefully get you one step closer to your dream job, we surveyed some of the best travel writers on the web about their working habits. We got the scoop on Twitter from three of the most ‘Followed’ travel tweeters in the business (@Paul_Steele@TravelEditor, and @DaveDTC); found out that Paris and NYC are two of the best places in the world to find (marketable) inspiration; and were warned against going any where near Birmingham or Malaga.

Find out what else we learned in our detailed infographic.

I really like this design.  I like that the infographic keeps the same, simple color scheme throughout to match the colors in the header. However, it lacks a border or a background color to help frame the infographic on a webpage with a white background.  The white background creates uncertainty of where it actually ends.

Most of the information is in percentages; however, it is all conveyed in different visual formats.  The stacked bars, pie charts and doughnut graphs correctly show them in comparison to the complete 100%.  The partially shaded shaped of film canisters, people icons and the world map aren’t quite correct.  The readers see the area colored of an object, and because of the odd shapes the designer had to guess the correct shading by just changing the height.  It’s close, but not actually correct.

A few other suggestions I would make:

  • The two age groups compared with the man & woman icons aren’t related to each other, so the comparison isn’t helpful information.
  • For the Male-Female comparison comparison in Travel Career, the icons need to be the same width for them the be accurate.  Visually it looks like 75% is at least double 53%, which obviously isn’t true.
  • The Tablet Brands statistics of “100% of male travelers use Amazon Kindle” isn’t support by the data to the left, and is a highly unbelievable stat.  
  • When lining up rows of icons, like in Blogging Platforms, the design should always use rows of 10 icons.
  • I’m sure the last circle in the Twitter Usage section was supposed to be <100 Twitter followers instead of >100.
  • There should be a URL at the end of the infographic linking to the original full-size version.

Thanks to Ally for sending in the link!