About
Randy Krum
President of InfoNewt.
Data Visualization and Infographic Design

Infographic Design

Infographics Design | Presentations
Consulting | Data Visualizations

DFW DataViz Meetup

Join the DFW Data Visualization and Infographics Meetup Group if you're in the Dallas/Fort Worth area!

Search the Cool Infographics site

Custom Search

Subscriptions:


Feedburner

The Cool Infographics® Gallery:

How to add the
Cool Infographics button to your:

Cool Infographics iOS icon

- iPhone
- iPad
- iPod Touch


Read on Flipboard for iPad and iPhone

Featured in the Tech & Science category

Flipboard icon

Twitter Feed
From the Bookstore

Caffeine Poster

The Caffeine Poster infographic

Entries in YouTube (11)

Wednesday
Oct102018

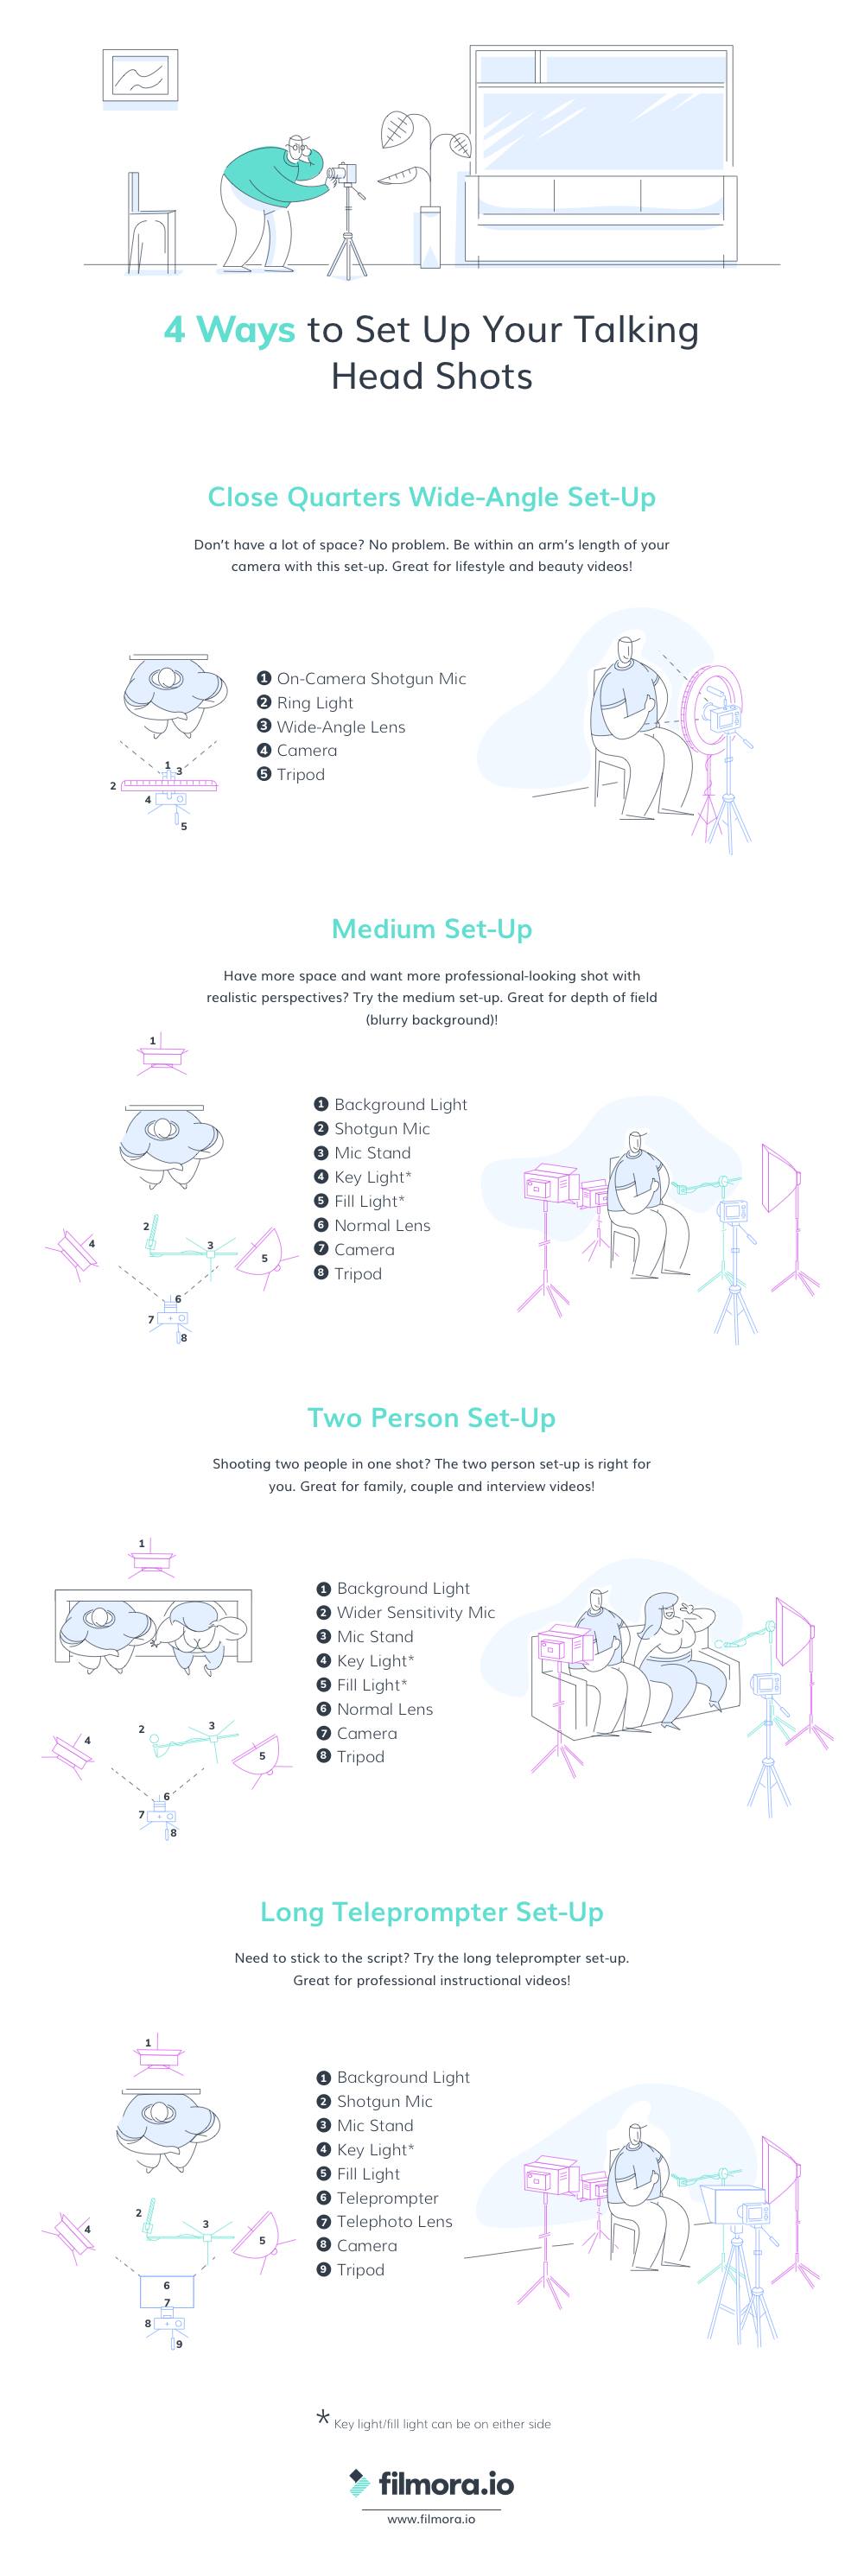
4 Ways to Set Up Your Talking Head Shots

4 Ways to Set Up You're Talking Head Shots infographic

When you have something important to say, the last thing you want to stress about is your camera set up. Filmora.io has created the 4 Ways to Set Up Your Talking Head Shots infographic as a tool for aspiring YouTubers. The infographic can be used to help determine which camera set-up to use and the equipment required for it.

A big part of being a YouTuber involves talking to the camera. How you set up your talking-head shot depends on many factors, including how much space you have, what kind of look you’re going for, and how many people you want to fit in one frame. Here are four ways to set up your talking-head shots for YouTube.


Thanks to Erica for sending in the link!

Thursday
Mar102016

The 2016 Social Media Image Sizes Cheat Sheet

The 2016 Social Media Image Sizes Cheat Sheet infographic

Sometimes, one image size doesn't fit all. The 2016 Social Media Image Sizes Cheat Sheet from Hub Spot will help you optimize your images for all of your social media sites.

When you're designing cover photos, graphics, and other social media assets, sometimes knowing the bare bones image dimensions isn't enough.

What if you wanted to place text or an arrow on your Facebook cover photo without it getting covered by the profile photo? And what about the shared link thumbnails on Facebook or in-stream photos on Twitter ... how big should those be?

These change so often, a current infographic guide like this is always helpful.

Monday
Feb152016

What Happens on YouTube in 24 Hours?

What Happens On YouTube in 24 Hours? infographic

What Happens on YouTube in 24 Hours? is an infographic that Pexeso created after taking an in-depth look into daily uploads on YouTube during the month of October 2015. Pexeso is a company that is designed to help you find your videos from multiple platforms across the web so you can better understand your virality.

It’s no secret that video is quickly becoming the #1 priority for both social media platforms and marketers alike. As consumers, we spend more and more time glued to our smartphones watching one video after another. By 2017, it is estimated that video will account for 74% of all internet traffic in the world, making the upcoming year make or break time for any company that’s betting on video. 

As competition heats up, some of the most well-known platforms have rushed to report impressive statistics. While they may be staggering, such numbers tend to be cherry-picked and don’t necessarily show the full picture. 

We at Pexeso are committed not only to delivering the best possible service to our customers, but also bring more transparency to this inherently non-transparent market. As we independently crawl many popular sites, we've been able to uncover some remarkably interesting, in-depth insights that we want to share. 

I appreciate seeing most of the statistics visualized, but a couple of the visuals do not accurately represent the data.

  • The Video Uploads by Category took a creative spin on what should have been a quarter pie chart. By taking the slices out of a triangle instead, the area of the slices at the ends is oversized and is misleading to viewers.
  • The Languages visual of sections on the tongue, under represent the size of the values by only using the height in an odd shape. The lowest section where the tongue is narrower don't have enough area to accurately show the data.
  • The 3D stacked bar in the shape of a cake, way over emphasizes the 5% Taken Down by Users by also showing the area of the top of the cake.
  • The clock visual doesn't represent the data at all. It's confusing for readers to have evenly spaced ticks around the clock, but widely varying times in the text.
  • The citations for the data sources are missing from the infographic. They're listed on the landing page in text, but infographics are usually shared without the original text from the publisher.

Thanks to Lisa for sending in the link!

Friday
Dec042015

What Social Media Platforms Are Best Suited For Your Business

It doesn't matter if you have a well established business or a new one, everyone can benefit from learning to use social media better. But which platform is right for you? The What Social Media Platforms Are Best Suited For Your Business infographic from Quick Sprout helps you determine which platform your target audience uses so you can save yourself some time.

With all the social media sites available today, which ones should you leverage? In an ideal world, you would use them all. As a small business, however, you don’t have enough time and money to do so.

With your limited resources, which social media platform would you pick?

If you think Facebook and YouTube are your best bets because they are most popular, think again. Just because a site is popular doesn’t mean it is a good fit for you business.

To help you decide which social media platform is best suited for your business, I’ve created an infographic that explains what social sites you should be leveraging based on real data.

Good use of colors and logos to differentiate the different services. This infographic is a good example of the difference to readers between visualized data and text-only data. Readers' attention will gravitate to the visualized statistics, and any numbers shown as just text are often skipped and considered to be secondary information.

Thanks to Juntae for the link!

Monday
Dec012014

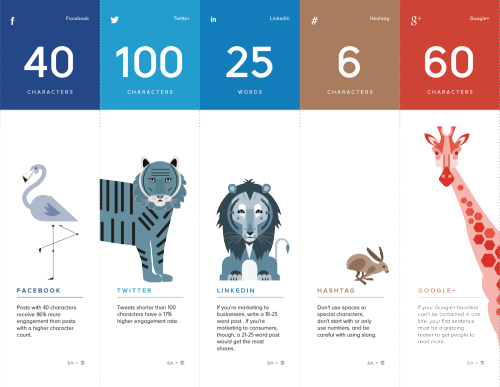
The Internet Is a Zoo: The Ideal Length of Everything Online

The Internet Is a Zoo: The Ideal Length of Everything Online infographic

Short, sweet, and to the point! The Internet Is a Zoo: The Ideal Length of Everything Online infographic from a partnership between SumAll and Buffer explains the fine line between when extra words are helpful, and when they become too much information. Whether you are posting a facebook post to your friends, or a blog post to your avid followers. This infographic will help make sure your posts reach the most readers!

Have you ever woken up in cold sweat in the middle of the night wondering exactly how many characters long a tweet should be to get the most engagement, or how many words long a blog post should be so that it actually gets read?

Ok, that may just be me, but knowing exactly how many characters a Facebook post should be or what the ideal subject line length is should be endlessly fascinating (and useful) information to most people who are active on social media.

So, to make all this data digestible and easy to understand, we partnered with our awesome friends over at Buffer to produce an infographic that shows the optimal length of pretty much everything on the internet.

Great design that tells one story really well, totally focused on the length of posts on different social media platforms. The footer should include the URL to the infographic landing page so readers can find the full-size original when the infographic is posted without links.

They went one fantastic step further, and created a more print friendly version near the bottom of the landing page that spans multiple printed pages. The pages are formatted to fit on standard Letter-size paper or in presentation slides. This is a great example of using the research and design from the original infographic to share the information in additional formats.

Infographic was found on SumAll

Friday
Oct042013

Advertisers, You Need YouTube

Advertisers, You Need YouTube is a motion graphic from MDG Advertising that shows many of the stats from successful YouTube video advertising campaigns.

While YouTube began as a source of online video entertainment, its massive popularity and mainstream prevalence has turned it into a major video advertising platform. To show why YouTube is now a very powerful and vastly important video marketing tool for advertisers, MDG Advertising created the following video. It shows the reasons, results, and revenue that are making YouTube a video marketing must for brands trying to catch the eye of audiences worldwide.

The video style is visually appealing, and has some fantastic statistics.

However, the design makes a common mistake we see in many motion graphic videos.  Big fonts are not data visualizations!  I noticed at least 20 different numbers shown to the audience in a really big font.  None of them were visualized to give them context for the audience.  Making the number value in big text and moving across the screen doesn’t make it any easier for the audience to grasp the meaning behind the data.

In data visualization and infographics design we know that visualizing the data always puts it into comparison to another number to provide the audience a frame of reference.  That helps the audience understand the scale of the numbers and how large or small they actually are.  Without that comparison in the design, the audience is left to try to compare the values to something they already know.

Thanks to Jarred for sending in the link!

Friday
Jul122013

Battle of the (Social) Sexes

Battle of the (Social) Sexes infographic

The Battle of the (Social) Sexes infographic from InternetServiceProviders.org explores some of the demographic data behind social media.

You’ve no doubt heard the old, oft-quoted adage, “men are from Mars, women are from Venus,” used to denote the fact that men and women may not always see completely eye to eye. While this light-hearted statement isn’t taken literally, when it comes to the virtual world of Internet interactions, similar sentiments may be formed surrounding the different ways men and women use social networking. While the majority of adults in the US are plugged into some sort of social media outlet, not all of them are used in equal measure, and not all of them are used by both genders equally. For instance, the average Google+ user spend just three minutes per month on the network, while the average Facebook user will spend 405 minutes per month updating statuses, posting pictures, and checking out others’ profiles. So what can be learned about men and women in the world of the web? As is turns out, men and women tend to dominate very different social media networks. The following infographic takes a look at some of the differences between male and female-dominated social media sites: How many users each one has, as well as how they interact.

There’s so really good data they have compiled in here, and most of the data visualizations are easy to understand.  I would not have expected to see that Twitter has 40 million more female users each month.

There are a handful of minor tweaks that would help improve the design:

  • The salmon/orange/peach color for women is unexpected compared to the traditional pink.
  • Go ahead and use the official Twitter and Facebook icons.  No need to design their own.
  • The pie slices for time spent would work much better with colors that are more distinct.  The different shades of gray are very hard to differentiate.
  • For the pie charts, the text label should be placed next to the pie slice its describing, instead of the opposite side as shown in this design.  Flipping the pie charts horizontally would fix that easily.

I appreciate the clear Creative Commons license in the footer, but the URL to the original infographic lansing page is missing.  Since the infographic image file is shared by itself, the URL always helps readers to find the original.

Found on Ragan’s PR Daily


Thursday
Apr252013

The 2012 Adobe U.S. Digital Video Benchmark

Cool infographic video from the team at Adobe that shares the results of their own 2012 Digital Video Benchmark research.

As you relax at home, walk through stores, and sit in airports, you see people watching video on more screens than ever before. But don’t rely on the eyeball test. The Adobe Digital Index team looked at 19.6 billion video starts on media websites to confirm the growth of broadcast video consumption across connected devices. See the latest video trends they uncovered for device use, ad placement, social media, and more. 

Learn more about what they found here: http://adobe.ly/ZeXLoI.

Adobe Digital Index publishes research on digital marketing based on the analysis of anonymous, aggregated data from over 5,000 companies worldwide that use Adobe Marketing Cloud.

The information is about all videos and ad placements in online videos, but the data also applies to infographic videos.  Online videos are still on the rise, and have become a very effective content and advertising platform for companies.

Clean data visualizations that I would assume were created in Adobe After Effects.  The bar charts that change size and shape in multiple directions are disconcerting though.  I can’t tell if they were appropriately adjusting the area of each bar, but I doubt it.  It looks more like a designer thought it would look unique and different without realizing that it corrupts the visualization of the data.

Thanks to Jordan from Say It Visually for sending in the linK!

Tuesday
Apr022013

Social Network Overload

Social Network Overload infographic

How often have you checked your social media accounts today? Feeling unplugged is a problem for many people.  Social Network Overload from mylife.com talks about how people are addicted to social media, and what they rather do than give up their Internet lifeline. 

Afraid you’re missing something important on your email, Facebook, Twitter, or other accounts? You are not alone. Two out of three people feel the same way. In the same survey, three out of five people wished there was a solution to monitor their various communication options.

Here’s an interesting infographic based on a survey by Harris which illustrates a growing trend—social media overload

The isometric illustrations of people and the data visualizations are fun, and the light-hearted data makes this one appealing to share.  The design is missing the URL to the infographic landing page, so that readers can find the original when they see thie infographic posted on other sites.

Found on The Undercover Recruiter and Visual Loop.

Tuesday
Jan082013

The Ultimate Complete Final Social Media Sizing Cheat Sheet

The Ultimate Complete Final Social Media Sizing Cheat Sheet infographic


The Ultimate Complete Final Social Media Sizing Cheat Sheet by LunaMetrics is a huge (and very long) informational infographic that shows the readers all of the important image sizing requirements for the major social networks.

In June of this year, we published an infographic listing all of the sizing information for images on Facebook, Twitter, Google+, and Pinterest. It was a wildly successful piece of content, totally blowing our expectations out of the water. Unfortunately, while its popularity has flourished, nearly every social network instituted changes to their image sizes, rendering most of the information on the infographic out of date.

We knew we needed to update the information on the cheat sheet, but we weren’t comfortable with simply adjusting one or two figures on the blog post and leaving it as-is. We’d also received a lot of feedback, both on the design and information it contained. We decided to redesign the entire sheet and incorporate a few more social networks.

We also decided to permanently redirect the old sheet here, so that shared tweets, pins, likes, and so on, would lead to the correct sizing dimensions. Additionally, as sizing changes are implemented across social networks, we’ll actively update this sheet – meaning that if you use the embed code at the bottom to share this sheet on your own site, the image will automatically update with changes as they are rolled out. No more out-of-date information.

I love that all of the sizes are shown in correctly proportional rectangles!  Based on their claim, this infographic should also update correctly as they revise it to match the ongiong changes from all of the social networks.  

Some color of the official logos of the different social media networks at each section break would have been helpful to the reader.  The light typeface used at each section break is hard to distinguish from the rest of the design.

Found on Social Media and Social Good