About
Randy Krum
President of InfoNewt.
Data Visualization and Infographic Design

Infographic Design

Infographics Design | Presentations
Consulting | Data Visualizations

DFW DataViz Meetup

Join the DFW Data Visualization and Infographics Meetup Group if you're in the Dallas/Fort Worth area!

Search the Cool Infographics site

Custom Search

Subscriptions:


Feedburner

The Cool Infographics® Gallery:

How to add the
Cool Infographics button to your:

Cool Infographics iOS icon

- iPhone
- iPad
- iPod Touch


Read on Flipboard for iPad and iPhone

Featured in the Tech & Science category

Flipboard icon

Twitter Feed
From the Bookstore

Caffeine Poster

The Caffeine Poster infographic

Entries in UK (11)

Friday
Jul202018

The UK's Brexit Options in the EuroZone Visualized

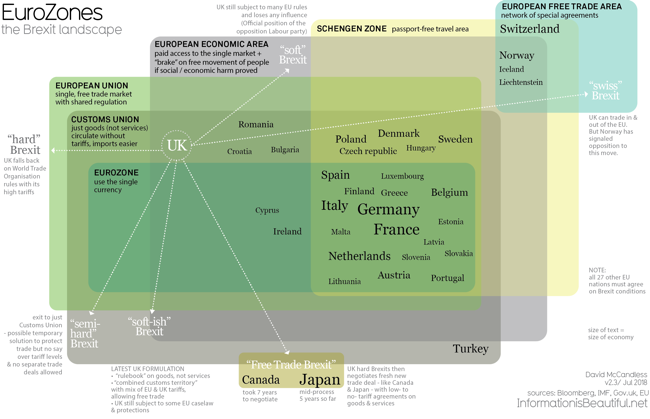
The team at Information Is Beautiful have visualized the different options available to the UK in EuroZones: The Brexit Landscape, and have been making updates as the situation evolves.

Brexit? The Eurozone? The European Economic Area? The European Free-Trade Area? The European Customs Union? Whaaat?

A graphic that hopefully clarifies the complex structure of the European Union and the UK’s various routes and options for Brexit.

UPDATE: 15th July 2018: The saga continues. The UK announces its ideas for a “common rulebook” and “facilitated customs arrangement”, effectively a ‘soft’ Brexit.
Hard Brexit ministers resign.

UPDATE 3rd July 2017: It’s getting complicated! Added 2 more Brexit routes. See the first version.
UPDATE 1st AUG 2017: Detailed UK opposition party Labour’s positions. Refined ‘Free Trade Brexit’ & typical negotiation times (from here). Clarified a key difference between EEA (good & services) & Customs Unions (just goods). Read a useful, clarifying article
UPDATE 28th AUG 2017: UK opposition party, Labour, has now consolidated under a “soft Brexit” position.


Monday
Dec182017

The Economics of a UK Christmas

The Economics of a UK Christmas infographic

Do you have a budget for your christmas this year? The Economics of a UK Christmas infographic from Bridging Loans covers the spending for Christmas in the UK, and it continues to rise! The UK spends the most money on gifts, and more specifically on technology!

Here is a cool infographic we have created that provides lots of statistics about Christmas in the UK. The infographic is broken down into sections including overall Christmas spending, what type of stuff we spend the money on and how the UK compares to the rest of Europe.

My biggest feedback on this design, is too many of the statistics are shown as just text alone. Big fonts are not data visualziations, and just showing many of those values doesn't provide context for the audience.

Thanks to Dave for sending in the link!

Friday
Jun242016

How Britain Voted in the E.U. Referendum

How Britain Voted in the E.U. Referendum map infographic

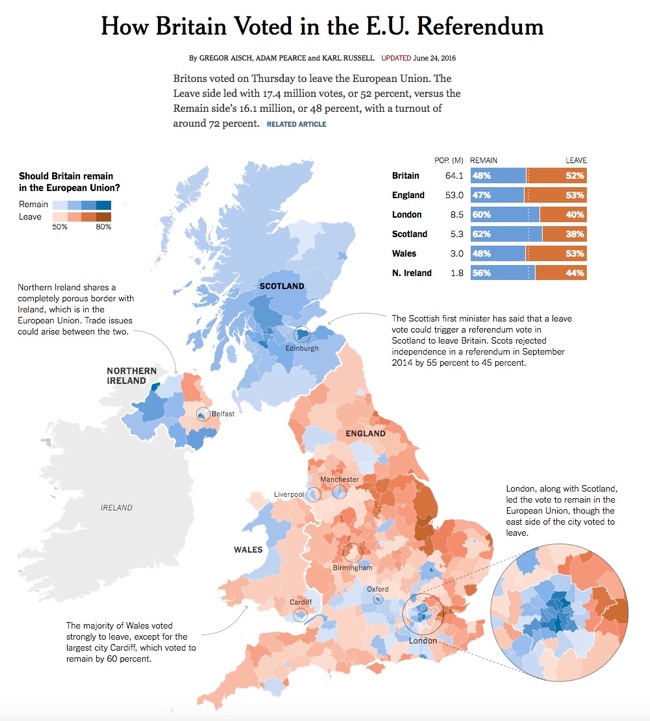
Britain voted on Thursday to part ways with the European Union. The vote was incredibly close, and this choropleth map visualization from the NY Times tells an intriguing story.

Britain has voted to leave the European Union, a historic decision sure to reshape the nation’s place in the world, rattle the Continent and rock political establishments throughout the West.

The margin of victory startled even proponents of a British exit. The “Leave” campaign won by 52 percent to 48 percent. More than 17.4 million people voted in the referendum on Thursday to sever ties with the European Union, and about 16.1 million to remain in the bloc.

Britons voted on Thursday to leave the European Union. The Leave side led with 17.4 million votes, or 52 percent, versus the Remain side’s 16.1 million, or 48 percent, with a turnout of around 72 percent.


Tuesday
Feb162016

London’s Expected House Price Gain

London’s Expected House Price Gain from Freehold Sale looks at the dramatic price increases expected in the London, UK, housing market.

London is an exciting place to live. Pick the right borough and you can enjoy the best of both worlds – the buzz of the city and access to amazing jobs, plus large open green spaces, top schools and an excellent quality of life.

It’s no wonder that property in our capital city remains in high demand, driven by an innate desire to live in and around the capital. It’s an investment goldmine – we hear almost daily how London’s property market outpaces the remainder of the country and will continue to do so for years to come. Real estate group, CRBE forecast prices in London could rise more than 30 per cent over the next five years.

Essentially, it could be a good gamble, but whereabouts should you look? If you have a sizeable deposit rubbing a hole on your wallet and fancy purchasing a freehold in London, here are the expected price rises for the next five years:

Color coding can be a tricky way to visualize data. The readers have to refer back to the color key frequently to understand the design, especially when it takes scrolling to look back and forth.

The footer should include the URL back to the infographic landing page so readers can find the original full-size version of the design when they come across smaller versions posting on blogs and social media.

Thanks to David for sending in the link!

Thursday
Jun112015

UK Tax Burden Infographic Video

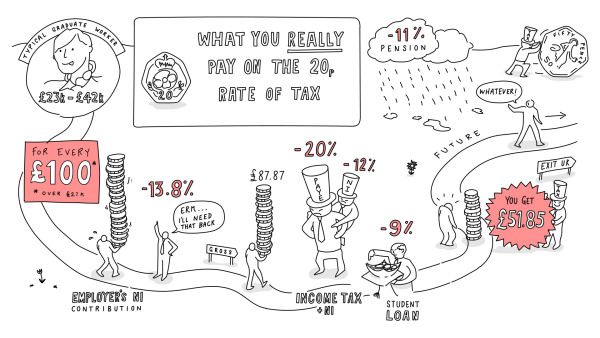
The UK Tax video, posted on Youtube by See What You Mean, explains how much money you actually receive after taxes in the UK. Below is the final infographic.

UK Tax Burden Infographic Video

The tax and deductions on your job are much higher than you might think. The Government likes to talk about a ‘20p rate’ – as if that’s all you pay. But actually, for a typical middle income graduate, total deductions are more than 48p in every pound earned (over the £21k threshold). And will rise to nearly 60p when the statutory pension scheme comes in by 2018.

What will it do for the incentive to work and do better, and to the UK’s general prosperity, when graduates only get 40% of any extra they earn?
Against this backdrop some politicians still talk of increasing the taxes on these middle earners.

This is a great example of using the hand-drawn style of design for infographics. Often used for graphic recording of events and meetings, the hand-drawn style has the look of someone just drawing on a whiteboard.

Video infographics tells stories in a very linear way, and in this case the visual metaphor of a road builds on that linear storyline even more. The drawing continues to build and reveal more information as the video progresses, and the viewer can see the overall design coming together.

I say this often, but I'll say it again. "Big numbers are not data visualizations." Visualizations can help the audience by showing the taxes percentages as taking their portion of a person's total salary. Just showing the text number of the percentages, doesn't help the viewers understand how large that tax burden is to them.

Thanks to Richard for sending in the link!

Thursday
Apr022015

The True Cost of a Bad Hire

The True Cost of a Bad Hire infographic

The True Cost of a Bad Hire infographic from Executives Online in the UK puts into perspective the £4.13 billion a year that UK businesses are losing from a bad hire. With one £50 note being less than 1 mm thick, the stack would reach about 933 meters tall. London’s Big Ben is 96 meters tall.

People are a businesses most valuable resource. Actively finding and attracting top talent is a never-ending task for any company that aspires to be the best.

The amount of new hires that don’t work out is frightening – in fact a study by leadership IQ across a range of industries and job roles found that up to 48% of new hires fail within 18 months. It’s a problem that’s estimated to cost UK businesses over £4 billion a year.

So What’s The True Cost When One Of These New Hires Doesn’t Work Out? 

Outside of the obvious salary cost, there are a significant number of tangible and intangible factors that can drive the cost of a failed hire much higher than initially estimated. 

We used an example of a £100k per annum executive to answer one question: “What’s the true cost of a bad executive hire?” We factored in salary, benefits, the cost of the recruitment and sourcing process, and the knock on effects of having a poor performing individual in a role for up to a year.

Using data from a range of external sources and our own databases we arrived at a final figure showing this cost to be around three and a half times more than a year’s salary. To demonstrate the scale of this cost we laid it all out in a infographic as well as breaking down how that cost was arrived at.

So Why Do Bad Hires Happen?

Part of this failure to make successful hires is down to company policies focussing on hiring cost rather than ROI.

As Steve Jobs put it: “A small team of A+ players can run circles around a giant team of B and C payers… I’ve noticed that the dynamic range between what an average person could accomplish and what the best person could accomplish was 50 or 100 to 1”.

Next time you’re making an executive hire, remember what it will cost if it doesn’t work out! 

It’s a long/tall infographic design, but I think that the length is actually part of the visual story in this case.

Visually, the grids would be easier for readers to understand if the rows were 10 icons across instead of 20. We live in a Base-10 society. Rows of only 10 would make the infographic twice as long, but an alternative would be to add some spacing to visually separate the left 10 from the right 10. Same thought for vertical spacing. It would help to have a gap in the icon grids every 10 rows.

The confusing part is that every icon is a £50 note, so with 20 icons, each row represents an even £1,000. That’s why I think they designed the rows to be 20 icons across.

Odd that they published the infographic as a transparent PNG file.

Thanks to Alex for sending in the link!

Tuesday
Jul092013

Methods to Sell My House in the UK

Methods to Sell My House in the UK is an infographic from YouSellQuick.co.uk that looks at the different ways to sell a house and the financial implications.

When looking to sell your home you may not realise that there are a variety of different options available. Not all are as favourable as others and there are different pros and cons for each. Such as how long will it take to sell my home and what amount of cash can I receive. Should I sell my house at an auction or would it be better to use an on-line property buyer?

I like the diagrams that explain the different processes, but the pie charts have really been used poorly in this design.  I think I nderstand what they were trying to explain, but it won’t be obvious to most readers.  Many readers will think they got the pie chart data wrong because the percentages shown don’t add up to 100%.

Thanks to Mark for sending in the link!


Friday
May312013

UK Income Tax and National Insurance

Income Tax and National Insurance - What are you really paying? is a new infographic video explanation from the team at See What You Mean that helps unravel the complexity of the UK tax system.

The UK’s taxes on people’s wages are needlessly complex and obscure. Produced with the team from See what you mean, the video highlights how National Insurance is a second income tax in all but name.

Previous YouGov polling for the TPA has shown that many people are not aware of how much tax they actually pay. The video makes clear the real rates of tax people pay when Employee’s National Insurance and Employer’s National Insurance are factored in.

Thanks to Richard for sending in the link!

Thursday
Feb282013

Ski Holidays 2013

Ski Holidays 2013 infographic

If you like to ski, this is the infographic for you. Ski Holidays 2013 infographic from Home Away UK tells you where to find the best snow for skiing in Europe. Then as an added bonus, a few tips and facts to educate the reader about ski flags and types of snow.

Winter is here and the snow is starting to fall across the ski resorts of Europe and North America. Now is the time to start planning your next ski holiday, but before you do check out HomeAway’s fun guide to the slopes of Europe. We have also put together some interesting ski tips and advice including information provided by ski experts Nicola Iseard (Editor of Fall-Line Magazine) and Fraser Wilkin (Founder of Weathertoski.co.uk).

The information is well organized and the I like the simple, line-art illustrations.  By keeping the illustrations simple, they don’t pull attention away from the data.

Designed by This Is Visual, they provided a URL link to the data sources in the infographic instead of listing them out.  You can see the data sources at http://bit.ly/SpNJ1v, and the list extensive so I understand why they listed them separately.

The infographic should include both a copyright statement and the URL to the infographic landing page so readers can find the original when they see this infographic posted on other sites.

Thanks to Russell for sending in the link!


Monday
Nov192012

The Difference Between the United Kingdom, Great Britain, and England

The Difference Between the United Kingdom, Great Britain, and England infographic

Do you know the Difference Between the United Kingdom, Great Britain, and England? This infographic from sa-la.jp spells out the differences. It also includes a timeline of major events and some ideas for the future.

The terminology of the UK is quite complicated, so it’s no wonder that people get confused. Are Great Britain, the UK and England the same thing? Is Ireland part of the UK? What’s Wales!? To help explain things, I put together this infographic to define the parts that make up the UK and how it came about. If you still have any questions by the end of it, feel free to ask in the comment section below.

Really good infographic design that uses different visualization methods in the visual explanation.  Maps, icons and a subway map style timeline are easy to understand, and give the reader a basic understanding of the UK.

The sources should be more specific, linking to specific web pages, and there should be a URL to the original infographic landing page in the footer.

Thanks to Tim for sending in the link!