About
Randy Krum
President of InfoNewt.
Data Visualization and Infographic Design

Infographic Design

Infographics Design | Presentations
Consulting | Data Visualizations

DFW DataViz Meetup

Join the DFW Data Visualization and Infographics Meetup Group if you're in the Dallas/Fort Worth area!

Search the Cool Infographics site

Custom Search

Subscriptions:


Feedburner

The Cool Infographics® Gallery:

How to add the
Cool Infographics button to your:

Cool Infographics iOS icon

- iPhone
- iPad
- iPod Touch


Read on Flipboard for iPad and iPhone

Featured in the Tech & Science category

Flipboard icon

Twitter Feed
From the Bookstore

Caffeine Poster

The Caffeine Poster infographic

Entries in connections (69)

Wednesday
Mar292017

Iconography of Ink

Iconography of Ink infographic

Iconography of Ink, created by Stylight.com, maps out 90 celebrity tattoos and their connections to one another. You can find other interesting facts and tips about tattoos at Stylight.com.

Tattoos—originating from the Tahitian word ‘tatau’—have decorated the skins of endless cultures, spanning thousands of years. Both Polynesian tribes and Italian monks donned such skin art, not to mention, world-traveling sailors and European monarchs.

Fast-forward to today and tattoos are common practice amongst all socioeconomic classes. Scan PopSugar, Huffington Post or Vogue magazine and you’re sure to find tattooed musicians, actors and models alike. The celebrity tattoo craze isn’t just a sign of the times, but an entertaining melodrama.

From bad ass Cambodian tigers (read: Angelina Jolie) to ill-advised dedications to spouses (we’re looking at you Melanie Griffith), watching the evolution of Hollywood tattoos rivals even the most absorbing of reality tv shows.

Thanks to Elisa for sending in the link!

Tuesday
Oct212014

Where Do Designer Dogs Come From?

Where Do Designer Dogs Come From? infographic

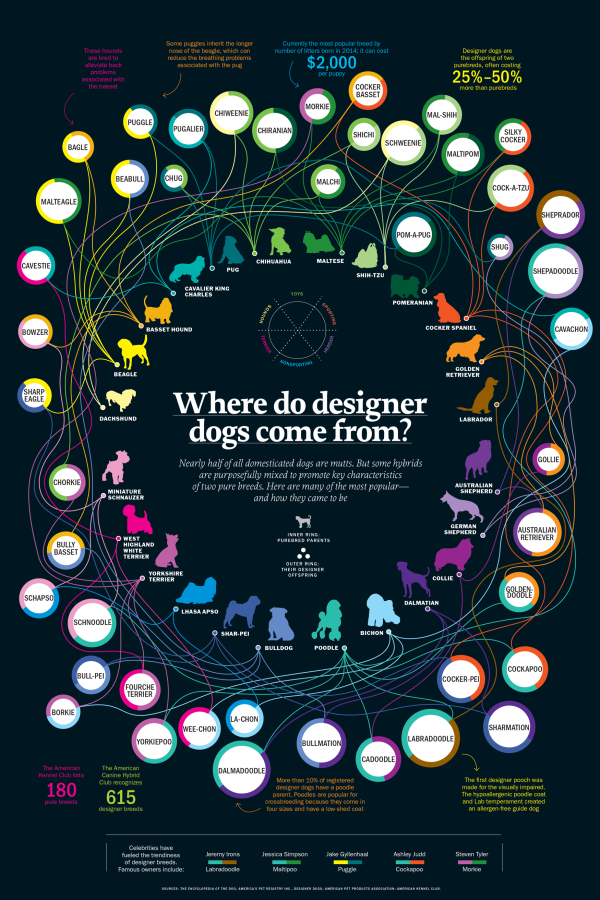
Where do Cocker Bassets come from? The answer is from a Cocker Spaniel and a Basset Hound! Where Do Designer Dogs Come From? infographic from Time explains the breeding patterns behind the multiple breeds of dogs.

Morkies. Cockapoos. Chiweenies. These dogs may not have serious names, but they’re a serious business. Known as ‘hybrid’ or ‘designer’ dogs, these canines are bred with a purpose – to optimize the best qualities of each parent.

Unlike some mixed breeds, designer dogs are generally born from two purebred parents. Depending on the qualities of the offspring, one puppy can be like having two dogs in one. Labradoodles, for instance, were first bred from labradors (which are common guide dogs) and poodles (with a low-shed coat) to be hypoallergenic service dogs. Puggles – a cross between a pug and a beagle – usually have a muzzle of a beagle, which can eliminate breathing problems often associated with the short-nosed pug.

Not all hybrids are desirable. Designer-dog critics says genetic experimentations are exacerbating the problem of puppy mills. For instance, when a puggle inherits a short snout from a pug and the hunting instincts from the beagle, it may not have a respiratory system that’s equipped to handle all the exercise it needs. These unwanted dogs often end up in shelters.

Despite the controversy, designer breeds have made a mark on the $60 billion pet market by commanding high prices that often exceed their purebred counterparts. And so long as the market continues to demand them, cavachons, pekeapoos and schnoodles are here to stay.

Bright, colorful network connections between breeds makes for a good infographic. curved, winding connections draw in readers to follow their favorite breeds.

The circle sizes have no meaning, just sized to fit the text within, which is misleading.  Disappointingly, the stats they do have are not visualized at all. The URL to the infographic landing page should be included in the footer so readers can find the full-size original version when they find this posted on other sites that don’t include a link.

Thanks to Sue for sending in the link!

Tuesday
Jul152014

House of Cards: Power Connections

House of Cards: Power of Connections infographic

We’ve all have heard the saying, “It’s not what you know, it’s who you know.”  The House of Cards: Power Connections infographic from Linkedin brilliantly uses the House of Cards show to show a good example of being connected. How powerful is your connection network?

Relationships Matter

From college internships to becoming President of the United States, who you are connected to and how you leverage those connections matters.

We wrote the post 4 sales strategy lessons from Frank Underwood to take some learnings from the show and how they can apply to your professional growth. It was an amazing use of social media that we got a response from the House of Cards Twitter profile and felt we should lean-in on some of the content.

The best way for us to illustrate the valuable connections of a character like Frank Underwood is to create a LinkedIn InMap infographic with Frank at the center.

I love the idea of using a famous fictional person to show the “Power of Connections” instead of a real person that people might not be familiar with. Color-coding is always a helpful tool to minimize words on an infographic, and it’s used well here. Also, the use of faces for the key people on the graphic break up the names to keep it interesting. However, the reasoning behind the use of different sizes of circles around the names is unclear. Always make sure to include the URL of the infographic landing page at the bottom so that viewers can find the original.

This is based on the same network map visualization tool that you can use to automatically visualize your own connections on Linkedin.  Login with your Linkedin account on the Linkedin Labs page: http://inmaps.linkedinlabs.com/

Found posted on Google+ by Jason Lankow

Monday
Oct142013

The Magnificent Multitude of Beer

The Magnificent Multitude of Beer infographic poster

The Magnificent Multitude of Beer is a cool new poster design from Pop Chart Lab.

This wall map is the most complete charting of beer ever, breaking down ales and lagers into over 100 delicious styles from hoppy IPAs to fruity lambics, and including over 500 individual beers as notable examples of each style as well as glassware recommendations. The Magnificent Multitude of Beer captures the proud work of hundreds of breweries around the world, clocks in at a staggering 60 inches by 40 inches, and is the perfect finishing touch for your man cave or lady lair.

SALE today only!  The team at Pop Chart Lab has a 15% OFF Everything sale for Columbus Day (October 14).  Use the code COLOMBO at checkout to get the discount.  The code is valid until 12:30pm EST tomorrow.

Monday
Sep232013

The Ecosystem of Linkedin

The Ecosystem of Linkedin infogrpahic

LinkedIn has reached over 200 million members worldwide, making it the world’s largest professional network. The Ecosystem of LinkedIn infographic from Dynamic Search explains why LinkedIn is a must have tool for everyone.

The Ecosystem of LinkedIn includes how LinkedIn works and what you should really know. What’s the difference between endorsement and recommendation? What about job search,  personal or company profile, groups and connections? Below is the infographic that will simplify LinkedIn for you. Are you an employee or business owner? If so, you should have a profile on LinkedIn. Enjoy.

This design does a good job of using illustrations and diagrams to add a visual element to abstract concepts like connections and recommendations.  The text descriptions could have been simplified even further to remove more text from the design.

The footer should have included a copyright or Creative Commons license, and the URL link back to the landing page so readers could find the original, full-size version.

Thanks to Nicole for sending in the link!

Thursday
May162013

The Stephen King Universe

The Stephen King Universe infographic poster

Are you a Stephen King fan? Have you yourself made these connections? From TessieGirlThe Stephen King Universe has been updated to include the many connections to the Dark Tower series.

When I was in Grade 5 (guess I was ten), my friend Tarnya Smyth brought her mum’s battered copy of Stephen King’s ‘Carrie’ to school. We broke it into about 4 pieces and passed them around, all taking turns reading each battered section. I told mum about it and she FLIPPED HER WIG and told me to ‘Stop reading that book immediately!!’ So I finished it.

Now, I TOTALLY do not recommend  ten year olds reading Stephen King books (messed me up good), but this was when my life long relationship with Mr King began. My love for his books is based around his characters. They are so full. I love Stephen King dialogue. I love his sense of humour. And I love the links and connections between the books. I am the kind of annoying person who likes to know the ‘In Joke’. So, of course, I MADE A FLOW CHART!!!

This chart is like my fourth child. Be kind to it. It means a lot to me.

I wish they had published a higher-resolution version online.  Some of the text is too small to read, but I think I can follow all of the connections.  A must have for any Stephen King fan!

Also, it’s available for purchase as a poster from the TessieGirl site for $25 plus shipping from Australia.  You can also see the original version.

Thanks to Becky for sending in the link!

Tuesday
Mar052013

Pairing Wine & Food

Pairing Wine & Food infographic poster

Pairing Wine & Food from Wine Folly is a simple, but incredibly useful infographic design.

Ever sink your teeth into a maple bar donut and follow it with a sip of straight black coffee? If you haven’t, you need to. The sweet and fat of a donut is the perfect compliment to bitter hot coffee. You’ll never want to add milk and sugar again.
 
Sommeliers use opposing taste profiles such as sweet and sour all the time to create perfect food and wine pairings. Follow the simple set of guidelines below to make the best wine and food pairings at home.

This is the kind of infographic design you just want to hang up in your kitchen, because you’ll be looking at it so often.  This design is deceptively simple.  The color-coded connection lines are easy to follow, and it’s clear to the reader that they have good choices to drink with different foods.  There isn’t one “right” answer.

Also available as a poster: http://shop.winefolly.com/collections/posters/products/basic-food-wine-pairing

Found on Infographics Showcase and  Best Infographics

Monday
Feb112013

The Submarine Cable Map 2013

The Submarine Cable Map 2013 infographic poster

A beautiful map of the World’s undersea Internet cables, The Submarine Cable Map 2013.  Brought to us be TeleGeography, sponsored by Telecom Egypt and design credit is listed as Nick Browning, Markus Krisetya, Larry Lairson, Alan Mauldin.

Cables depicted include all active international and U.S. domestic cables.  In-service cables have an announced Ready for Service (RFS) date by December 31, 2012.  Planned cables include those actively under construction and those that have announced they were fully funded as of year-end 2012.  Map does not depict proposed cables that have not announced landings or configuration.  Cable routes are stylized and do not reflect physical cable location.

I love the hand-drawn design style, meant to pay homage to old maps, but overlaid with very current information.  This is also available for purchase as a poster 36” x 50” for $250.

An interactive website with more information about all of the cables is also run by TeleGeography and can be found at submarinecablemap.com

Found on FastCoDesign.


Friday
Oct052012

The Supernatural Sprawl of True Blood

the supernatural sprawl of true blood infographic

The HBO phenomenon that captured our attention it’s first season has become hard to follow. The Supernatural Sprawl of True Blood infographic created by Jess Bachman from visual.ly breaks down the types of characters that have appeared so far in each season and each episode.

TrueBlood started as a show about the relationship between humans and vampires. But over the course of five seasons, the list of supernatural creatures has been steadily expanding. Love it or hate it, there are a lot of supes — and keeping track of them all is becoming increasingly complex. This infographic should help you sort it all out.

The design does a good job of using unique, recognizable illustrations for each type of creature, and then grouping them together for each episode.  It’s also very obvious that the episodes have consistently gotten more complicated as the show progressed.

Credit for the illustrations goes to Ilias Sounas, and thanks to Jess for sending in the link!

Wednesday
Oct032012

How-Many Guide to Kitchen Conversions

Common Cook's How-Many Guide to Kitchen Conversions infographic


Designed by Shannon Lattin at S.B. Lattin Design, the Common Cook's How-Many Guide to Kitchen Conversions is a super-helpful infographic design.  Very quickly the reader can lookup to the conversions between many of the most common recipe measurements.

If your kitchen drawers are anything like ours, you never have the right measuring implement for the recipe you’re tackling. Keep this chart on hand, and the next time you find yourself asking “How many…” you’ll know just what to do.

This design is an excellent example of "tell one story really well."  It's a clear and simple design that is quick and easy for the reader to understand.  

Found on Visual.ly

Nice job Shannon!