About
Randy Krum
President of InfoNewt.
Data Visualization and Infographic Design

Infographic Design

Infographics Design | Presentations
Consulting | Data Visualizations

DFW DataViz Meetup

Join the DFW Data Visualization and Infographics Meetup Group if you're in the Dallas/Fort Worth area!

Search the Cool Infographics site

Custom Search

Subscriptions:


Feedburner

The Cool Infographics® Gallery:

How to add the
Cool Infographics button to your:

Cool Infographics iOS icon

- iPhone
- iPad
- iPod Touch


Read on Flipboard for iPad and iPhone

Featured in the Tech & Science category

Flipboard icon

Twitter Feed
From the Bookstore

Caffeine Poster

The Caffeine Poster infographic

Entries in animated (13)

Monday
Sep172018

Animated History of Home Siding Materials


Fixr has published their research of How the Use of Home Siding Materials Has Changed Over 40 Years as this animated data visualization changing the proportions over time.

It's a little odd to watch because it starts out looking like a bad pie chart with cute rounded corners. This is really a simple version of a voronoi diagram where the area of each section represents the proportional values.

The video above was created using the results from the census on exterior finishes of single-family homes. It looks at the historical use of wood, brick, stucco, vinyl, fiber and ‘other’ options starting in 1977 and ending in 2017. The census accounts for up to 1.6 million houses each year and includes homes across the U.S.A., so provides a broad look at how finishes have risen and fallen in popularity over the full period. These changes in popularity not only account for aesthetic fashionability but also availability, cost and practicality. From a trend perspective, each finish dominated a specific decade, in terms of houses completed in that finish. Brick dominated the 70s, wood dominated the 80s, vinyl, which only became available in the 90s, dominated that decade, and stucco and fiber cement dominated the 2000s. ‘Other’ materials also saw their highest use during the late 80s and 90s.

Thursday
Jul192018

Interactive Infographic From Coca-Cola Spain

Coca-Cola Spain is using the tool ThingLink to add animation and interactivity to their marketing infographics. ThingLink allows you to create "hotspots" that pop-up additional images, text and even videos.
Description: Coca-Cola Spain masters the art of digital storytelling by using interactive infographics on their blog.  In addition to it's attractive design, this infographic captures viewer attention with the use of motion (via GIFs).  In the infographic below, Coca-Cola shares how they have driven employment and progress in Spain since 1953. 

Wednesday
Apr182018

Animated Visualization of First Leaf Appearance

Animated Visualization of First Leaf Appearance

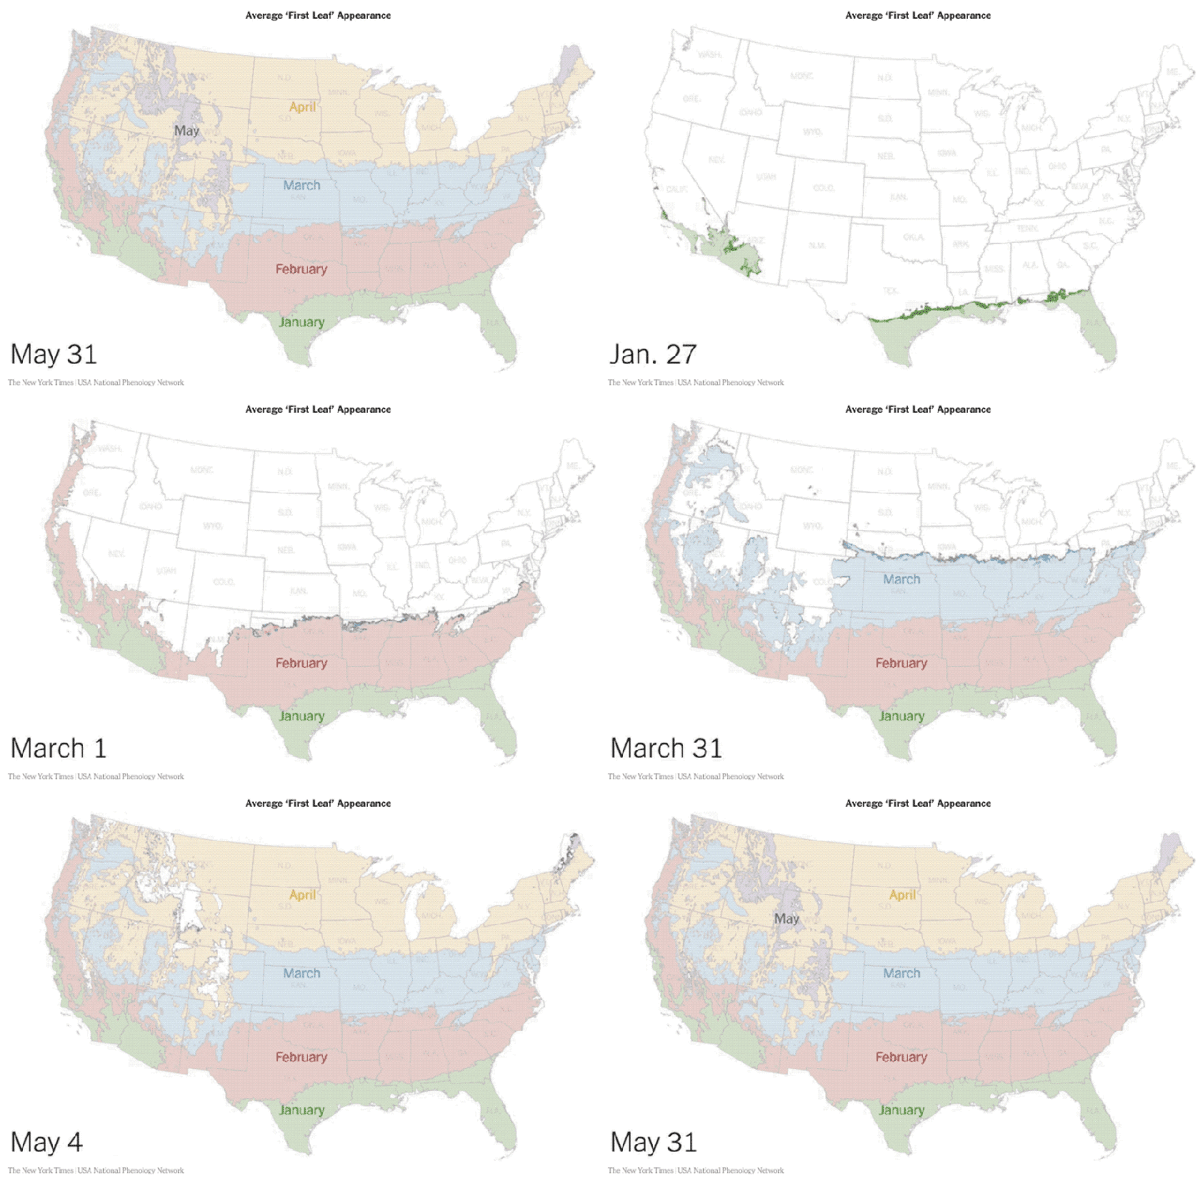
Spring is coming! Jeremy White at the NY Times has animated data from the USA National Phenology Network showing the average dates of "first leaf" across the U.S.

In some cases, an animated data visualziation is better at communicating the data to the audience than a static design. This animation clearly shows the progression of Spring across the country and you can understand the data within seconds.

Monday
Jul312017

EARTH, a visualization project

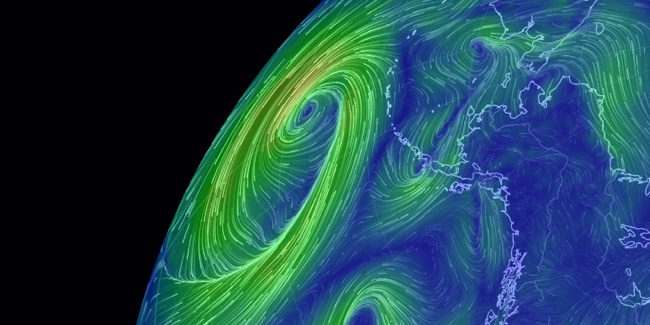
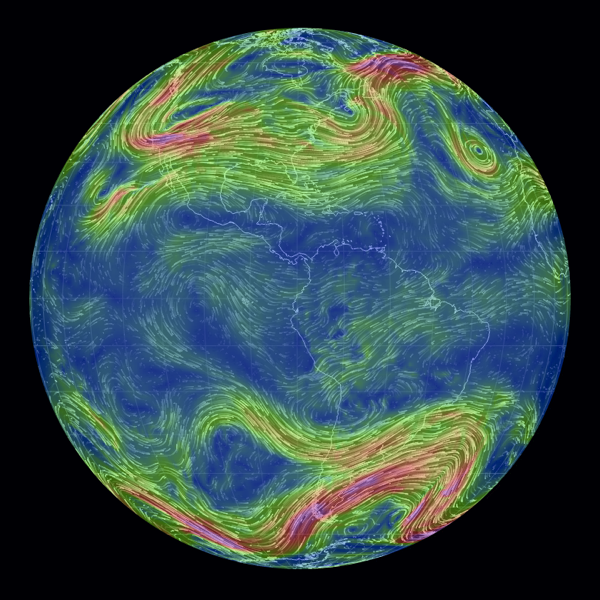
EARTH, by Cameron Beccario, is a beautiful interactive, animated visualization of a few different weather features across the entire globe.

EARTH, by Cameron Beccario, is a near real-time visualization of global weather conditions forecast by supercomputers. This vivid capture depicts intricate, dramatic swirling patterns of wind streamlines reminiscent of oil paintings of the Impressionists.

CAMERON BECCARIO'S creation, Earth. depicts wind patterns on a global scale. The artist began with a wind map of Tokyo, where he lives, and then he took on the world. You can see his animated creation at earth.nullschool.net.

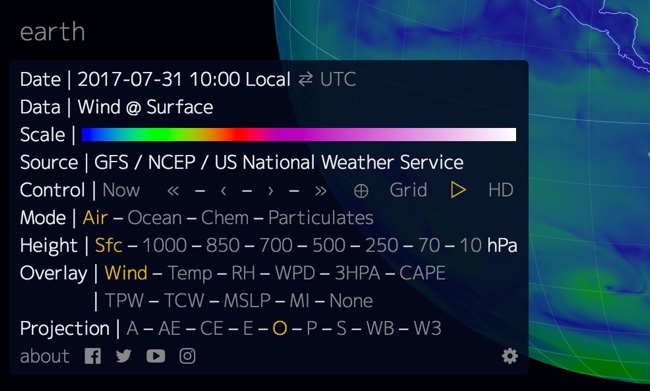
You can spin the globe and zoom in on any area in the World. Opening the setting panel lets you change the data that is being displayed; from wind to ocean waves to particulates in the atmosphere.


To support his project, you can purchase prints of some of the high-resolution images from Point.B Studio 

Designed in D3, all of the source code is also available at https://github.com/cambecc/earth. Of course the project was inspired by the Wind Maps visualization by Fernanda Viégas and Martin Wattenberg, that I have posted about before.

Monday
Nov072016

Visual History of US Population

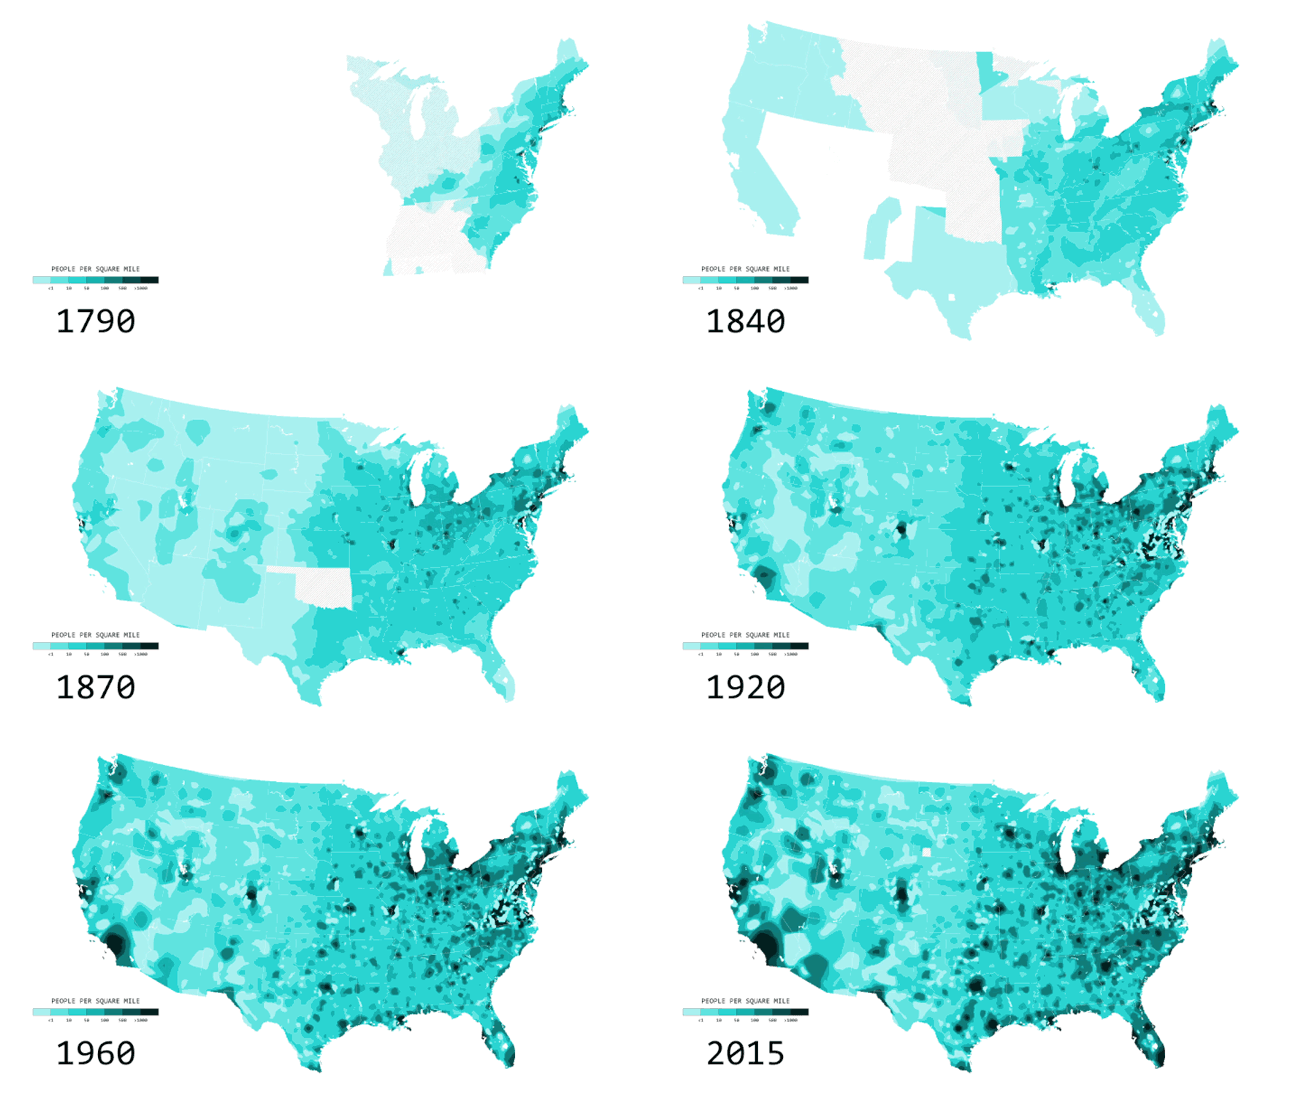
Nathan Yau from FlowingData has created a cool, new animated data visualization, Two Centuries of Population, Animated. The visualization shows the growth and spread of 

You’ve likely seen the population density map of the United States in one form or another. A lot of people per square mile reside in big cities, fewer people reside in suburban areas, and a lot fewer people reside in rural areas. Cities weren’t always cities though. Rural wasn’t always rural. If you look at people per square mile over a couple of centuries, you get a better idea of how the country developed.

The animated map above shows population density by decade, going back to 1790 and up to recent estimates for 2015. The time in between each time period represents a smoothed transition. This is approximate, but it gives a better idea of how the distribution of population changed.

Nerd Notes:


  • Nathan used R to generate the maps and FFmpeg to string the images into a video.
  • Data are originally from the Census Bureau but made much more accessible by NHGIS.


Tuesday
Aug162016

Animated and Interactive Global Shipping Visualization

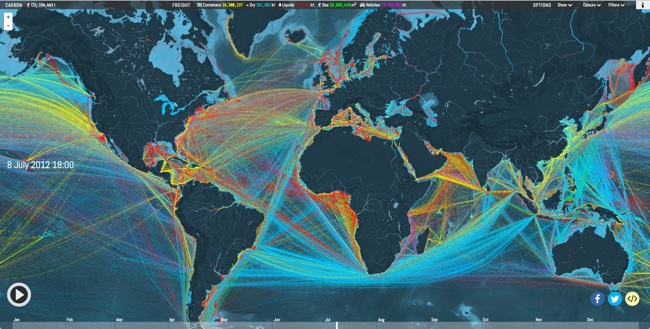
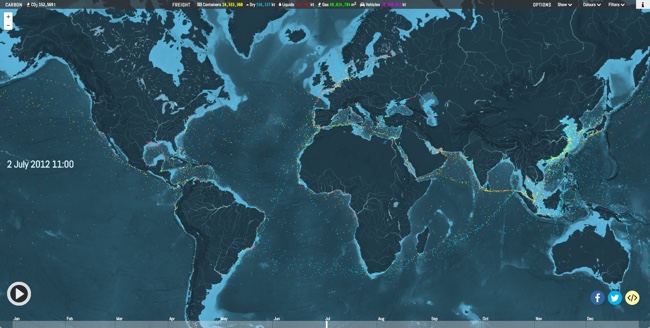
This is a fantastic detailed animated and interactive data visualization of the world's Global Shipping Traffic.

You can see movements of the global merchant fleet over the course of 2012, overlaid on a bathymetric map. You can also see a few statistics such as a counter for emitted CO2 (in thousand tonnes) and maximum freight carried by represented vessels (varying units).

The merchant fleet is divided into five categories, each of which has a filter and a CO2 and freight counter for the hour shown on the clock. The ship types and units are as follows:

  • Container (e.g. manufactured goods): number of container slots equivalent to 20 feet (i.e. a 40-foot container takes two slots)
  • Dry bulk (e.g. coal, aggregates): combined weight of cargo, fuel, water, provisions, passengers and crew a vessel can carry, measured in thousand tonnes
  • Tanker (e.g. oil, chemicals): same as dry bulk
  • Gas bulk (e.g. liquified natural gas): capacity for gases, measured in cubic metres
  • Vehicles (e.g. cars): same as dry bulk

The map was created by Kiln based on data from the UCL Energy Institute (UCL EI)

You can hide the route lines and just watch the ship dots move over time. It's mezmerizing!

Thanks to Jim Hopkinson and Bill Gates for sharing on Twitter!

You can see the interactive version embedded here, or click here to take you to the full-size original site:


Friday
Jun032016

The Global Air Transportation Network

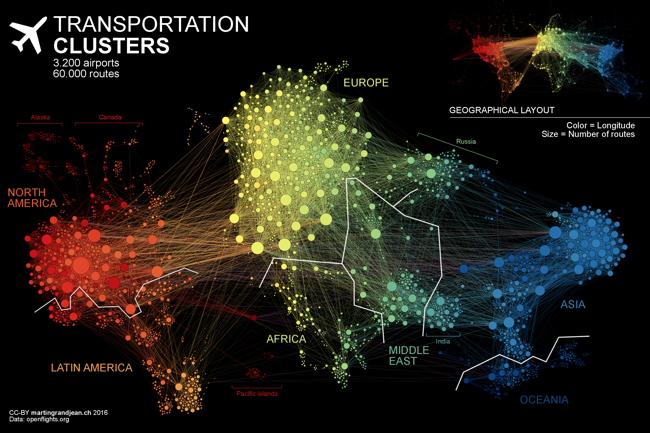
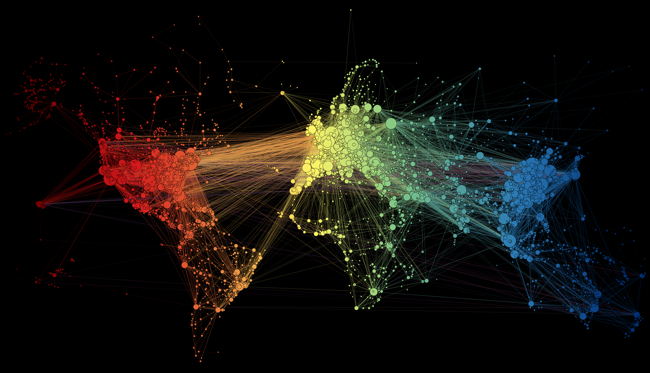
The Transportation Clusters infographic is a force-directed map of the 3,275 global airports and all of the connecting flight routes. Designed by Martin Grandjean, each bubble represents an individual airport and the bubble sizes represents the number of flight routes (37,153 routes in total) based on OpenFlights.org data.

People travel not just more frequently, but increasingly far and quickly. Mapping the connections between all the airports worldwide is a fascinating network visualization exercise.

This post (which may be followed by further experimentations in this area) is an attempt to make explicit the network behind air transport. The structure of the relationships has an impact on the spatial distribution of nodes in a graph. Let’s see how this landscape is reorganized without geographical constraints.

This “map” is the result of the application of a force-directed layout algorithm on a graph of 3.275 airports (37.153 single routes – the weighted total is higher because many airlines take the same route), based on OpenFlights.org data. Naturally, network geography is not completely disrupted: the continents are mostly visible and regions are generally in their original position (with the exception of the Pacific islands that connect Asia and America – imagine this graph in three dimensions, with the Pacific Ocean behind). Major observations: India is more connected to the Middle East than to South and East Asia. The Russian cluster is very visible, connecting airports in Russia but also in many former Soviet republics. Latin america is clearly divided between a South cluster and a Central American cluster very connected with the U.S.

The force-directed layout spaces the bubbles apart so there are no overlapping bubbles. The color coding is a color spectrum based on longitude, and generally groups airports from the same continent together. The total number of flights is much higher than the number of routes because many airlines share the same routes. I would like to see a version that weights the connecting lines with the number of flights that share that same route.

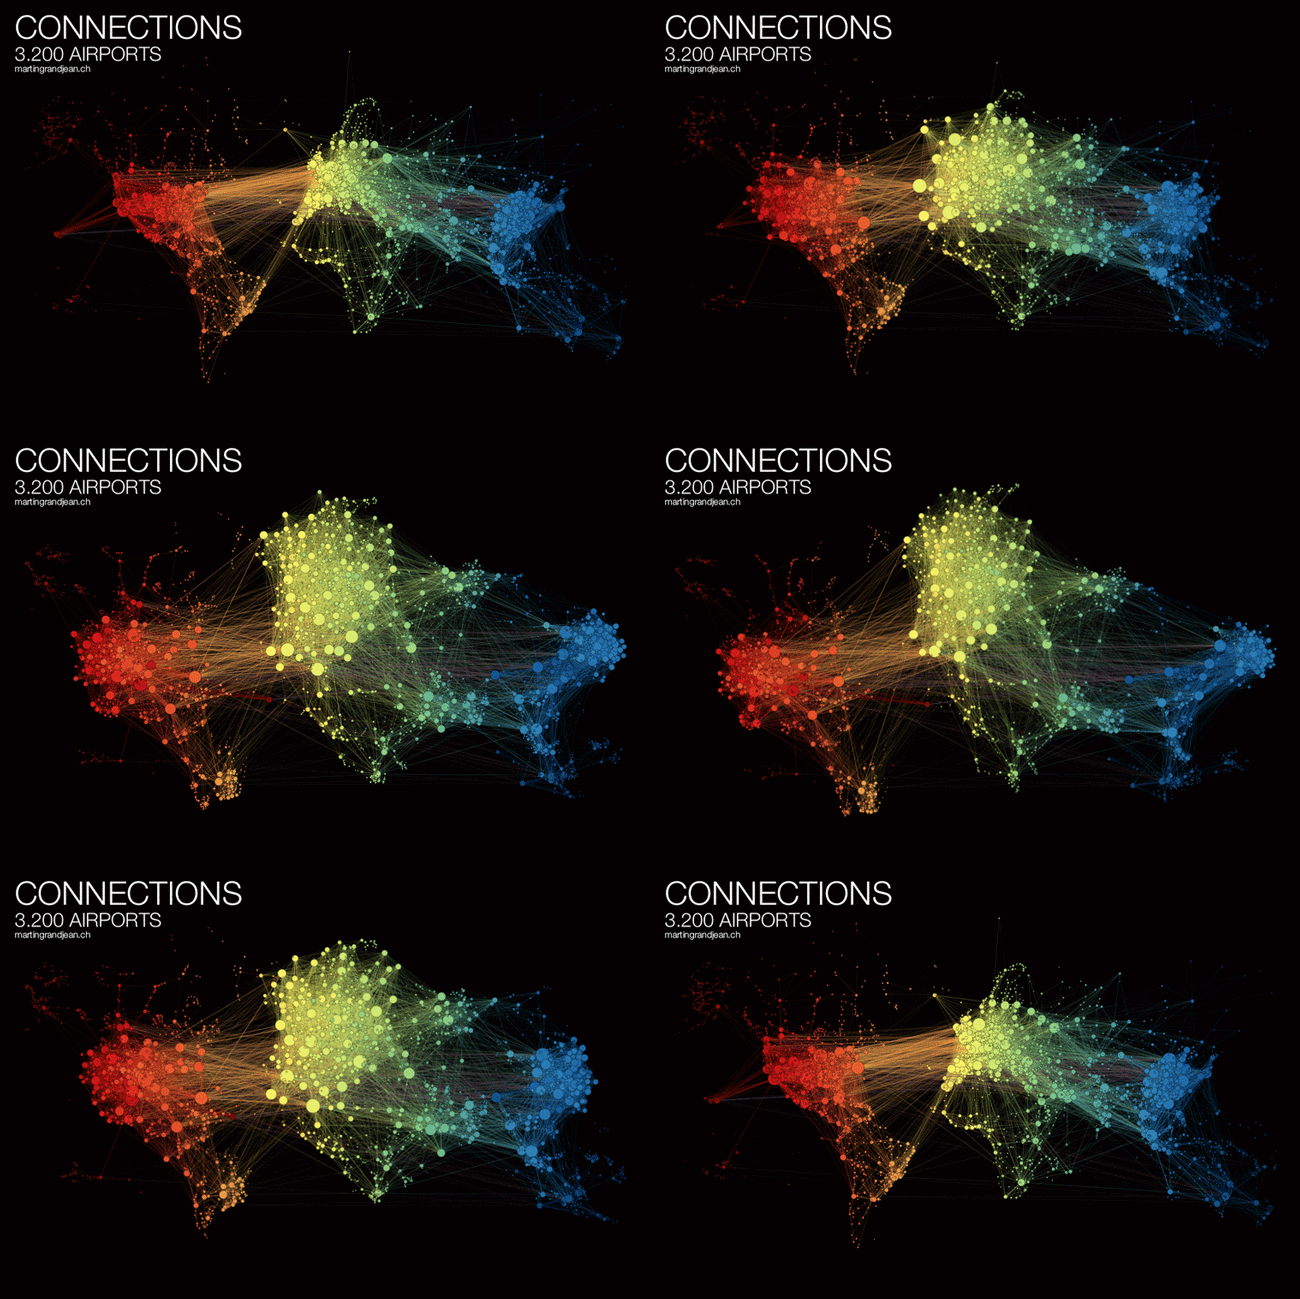
Here you can see the original map with the bubbles accurately located geographically, but a lot of overlap based on close proximity of the airports:

Martin also published a cool animated GIF and YouTube video of the change from geographical to force-directed layout.


Found on FlowingData

Monday
Jun152015

Infographics Are Evolving into Many Formats

The internet is full of noise, and your job is to break through that wall of information with something that resonates with your target audience. When you are communicating any message, you want to ensure that your audience will understand and remember the valuable takeaways about your products or services. You want your communication to be clear and concise. This is where infographics come in.

Infographics are your opportunity to convey complex ideas and information in a simple and easily digestible manner. Simply put, our brains love visual information. Infographics can make your marketing and advertising stand out in the crowded world of visual content.

As the Internet, our computing devices and out screen sizes continue to evolve and change, infographics need to evolve as well. Moving past the original static images, infographic storytelling with data visualizations and illustrations can now be found in a number of different formats.

Below, are great examples of different ways to leverage the five different types of infographics to make your product or services more memorable.


1. Static Infographics - Kitchen Conversion Guide

Static infographics are the most simple and most common infographic format out there. They are usually saved as an image file to be easily distributed and consumed (JPG or PNG format). Static infographics are easily shared using email and social media since there are no moving parts to consider.
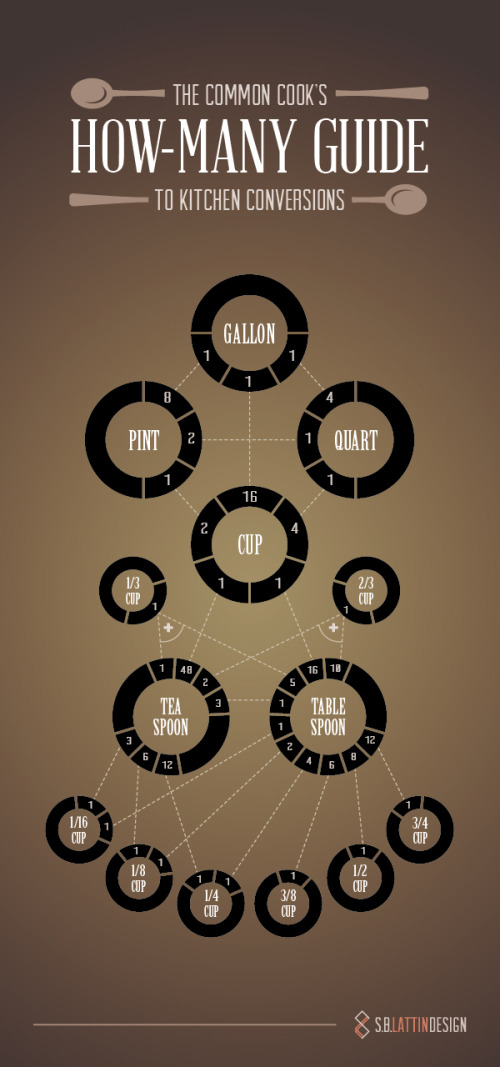
The Common Cook’s How-Many Guide to Kitchen Conversations

Source: https://shannon-lattin.squarespace.com/how-many-guide/

This type of infographic is also easily split up into segments in order to focus on one piece at a time. This is ideal for giving presentations or sharing on social media.


2. Interactive Infographics - Daily Dose of Water

Interactive infographics are great to utilize when you want people to move beyond simply looking at the information. Ideally your audience should get intimate with the facts you’re presenting by following a specific storyline told through your data. By giving your audience something to interact with, they are engaging more of their attention with the data, and will become more immersed in the information.

For example, this infographic from Good.is and Levi’s walks users through their typical routine and calculates how much water is used for each task. This allows a personalized experience for each person that views the infographic, creating a stronger connection to the information being shared.
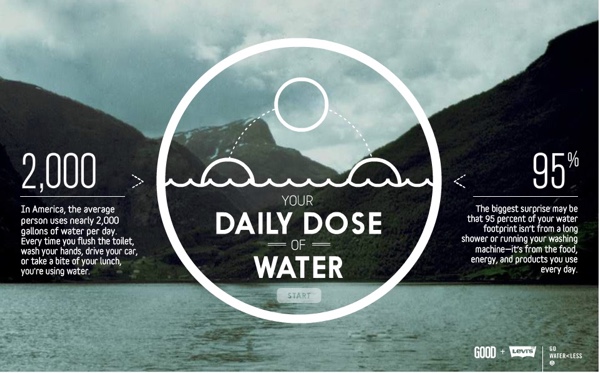
Your Daily Dose of Water

Source: http://awesome.good.is/transparency/web/1204/your-daily-dose-of-water/flash.html


3. Video Infographics - The Fallen of WWII

Video infographics have been gaining popularity over the years in part for a lot of the same reasons static infographics work: the ease of sharing and the ability to embed it almost anywhere.

In this video infographic that has recently gone viral, the creator uses data visualization to make a powerful statement about the sacrifice soldiers made during World War II. Data visualization is used in such a way to show the stark juxtaposition between the Second World War and more modern conflicts.  Check out this quick motion graphic titled, The Fallen of World War II from Austin-based developer Neil Halloran. His use of sound and motion brings the information to life.

The Fallen of World War II from Neil Halloran on Vimeo.


4. Zooming Infographics - The History of Film

Some infographic topics tackle a large amount of information, and a larger design is required to display all of its information. This infographic from Historyshots is a great example of a zooming infographic:
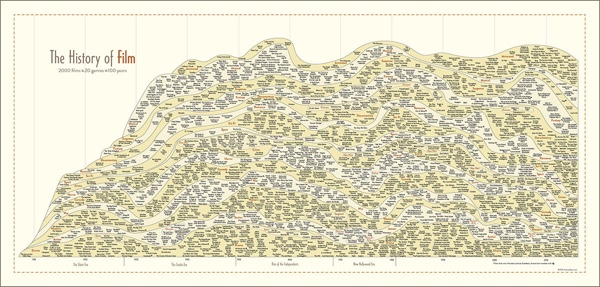
The History of Film

Source: http://www.historyshots.com/products/history-of-film

The History of Film plots out the most important films of the last 100 years into a beautiful, flowing timeline that visually separates the films into 20 different genres. As can be seen above, if this infographic was just left as a static image, it would be difficult to read everything because it is so detailed and complex. In the web browser, a large design is reduced in size so that the entire design can be viewed all at once on the screen, and the zooming controls are made available to the reader to view the small details clearly.


5. Animated Infographics - Flight Videos Deconstructed

Some topics for infographics are best created to feature motion, none more so than one that shows the the flight patterns of an Egyptian Fruit Bat, Dragonfly, Canada Goose, Hawk Moth, and Hummingbird. Flight Videos Deconstructed is an animated infographic about flight patterns within the animal kingdom. Covering five winged animals the and the motion their wings use while taking flight, this animated graphic uses vibrant colors and geometric shapes to convey the beauty and simplicity of flight.

Animated infographics create some motion or change in the design as the reader watches. It might be the bars in a bar chart growing, a color change, or (in the case of these winged animals) an animated character. These are differentiated from the video infographics because these are not video files. These are animated with HTML code or an animated GIF image file format to create the animation but can exist as a stand-alone object on a web page.
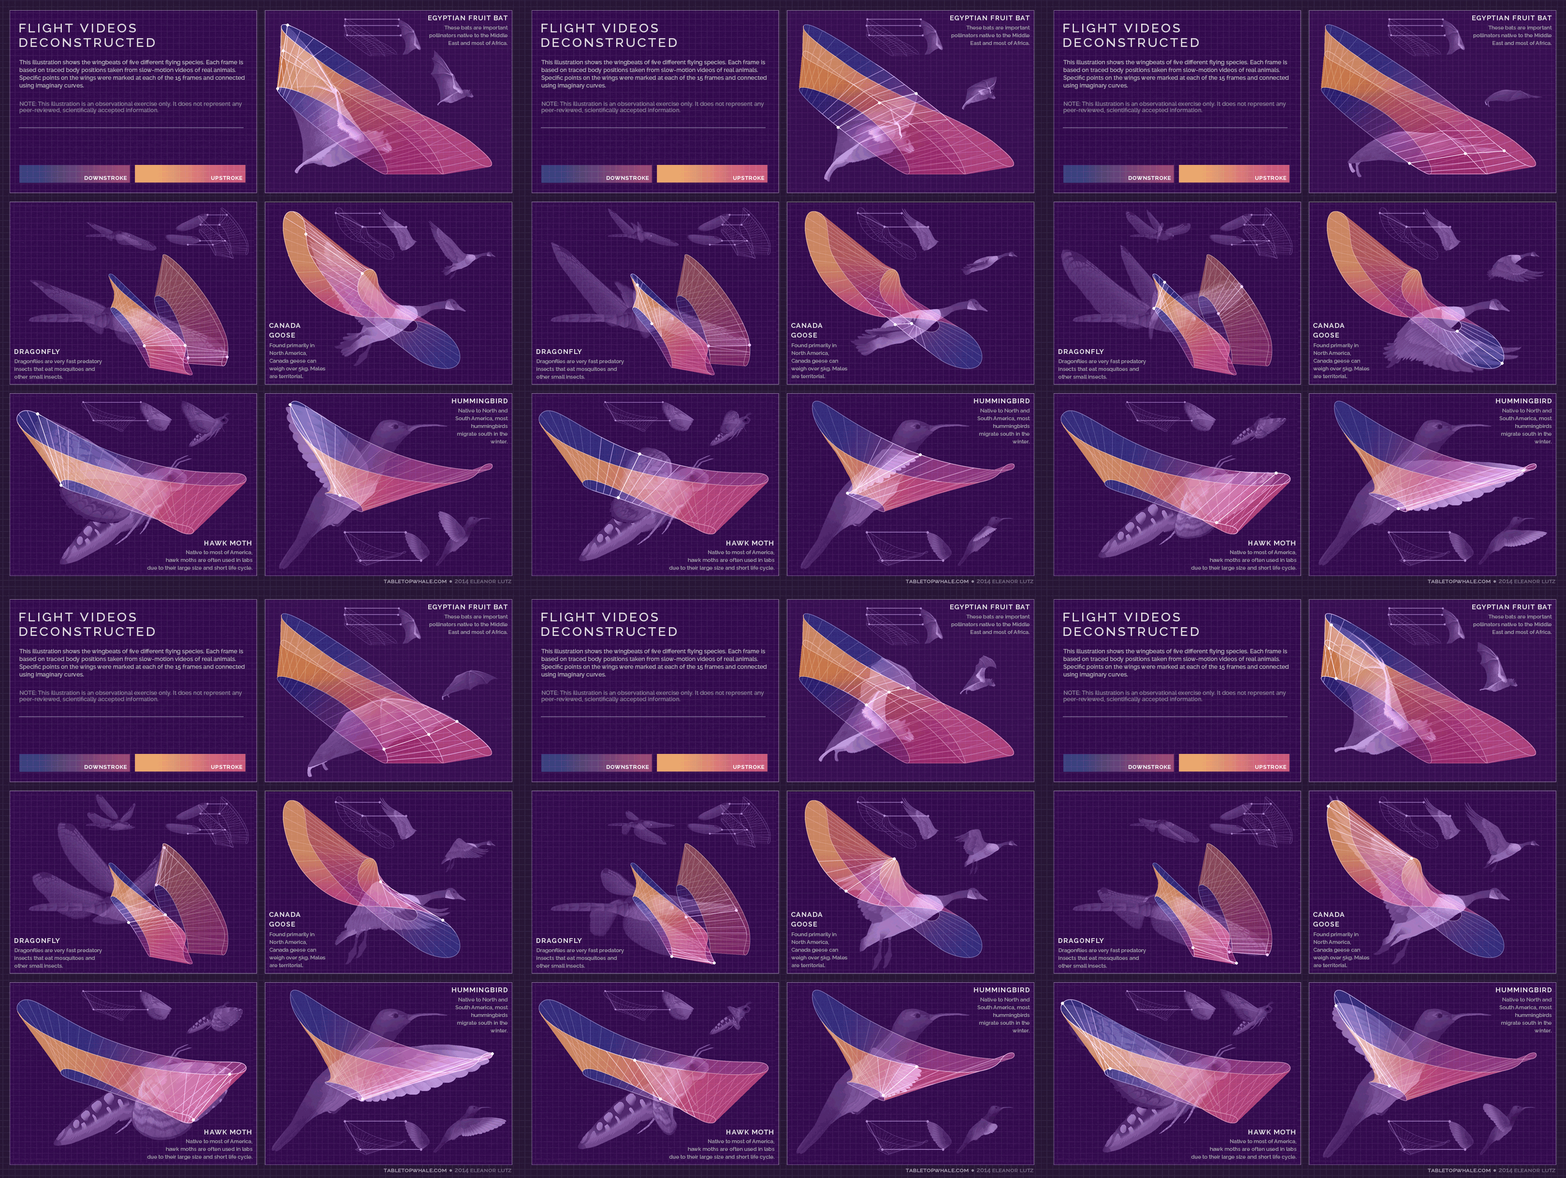
 

Flight Videos Deconstructed

Source: http://tabletopwhale.com/2014/09/29/flight-videos-deconstructed.html


With so many new and different formats of infographics available to today’s marketers, providing your audience with a story that conveys your message has never been more exciting. Sharing the key takeaways from your product or services can be done in an expertly designed way that appeals to your audience and leaves them wanting more. 

Wednesday
May272015

The Fallen of World War II

The Fallen of World War II from Neil Halloran on Vimeo.

The Fallen of World War II is an animated infographic video by Neil Halloran showing the scale of deaths in the U.S. and other countries involved in the war. He also has an experiemental interactive version at fallen.io

An animated data-driven documentary about war and peace, The Fallen of World War II looks at the human cost of the second world war and sizes up the numbers to other wars in history, including trends in recent conflicts.

Visit fallen.io for more information.

Love this! Very well done animated infographic video.

The stacks of icons shown for each country are 20 across, which is hard for most people to comprehend. We live in a Base-10 society, and showing the icons in rows of 10 would be much easier for audiences to understand.

There are a couple discrepancies as well. For example, the narration mentions that France lost 92,000 in the Battle of France, but the visualization only shows 86,000.

Also available on YouTube:

Tuesday
May122015

How to Make an Animated GIF Infographic

How to Make an Animated GIF Infographic Part 1

How to Make an Animated GIF Infographic Part 2

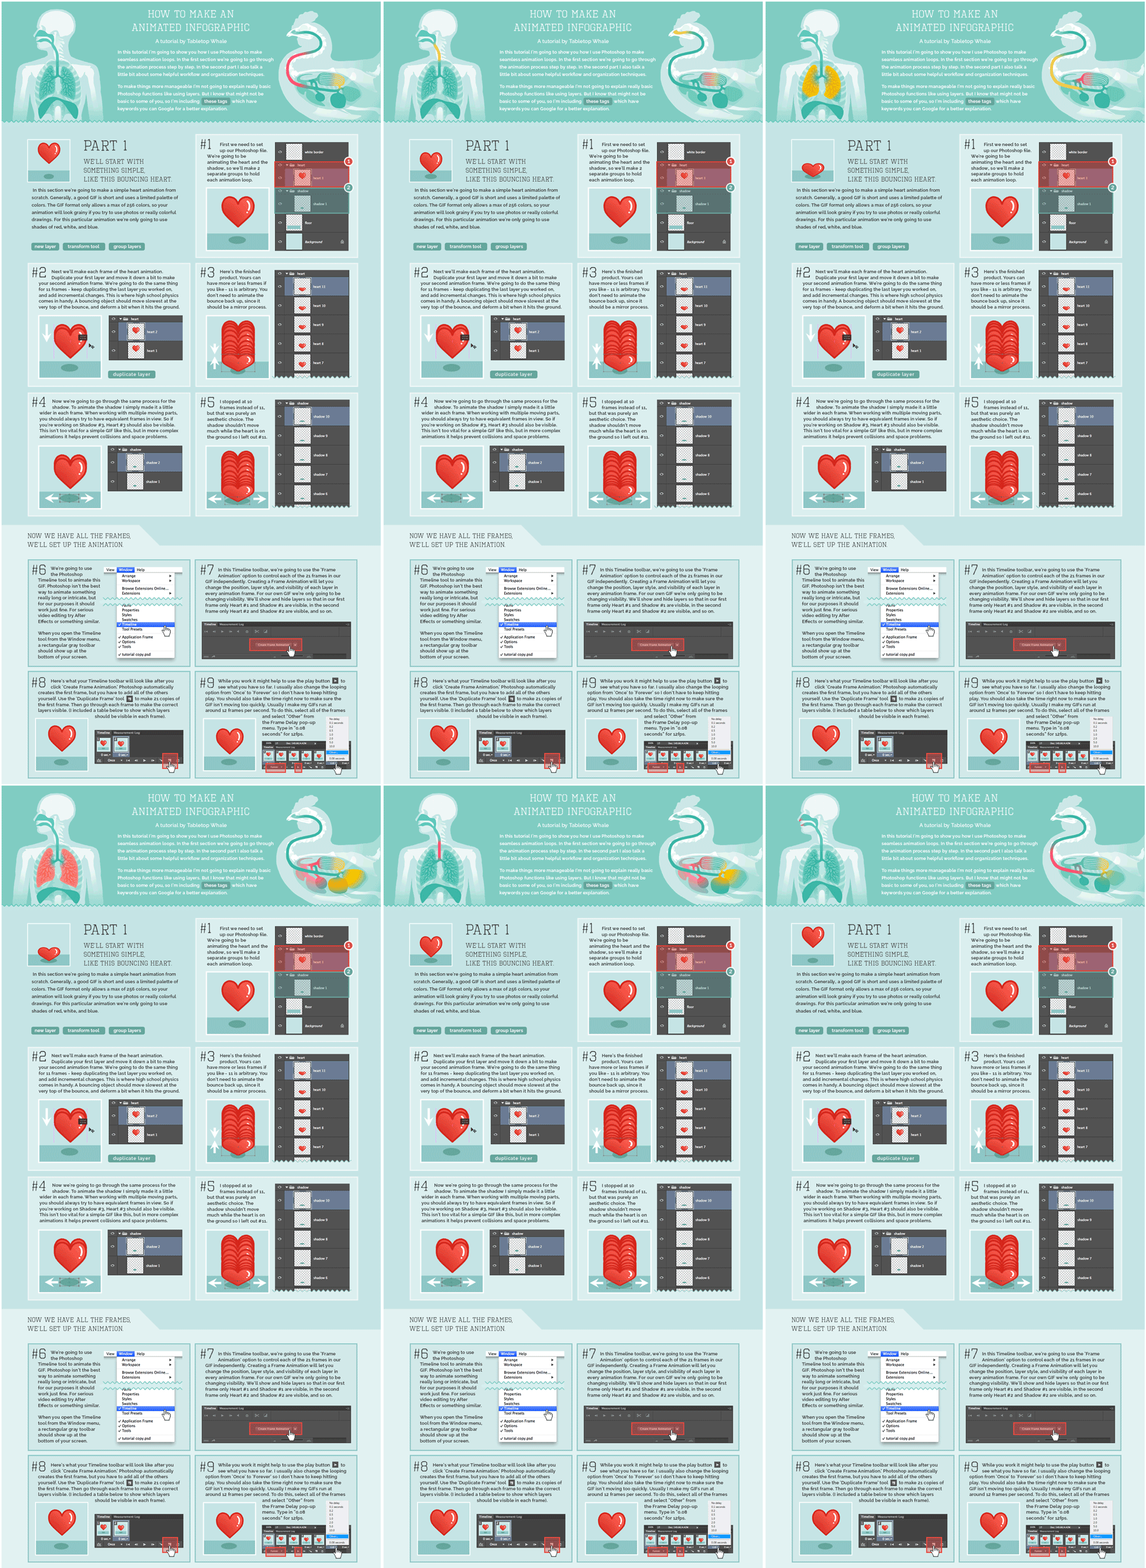
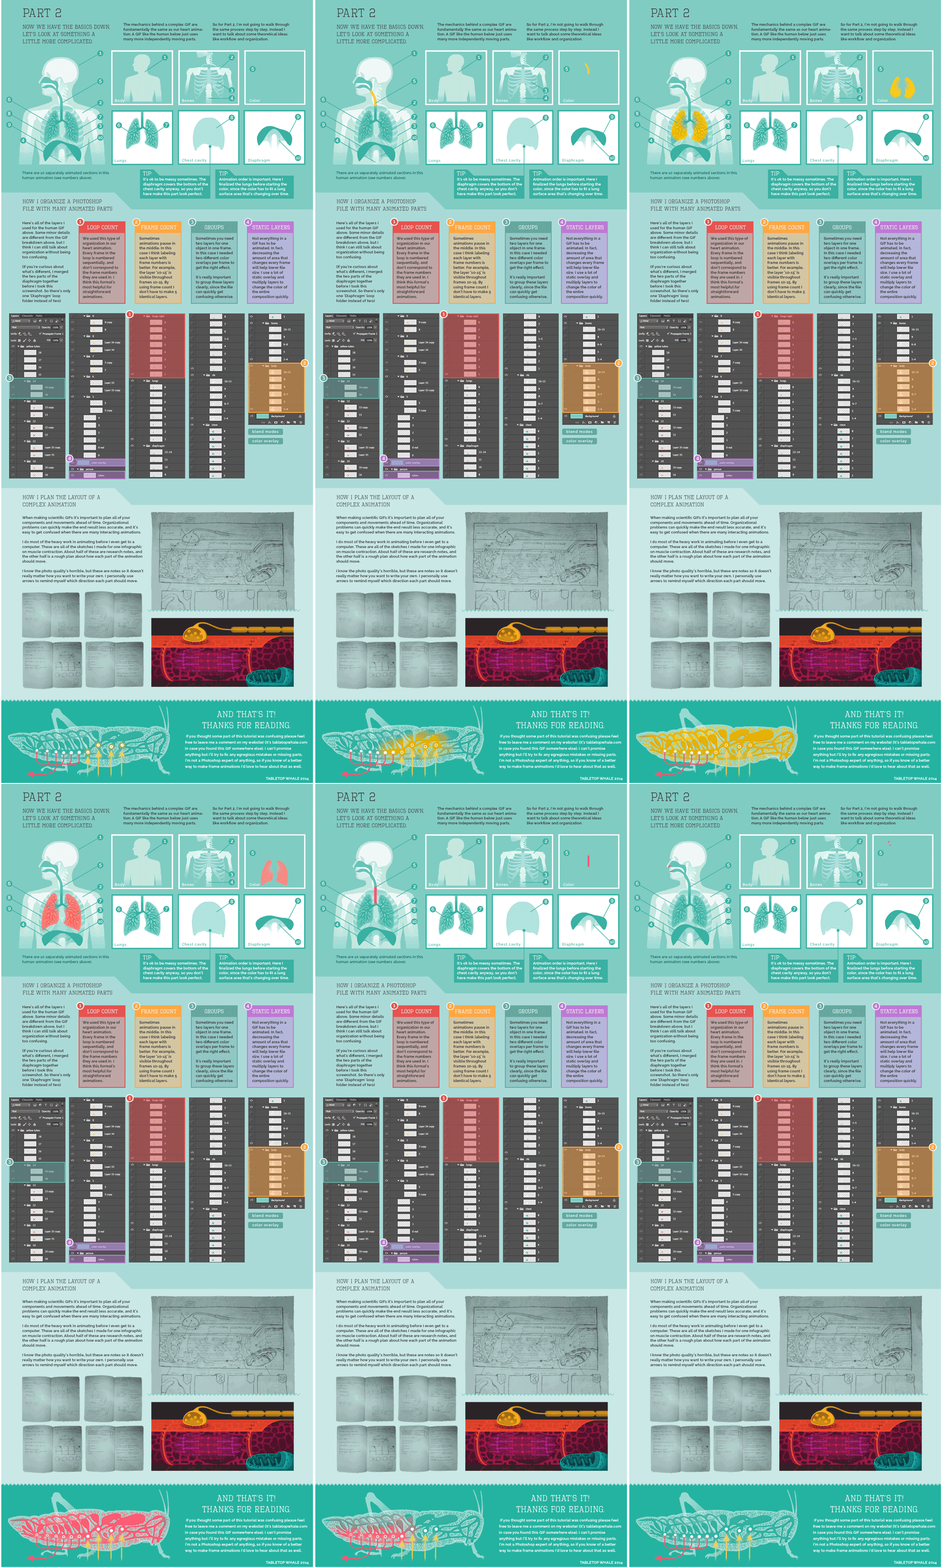
Eleanor Lutz has done some amazing design work with her company Tabletop Whale. She is known especially for her work creating animated infographics using animated GIF files. She has posted How to Make An Animated Infographic as a 2-part explanation that lays out her process in Photoshop (as an animated GIF file of course!).

Recently I’ve been getting a lot of emails asking for a tutorial on how to make animations. So this week I put together a quick explanation for anyone who’s interested. I archived it as a link on the menu bar of my website, so it’ll always be easy to find if you need it.

This is just a run-through of my own personal animation workflow, so it’s not a definitive guide or anything. There are plenty of other ways to make animations in Photoshop and other programs.

I’ve never tried making a tutorial about my own work before, so sorry in advance if it’s confusing! Let me know if there’s anything I wrote that didn’t make any sense. I’ll try to fix it if I can (though I probably don’t have room to go into detail about every single Photoshop function I mention).

I’m seeing more infographics as animated GIF image files online. Their advantage is that they are a self-contained image file that’s easy to share. No need for embed code or Javascript for readers to share the animation on other sites or social media.

I met Eleanor recently at the Malofiej Infographics World Summit, where she gave an amazing talk about her animated designs, her process, and even some discussion about when not to use animation. Check out the video interview with Eleanor by Visualoop at the conference:

Also found on VizWorld