About
Randy Krum
President of InfoNewt.
Data Visualization and Infographic Design

Infographic Design

Infographics Design | Presentations
Consulting | Data Visualizations

DFW DataViz Meetup

Join the DFW Data Visualization and Infographics Meetup Group if you're in the Dallas/Fort Worth area!

Search the Cool Infographics site

Custom Search

Subscriptions:


Feedburner

The Cool Infographics® Gallery:

How to add the
Cool Infographics button to your:

Cool Infographics iOS icon

- iPhone
- iPad
- iPod Touch


Read on Flipboard for iPad and iPhone

Featured in the Tech & Science category

Flipboard icon

Twitter Feed
From the Bookstore

Caffeine Poster

The Caffeine Poster infographic

« The U.S. Baby Bust | Main | Diabetes: The Silent Scourge »
Friday
Jun032016

The Global Air Transportation Network

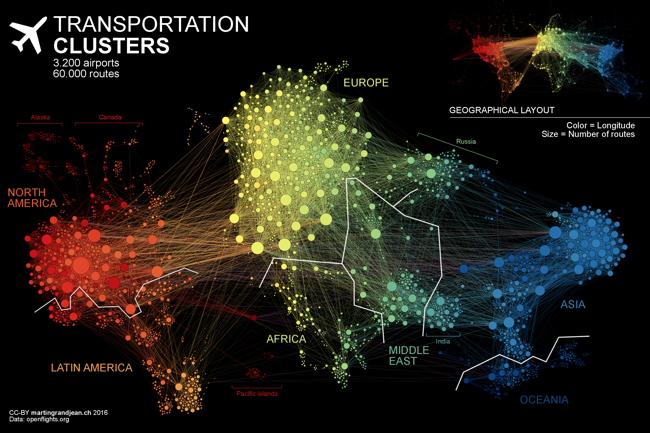
The Transportation Clusters infographic is a force-directed map of the 3,275 global airports and all of the connecting flight routes. Designed by Martin Grandjean, each bubble represents an individual airport and the bubble sizes represents the number of flight routes (37,153 routes in total) based on OpenFlights.org data.

People travel not just more frequently, but increasingly far and quickly. Mapping the connections between all the airports worldwide is a fascinating network visualization exercise.

This post (which may be followed by further experimentations in this area) is an attempt to make explicit the network behind air transport. The structure of the relationships has an impact on the spatial distribution of nodes in a graph. Let’s see how this landscape is reorganized without geographical constraints.

This “map” is the result of the application of a force-directed layout algorithm on a graph of 3.275 airports (37.153 single routes – the weighted total is higher because many airlines take the same route), based on OpenFlights.org data. Naturally, network geography is not completely disrupted: the continents are mostly visible and regions are generally in their original position (with the exception of the Pacific islands that connect Asia and America – imagine this graph in three dimensions, with the Pacific Ocean behind). Major observations: India is more connected to the Middle East than to South and East Asia. The Russian cluster is very visible, connecting airports in Russia but also in many former Soviet republics. Latin america is clearly divided between a South cluster and a Central American cluster very connected with the U.S.

The force-directed layout spaces the bubbles apart so there are no overlapping bubbles. The color coding is a color spectrum based on longitude, and generally groups airports from the same continent together. The total number of flights is much higher than the number of routes because many airlines share the same routes. I would like to see a version that weights the connecting lines with the number of flights that share that same route.

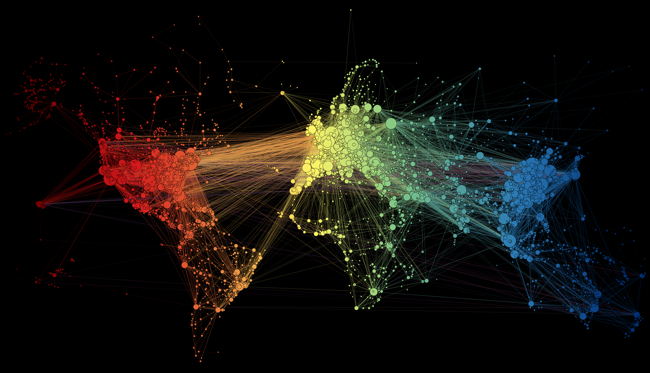
Here you can see the original map with the bubbles accurately located geographically, but a lot of overlap based on close proximity of the airports:

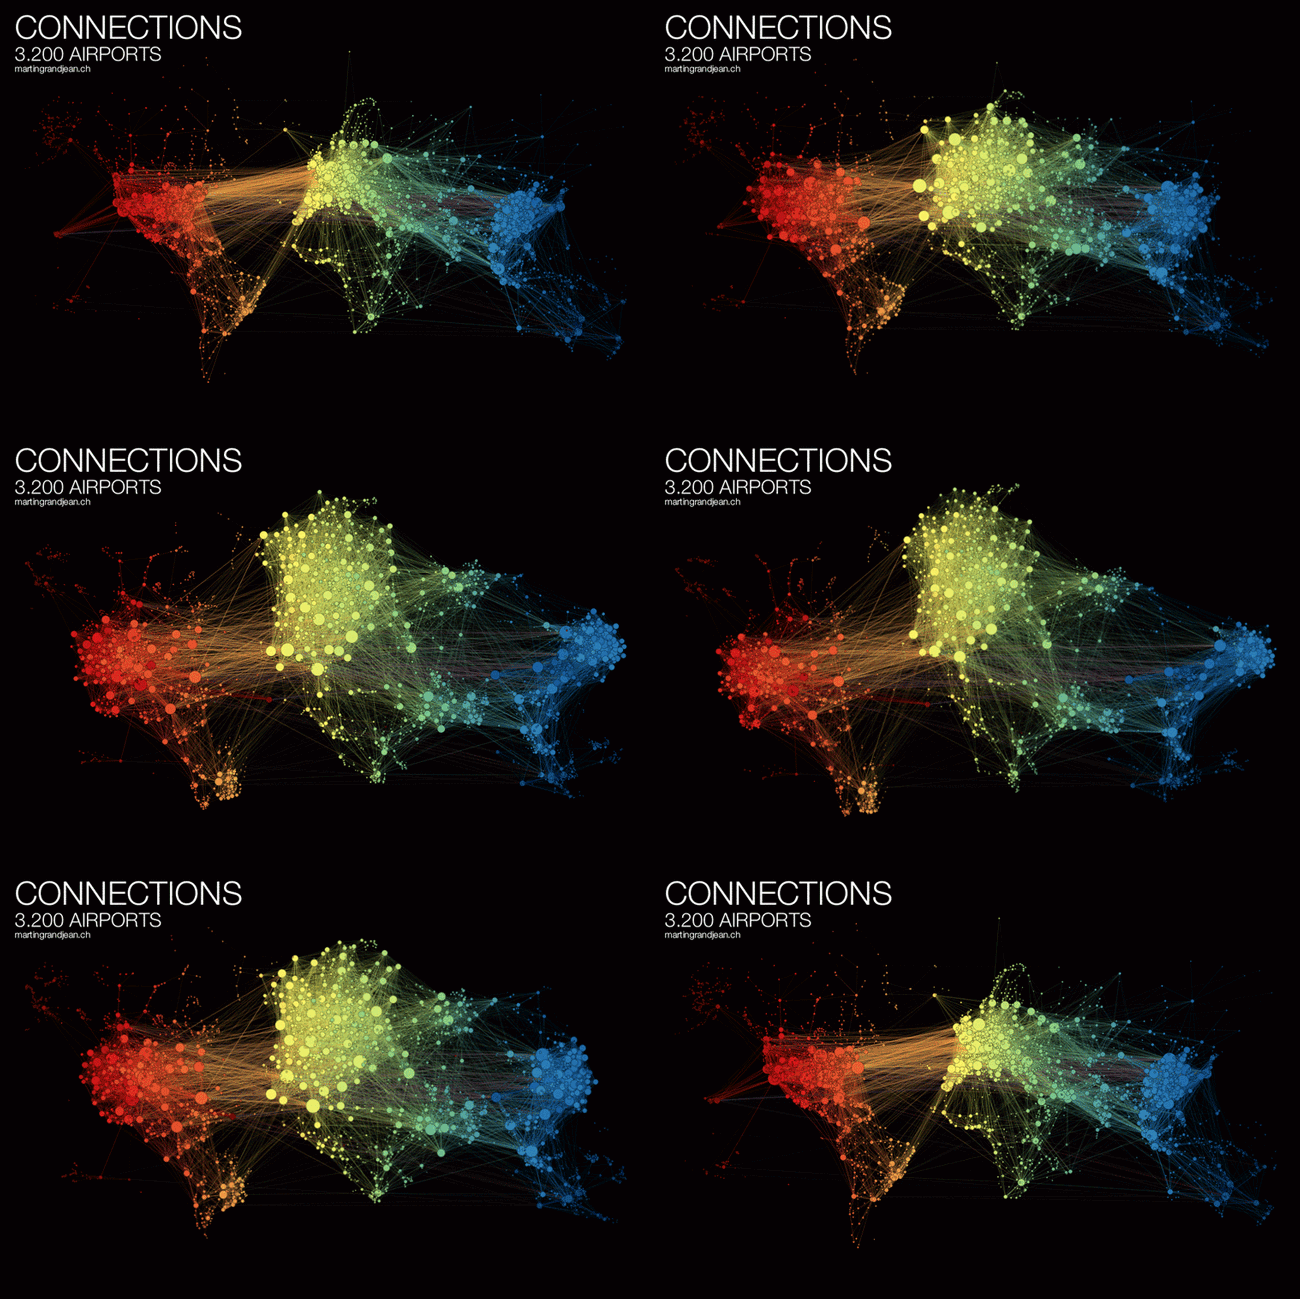
Martin also published a cool animated GIF and YouTube video of the change from geographical to force-directed layout.


Found on FlowingData

PrintView Printer Friendly Version

EmailEmail Article to Friend

Reader Comments (8)

A foolishly Euro-centric - and falsely-advertised - view of the world that completely ignores trans-Pacific traffic entirely! Layout choices skew the data to distort and over-emphasize the importance of Europe. #DataFail #FramingEffectBias
June 4, 2016 | Unregistered Commenterbrizone
I disagree Brizone. The trans-Pacific flights are all included, shown in the visualization, and described in the designer's description. It isn't skewing or over emphasizing Europe. The algorithm is visually highlighting the larger number of airports and flight routes connecting through Europe because that's what the data shows. It's a new way to visualize the data that may reveal new insights.

Your concern might be more appropriately directed at the OpenFlights.org data. Do you believe the underlying data is skewed?
June 4, 2016 | Registered CommenterRandy
aren't the lines the routes? where are the trans-Pacific routes? I don't see Naruto to Midwest or Singapore to west coast routes, two of the busiest air routes on that part of the world? or I just don't grasp the whole thing?
June 10, 2016 | Unregistered CommenterLouie
The Pacific routes connect across the back, as if looking at a globe, instead of running off the left and right sides of the page.
June 13, 2016 | Registered CommenterRandy
Individuals travel not simply more often, but rather progressively far and rapidly. Mapping the associations between every one of the airplane terminals worldwide is an intriguing system representation work out.
June 6, 2017 | Unregistered Commenterpackers5th.in
Wow!! Really awesome air transport network, thanks for sharing such a nice and informative blog.I really appreciate your effort!
July 4, 2017 | Unregistered CommenterPackers5th.in
WEBTRACKKER Technology is the best SAP MM Training Institute in Noida with live projects with 100% job assistanceS open the link
Valuable information and excellent design you got here! I would like to thank you for sharing your thoughts into the stuff you post!!
Editor Permission Required
While we are migrating to a new site design, you must have editing permission for this entry in order to post comments.