About
Randy Krum
President of InfoNewt.
Data Visualization and Infographic Design

Infographic Design

Infographics Design | Presentations
Consulting | Data Visualizations

DFW DataViz Meetup

Join the DFW Data Visualization and Infographics Meetup Group if you're in the Dallas/Fort Worth area!

Search the Cool Infographics site

Custom Search

Subscriptions:


Feedburner

The Cool Infographics® Gallery:

How to add the
Cool Infographics button to your:

Cool Infographics iOS icon

- iPhone
- iPad
- iPod Touch


Read on Flipboard for iPad and iPhone

Featured in the Tech & Science category

Flipboard icon

Twitter Feed
From the Bookstore

Caffeine Poster

The Caffeine Poster infographic

Entries in war (18)

Wednesday
May272015

The Fallen of World War II

The Fallen of World War II from Neil Halloran on Vimeo.

The Fallen of World War II is an animated infographic video by Neil Halloran showing the scale of deaths in the U.S. and other countries involved in the war. He also has an experiemental interactive version at fallen.io

An animated data-driven documentary about war and peace, The Fallen of World War II looks at the human cost of the second world war and sizes up the numbers to other wars in history, including trends in recent conflicts.

Visit fallen.io for more information.

Love this! Very well done animated infographic video.

The stacks of icons shown for each country are 20 across, which is hard for most people to comprehend. We live in a Base-10 society, and showing the icons in rows of 10 would be much easier for audiences to understand.

There are a couple discrepancies as well. For example, the narration mentions that France lost 92,000 in the Battle of France, but the visualization only shows 86,000.

Also available on YouTube:

Thursday
May302013

Drones Kill - Animated, Interactive Visualization

Drones Kill - Animated, Interactive Visualization

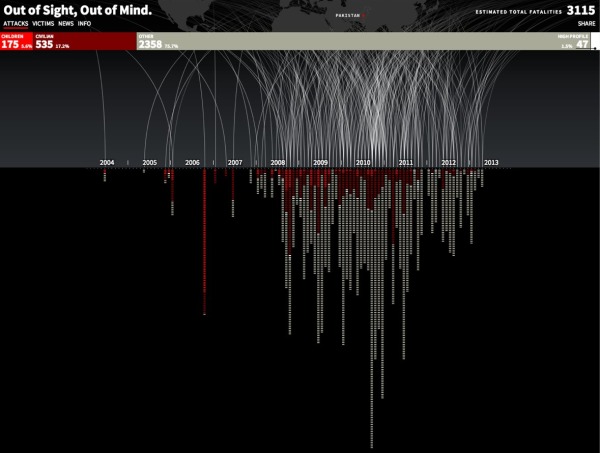
Great data visualization design from Pitch Interactive.  Out of Site, Out of Mind is an animated data visualization of every U.S. drone strike in Pakistan since 2004 and the associated kills reported in the news.  There is also an interactive element is that the readers can hover their pointer over the visualization an more details appear in a popup window.  Visit the original site to see the animation.

Since 2004, the US has been practicing in a new kind of clandestine military operation. The justification for using drones to take out enemy targets is appealing because it removes the risk of losing American military, it’s much cheaper than deploying soldiers, it’s politically much easier to maneuver (i.e. flying a drone within Pakistan vs. sending troops) and it keeps the world in the dark about what is actually happening. It takes the conflict out of sight, out of mind. The success rate is extremely low and the cost on civilian lives and the general well-being of the population is very high. This project helps to bring light on the topic of drones. Not to speak for or against, but to inform and to allow you to see for yourself whether you can support drone usage or not.

The visualization is created in HTML5 and JavaScript. We recommend Chrome for the best viewing experience.

The challenge with gathering the data and how drone attacks are represented in the news is shown by the large OTHER category of victims.  Also, it’s the largest category of victims.  A data visualization like this is a tremendously effective way to bring this issue to light.

The category of victims we call “OTHER” is classified differently depending on the source. The Obama administration classifies any able-bodied male a military combatant unless evidence is brought forward to prove otherwise. This is a very grey area for us. These could be neighbors of a target killed. They may all be militants and a threat. What we do know for sure is that they are targeted without being given any representation or voice to defend themselves.

The visualization was created by Wesley Grubbs, and there is a video interview of him about the data visualziation process by The Huffington Post.

Thanks to Ray for sending in the link!

Tuesday
May152012

Ingeniously Charting The Horrifying Power of Today's Nuclear Bombs

Ingeniously Charting The Horrifying Power of Today's Nuclear Bombs


Anyone remember what color the “tons” were on the infographic?  The Ingeniously Charting The Horrifying Power of Today’s Nuclear Bombs infographic by Maximilian Bode (posted on fastcodesign.com) puts the power of the Tsar bomb into painful perspective (but seriously my fingers hurt from scrolling). 

A simple, but great design that puts some truly huge numbers into scale for the reader to understand.

Monday
Sep122011

Client Infographic: Sudan, Bombing Everything That Moves


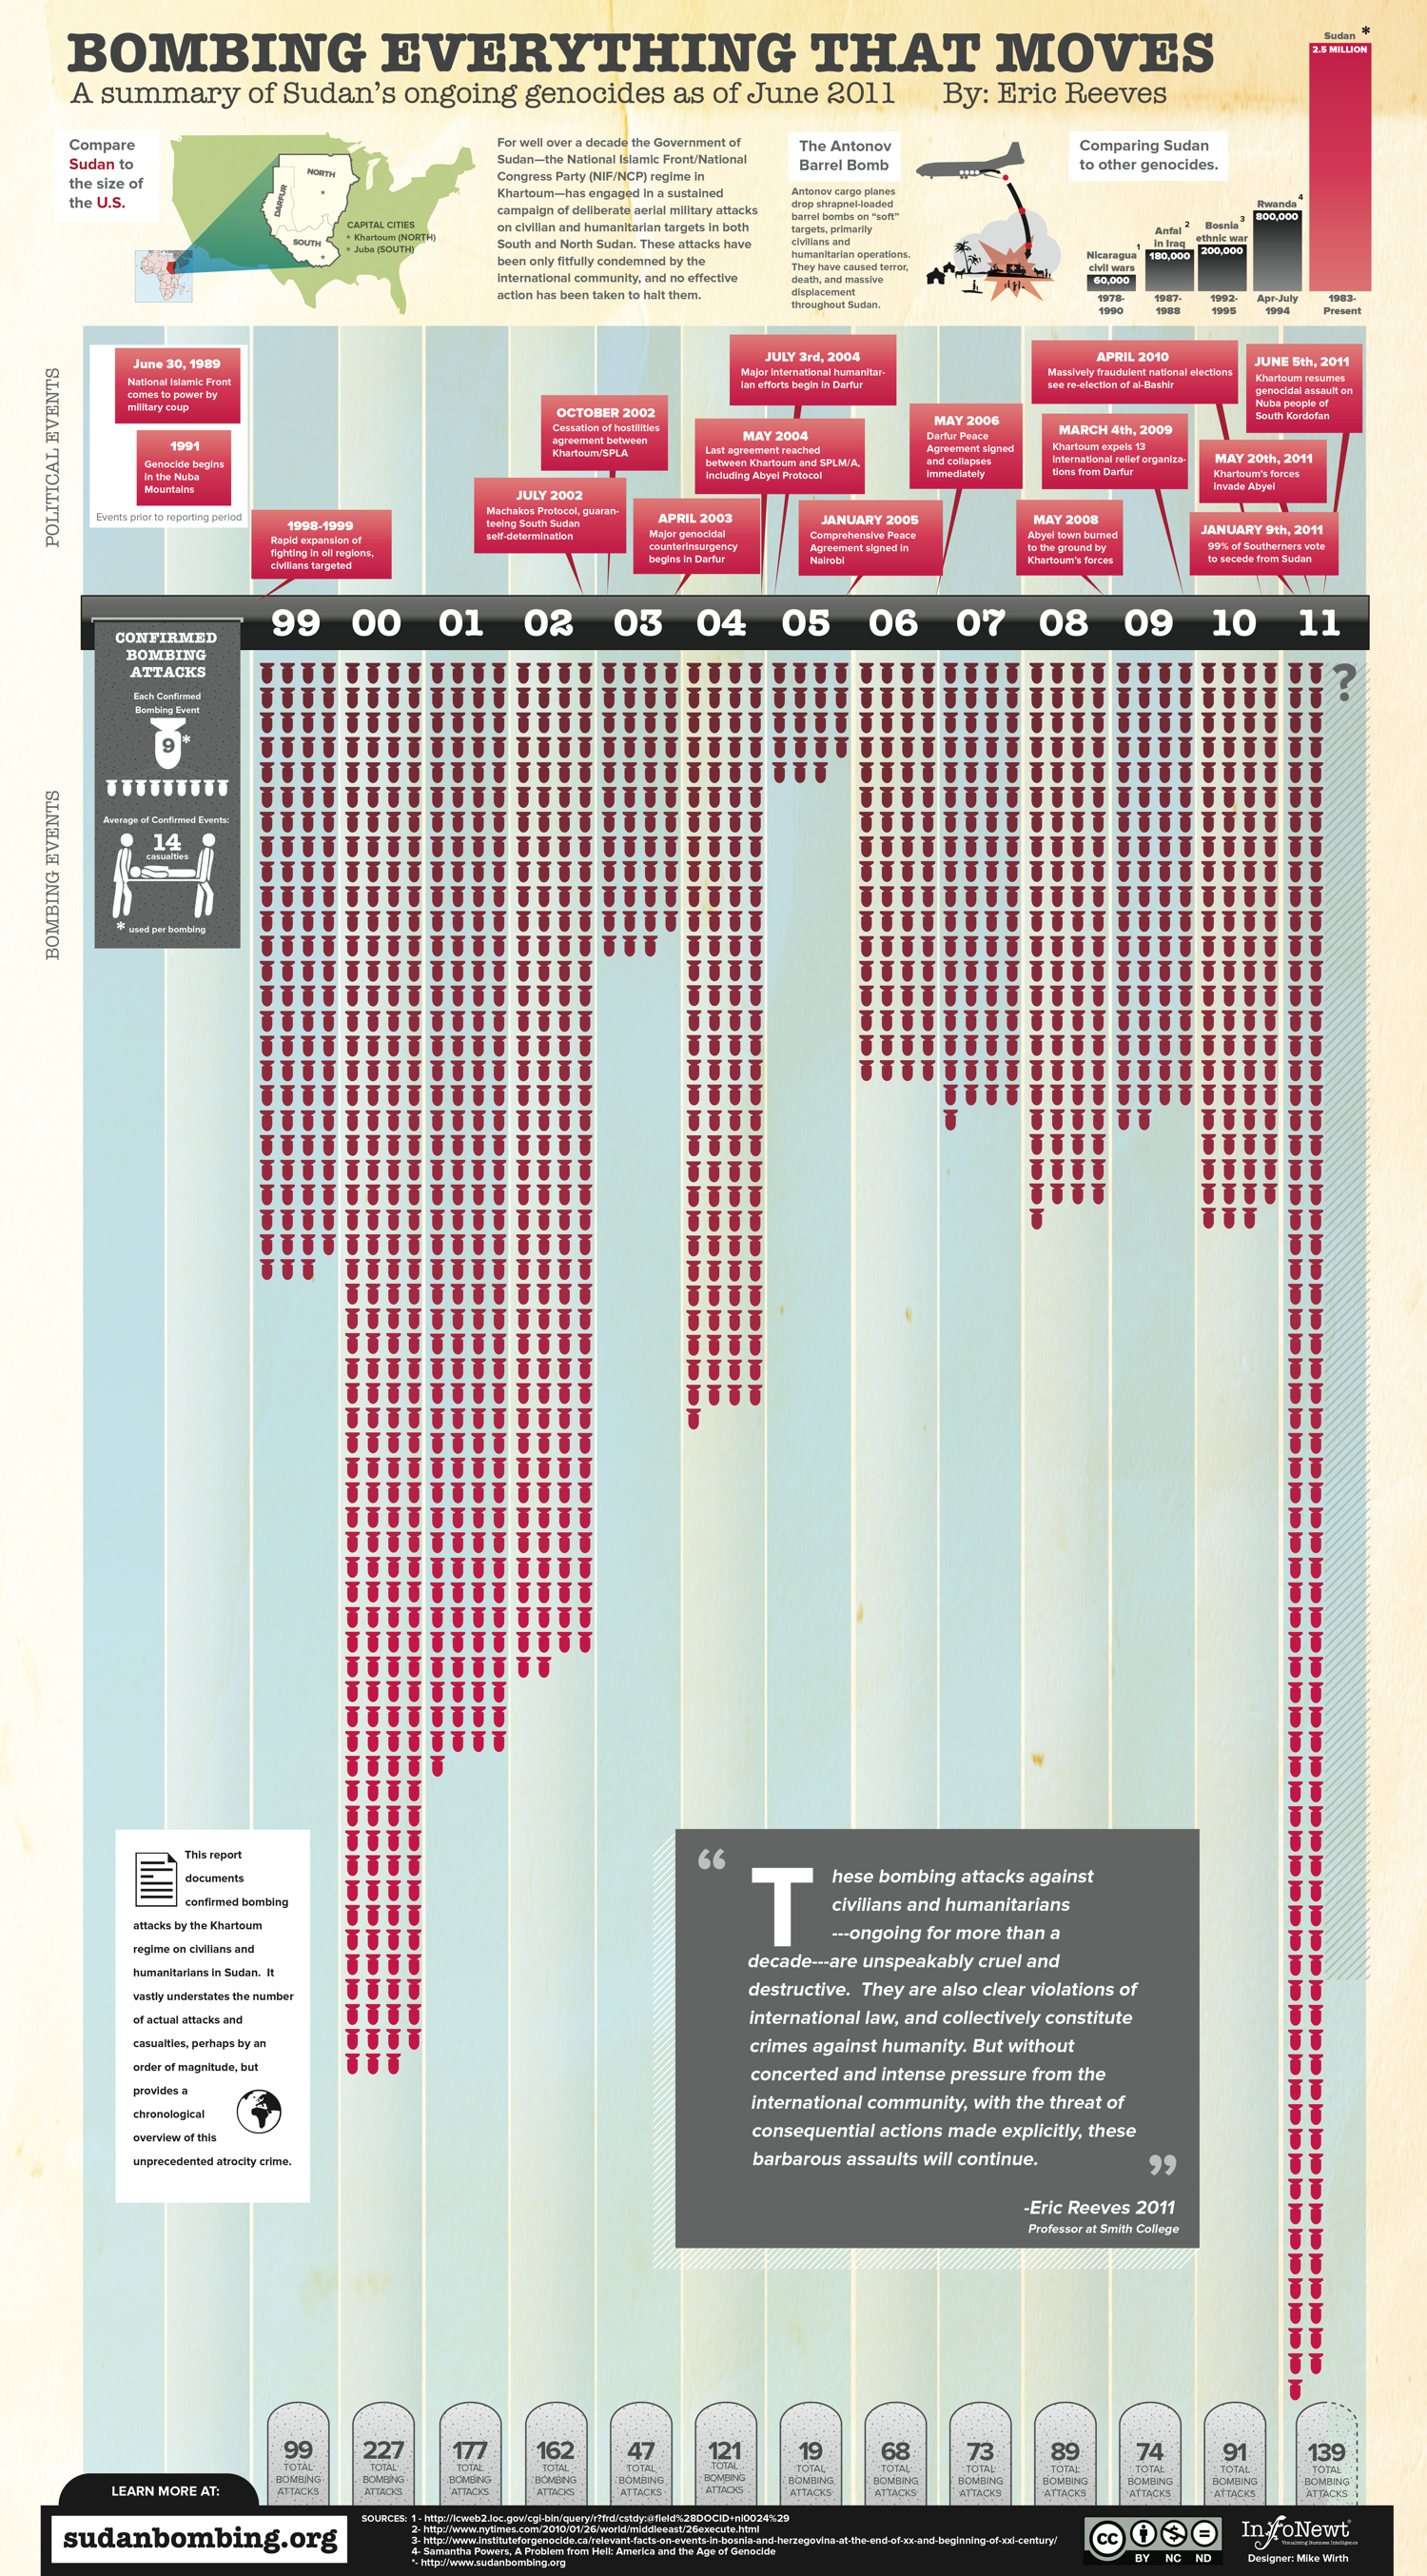
Sometimes, you get the opportunity to work on a project with a very serious topic and global relevance.  Recently, InfoNewt (my company) worked with Prof. Eric Reeves and designer Mike Wirth to design the infographic Bombing Everything That Moves (hosted on Eric’s site SudanBombing.org). 

For well over a decade the Government of Sudan—the National Islamic Front/National Congress Party (NIF/NCP) regime in Khartoum—has engaged in a sustained campaign of deliberate aerial military attacks on civilian and humanitarian targets in both South and North Sudan. These attacks have been only fitfully condemned by the international community, and no effective action has been taken to halt them.

Obviously, the topic is very political.  Prof. Reeves has published an extensive report and makes his Excel data file available to everyone on his site, so I’ll keep my comments focused on the unique challenges we faced when designing the infographic.

The data for this visualization is much different that the readily available Internet stats we see every day.  There is no database to query or reseach data file to purchase.  The exhaustive work Prof. Reeves has done to manually consolidate these confirmed bombing attack reports from U.N. observers, humanitarian aid personnel, radio reports and news reports is a massive, ongoing effort.

Even though the number of attacks in the report was known, most reports had unknown numbers for casualties and the number of bombs used in the attack.  Because of that, the bar chart-style visualization that is the center of the design only shows the number of attacks (a solid number we could work with) and separately shows the average numbers of bombs and casualties from the reports that had that information available.

Data transparency is always important.  As an infographic, the data sources have to be very transparent becuase you want your audience talking about the implications of your information, not challenging your credibility.

Eric Reeves is Professor of English Language and Literature at Smith College in Northampton, Massachusetts. He has spent the past twelve years working full-time as a Sudan researcher and analyst, publishing extensively both in the US and internationally. He has testified several times before the Congress, has lectured widely in academic settings, and has served as a consultant to a number of human rights and humanitarian organizations operating in Sudan.

Due to the nature of this infographic, please keep any comments on the infographic design itself.  Any inflamatory or political comments will be removed based on my judgement.

Thursday
Jun232011

Stuxnet: Anatomy of a Computer Virus [video]

Stuxnet: Anatomy of a Computer Virus from Patrick Clair on Vimeo.


Stuxnet: Anatomy of a Computer Virus is a video that claims to be a “motion infographic.”  Created by Patrick Clair, it explores some of the information that has emerged as people have been dissecting the Stuxnet computer virus.

An infographic dissecting the nature and ramifications of Stuxnet, the first weapon made entirely out of code.

I really like the idea of motion infographics, but I disagree that moving text and animation make this an infographic.  There is a lot of information, but there aren’t any data visualizations.  There were a couple of animations that looked like data visualizations, but they’re vague and don’t convey any data to the viewer.

I really like the video, the topic of weaponized software is fascinating and the Security Now podcast #291 has a really good explanation of what has been publicly learned about the virus.

Question for everyone reading: “Does informative = infographic?”

Direction and Motion Graphics: Patrick Clair patrickclair.com
Written by: Scott Mitchell

Found on Visual News

The video is now also available on YouTube:

Monday
May302011

The History of Memorial Day #infographic


Appropriate and timely for the holiday today in the U.S., imortuary.com brings us I Remembered A Vet Today infographic about the history and ways to commemorate Memorial Day.

Memorial Day is commemorated in many ways to show respect for those who have died for serving our country.  Whether visiting a national cemetary or gathering with friends and family, take time to participate in the National Moment of Remembrance at 3 p.m. local time to observe a moment of silence.

Designed by the team at KillerInfographics.com.  Thanks to Charlie for sending in the link!

Thanks to all of our troops!

Sunday
Feb152009

The Browser Wars Infographic


Great timeline infographic depicting the rise and fall of different browsers portrayed as knights marching across a field.  The data set used is available here.

It took me a while to find any information about the author, but I found this description on the Wired.com blog.

Here's a creative look at the history of the browser wars from 2002 through mid-2008. The infographic was submitted to Reddit by a user named BovingdonBug. He says he created it as part of an application for a graphic design job on a newspaper.
 Thanks Alwyn for the link!

Friday
Dec122008

The Nuclear Express


From NYTimes.com, this graphic is a summary of the proliferation of nuclear weapons based on the new book "The Nuclear Express: A Political History of the Bomb and Its Proliferation" by Thomas C. Reed and Danny B. Stillman.  The graphic is part of the NY Times article titled "Hidden Travels of the Atomic Bomb".
"The Nuclear Express" a new book on the history of the atomic age, describes the interlocking web of influence and espionage behind the proliferation of nuclear technology.  This diagram gives a summary of the authors' tracking of the transfers of nuclear technology and secrets.
Thanks Jesse for sending in the link.

Monday
Dec082008

The Hidden Cost of War

Friday
Jul042008

U.S. Flag Infographic

For the 4th of July, I wanted to post a new link to the U.S. flag as an infographic, but it looks like the "Meet The World" brazilian website that I posted about in February 2008 is down right now.  I still have the image, and its from the flag series by artist Icaro Doria. 

Icaro Doria is Brazilian, 25 and has been working for the magazine Grande Reportagem, in Lisbon, Portugal, for the last 3 years. He is part of the team (with Luis Silva Dias, João Roque, Andrea Vallenti and João Roque) that produced the flags campaign which has been circulating the Earth in chain letters via e-mail.