About
Randy Krum
President of InfoNewt.
Data Visualization and Infographic Design

Infographic Design

Infographics Design | Presentations
Consulting | Data Visualizations

DFW DataViz Meetup

Join the DFW Data Visualization and Infographics Meetup Group if you're in the Dallas/Fort Worth area!

Search the Cool Infographics site

Custom Search

Subscriptions:


Feedburner

The Cool Infographics® Gallery:

How to add the
Cool Infographics button to your:

Cool Infographics iOS icon

- iPhone
- iPad
- iPod Touch


Read on Flipboard for iPad and iPhone

Featured in the Tech & Science category

Flipboard icon

Twitter Feed
From the Bookstore

Caffeine Poster

The Caffeine Poster infographic

Entries in weapons (5)

Thursday
Oct062016

7 Times Technology Almost Destroyed The World

7 Times Technology Almost Destroyed The World infographic

7 Times Technology Almost Destroyed The World is a scary infographic from Hudman.

The importance of thoroughly testing new technology is highlighted in this infographic. We take a light-hearted, yet terrifying look at how close the human race has come to destroying all life on planet earth.

Fun, engaging information! From a design perspective, there's way too much text in this infographic, and the font size is too small to easily read. So much text, it will probably turn away many readers before they read any of the information.

Simplify, simplify, simplify! Shorter descriptions and larger icons or illustrations will draw in readers to engage with the infographic.

Thursday
May302013

Drones Kill - Animated, Interactive Visualization

Drones Kill - Animated, Interactive Visualization

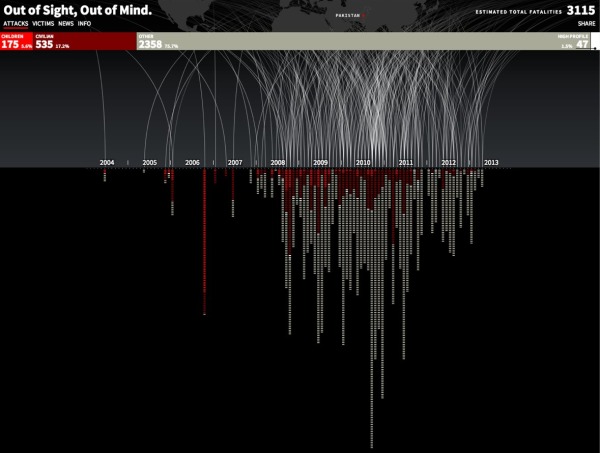
Great data visualization design from Pitch Interactive.  Out of Site, Out of Mind is an animated data visualization of every U.S. drone strike in Pakistan since 2004 and the associated kills reported in the news.  There is also an interactive element is that the readers can hover their pointer over the visualization an more details appear in a popup window.  Visit the original site to see the animation.

Since 2004, the US has been practicing in a new kind of clandestine military operation. The justification for using drones to take out enemy targets is appealing because it removes the risk of losing American military, it’s much cheaper than deploying soldiers, it’s politically much easier to maneuver (i.e. flying a drone within Pakistan vs. sending troops) and it keeps the world in the dark about what is actually happening. It takes the conflict out of sight, out of mind. The success rate is extremely low and the cost on civilian lives and the general well-being of the population is very high. This project helps to bring light on the topic of drones. Not to speak for or against, but to inform and to allow you to see for yourself whether you can support drone usage or not.

The visualization is created in HTML5 and JavaScript. We recommend Chrome for the best viewing experience.

The challenge with gathering the data and how drone attacks are represented in the news is shown by the large OTHER category of victims.  Also, it’s the largest category of victims.  A data visualization like this is a tremendously effective way to bring this issue to light.

The category of victims we call “OTHER” is classified differently depending on the source. The Obama administration classifies any able-bodied male a military combatant unless evidence is brought forward to prove otherwise. This is a very grey area for us. These could be neighbors of a target killed. They may all be militants and a threat. What we do know for sure is that they are targeted without being given any representation or voice to defend themselves.

The visualization was created by Wesley Grubbs, and there is a video interview of him about the data visualziation process by The Huffington Post.

Thanks to Ray for sending in the link!

Thursday
May242012

The Evolution of the Handgun

The Evolution of the Handgun infographic

There have been literally thousands of different gun models, but The Evolution of the Handgun infographic from GunVault.com covers most of the major advancements in handgun design.

I really like the first two sections of this design, and I think the last section was unnecessary.  The timeline and the gun specifications sections do a good job of laying out the data and keeping it simple.  The barrel length and the calibers of each model work very nicely.  Since the # of Rounds data is quantitative, I would suggest visualizing that as a series of circles instead of a solid bar to better communicate quantity.  

The last section adds a lot of text, repeats the data from the second section and makes the overall infographic gratuitously long.  The flags showing the country of origin could easily have been added to the earlier sections.

Thanks to Archie for sending in the link!

Tuesday
May152012

Ingeniously Charting The Horrifying Power of Today's Nuclear Bombs

Ingeniously Charting The Horrifying Power of Today's Nuclear Bombs


Anyone remember what color the “tons” were on the infographic?  The Ingeniously Charting The Horrifying Power of Today’s Nuclear Bombs infographic by Maximilian Bode (posted on fastcodesign.com) puts the power of the Tsar bomb into painful perspective (but seriously my fingers hurt from scrolling). 

A simple, but great design that puts some truly huge numbers into scale for the reader to understand.

Thursday
Jun232011

Stuxnet: Anatomy of a Computer Virus [video]

Stuxnet: Anatomy of a Computer Virus from Patrick Clair on Vimeo.


Stuxnet: Anatomy of a Computer Virus is a video that claims to be a “motion infographic.”  Created by Patrick Clair, it explores some of the information that has emerged as people have been dissecting the Stuxnet computer virus.

An infographic dissecting the nature and ramifications of Stuxnet, the first weapon made entirely out of code.

I really like the idea of motion infographics, but I disagree that moving text and animation make this an infographic.  There is a lot of information, but there aren’t any data visualizations.  There were a couple of animations that looked like data visualizations, but they’re vague and don’t convey any data to the viewer.

I really like the video, the topic of weaponized software is fascinating and the Security Now podcast #291 has a really good explanation of what has been publicly learned about the virus.

Question for everyone reading: “Does informative = infographic?”

Direction and Motion Graphics: Patrick Clair patrickclair.com
Written by: Scott Mitchell

Found on Visual News

The video is now also available on YouTube: