About
Randy Krum
President of InfoNewt.
Data Visualization and Infographic Design

Infographic Design

Infographics Design | Presentations
Consulting | Data Visualizations

DFW DataViz Meetup

Join the DFW Data Visualization and Infographics Meetup Group if you're in the Dallas/Fort Worth area!

Search the Cool Infographics site

Custom Search

Subscriptions:


Feedburner

The Cool Infographics® Gallery:

How to add the
Cool Infographics button to your:

Cool Infographics iOS icon

- iPhone
- iPad
- iPod Touch


Read on Flipboard for iPad and iPhone

Featured in the Tech & Science category

Flipboard icon

Twitter Feed
From the Bookstore

Caffeine Poster

The Caffeine Poster infographic

Entries in Halloween (12)

Friday
Oct302015

Fun Facts About Candy Corn

Fun Facts About Candy Corn infographic

Happy National Candy Corn Day! The Fun Facts About Candy Corn infographic from Trillion Creative gives some interesting details about Halloween's most iconic candy.

Candy corn has become inextricably linked to Halloween. As the holiday approaches, you will be tempted by bags upon bags of candy corn available at all different kinds of retailers. Candy corn has been a part of the Halloween “brand” since 1880, originally developed to resemble a corn kernel to appeal to America’s farmers and their families. What is it about this little kernel of sugar that has made such a lasting impact on America’s celebration of Halloween?

Thanks to Larissa for sending in the link!

Friday
Oct312014

How to Make Your Shed Zombie Proof

How to Make Your Shed Zombie Proof infographic

How to Make Your Shed Zombie Proof from What Shed? is a fun, sharable infographic that ties their business (garden sheds) to the current obsession with zombies and Halloween!

Zombies seem to have become ever more popular in recent years, despite the fact that they are almost entirely fictional (unless you’re one of the small group of people that actually really believe they are real).

Anyway as its coming up to Halloween we thought we would do a small guide to help you protect yourself just in case you happen to be part of a Zombie Apocalypse this Halloween.

Good example of telling one story well in an infographic, and making the topic relevant to your business. There’s nothing wrong with choosing a fun topic, but it’s important to tie it back to your industry.

The footer should include the URL back to the infographic landing page so readers can find the original.

Thanks to David for sending in the link!

Friday
Oct112013

Zombies vs. Mobile Storage Containers

Zombies VS Door to Door Storage infographic

The Walking Dead return this weekend! Why should you buy a mobile storage unit? Because in the event of a zombie apocalypse, you’d be prepared! With this comical visual, Door to Door uses zombie apocalypse scenarios in it’s 10 Ways to Use a Door to Door Storage Mobile Storage Container in the Event of a Zombie Apocalypse (long title!) infographic to point out the strengths of their storage units.

Bottom Line: If you’re prepping for the zombie apocalypse or, you know, looking to move somewhere new or store your belongings, visit us at www.DoorToDoor.com.

Definitely a fun way to use an infographic to raise your brand awareness!

Thanks to Jayson for sending in the link!

Monday
Oct292012

Halloween Statistics 2012: Creepy Calculations

 Halloween Statistics 2012: Creepy Calculations infographic

It is that time of the year again! Halloween is the perfect time for costumes, scary movies, and Charlie Brown! How do you spend your halloween? Halloweencostumes.com has put together some Creepy Halloween Statistics to show some of this holiday’s most popular happenings. 

What are you most looking forward to this Halloween? Collecting copious amounts of your favorite candy? Dressing up in a trendy  costume? Enjoying a horror movie marathon? Find out what other Americans will be up to this year, with our Ultimate Visual Guide to Halloween Statistics! You’ll discover popular costumes for you and fido, a count-down of the best sweet treats, suggestions for a Halloween playlist and more spooktacular stats!

I really like this design.  The color scheme, the design style, and the easy-to-understand top-to-bottom progression of information.  There are a few statistics that I would like to see visualized, like the Trick-or-Treating By The Numbers section where the values are only shown in big fonts.  I really like the different moon phases to visualize the stats at the top.

The Top 5 lists are a little text-heavy, and it would have been nice to see movie posters or CD artwork to go along with the entries.

In the footnote at the bottom, missing are both a copyright statement (or Creative Commons) and a URL link to the original infographic landing page so readers can find the full-size version.

Thanks to Elise for sending in the link!

Monday
Oct312011

The Diabolical Diagram of Movie Monsters

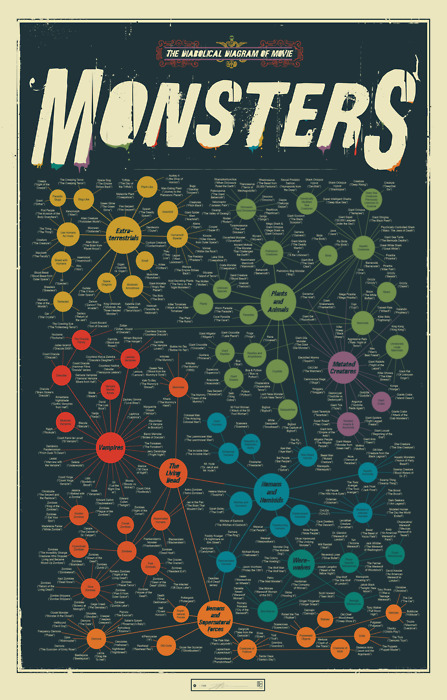
The Diabolical Diagram of Movie Monsters is a cool new poster from Pop Chart Lab.  Available in print for $30, this 24”x36” poster fits nicely in any standard poster frame.

A taxonomic breakdown of all manner of frightful creatures from the silver screen, from the very large (like Godzilla) to the rather small (like Chucky) to the very weird (like the Crawling Eye). Hundreds in all, this is the definitive guide to a universe of scarifying baddies.

Found on We Love Datavis

Friday
Oct282011

An Ode to Horror Cult Classics (1933-2006)

Yep, Halloween is a great time of year, and CheapSally.com brings us a new timeline history of horror movies with OH, The Horror! An Ode to Horror Cult Classics.

We all love to be a little scared sometimes, and Halloween is the perfect day for that. We get to enjoy all of the frightening festivities:  creepy carnivals, haunted houses, trick or treating and of course, horror film marathons. The Halloween Horror Films infographic takes us back to some of our most feared nightmares. Look at 35 of the most popular cult classics, their rotten tomatoes ratings, the original movie budget and their gross domestic box office revenue. See which movies made the cut to become the Top 15 Highest Ranked Horror Films of All Time.

Thanks to Cameron for sending in the link!

Monday
Nov012010

The Infographic Pumpkin, one last Halloween infographic


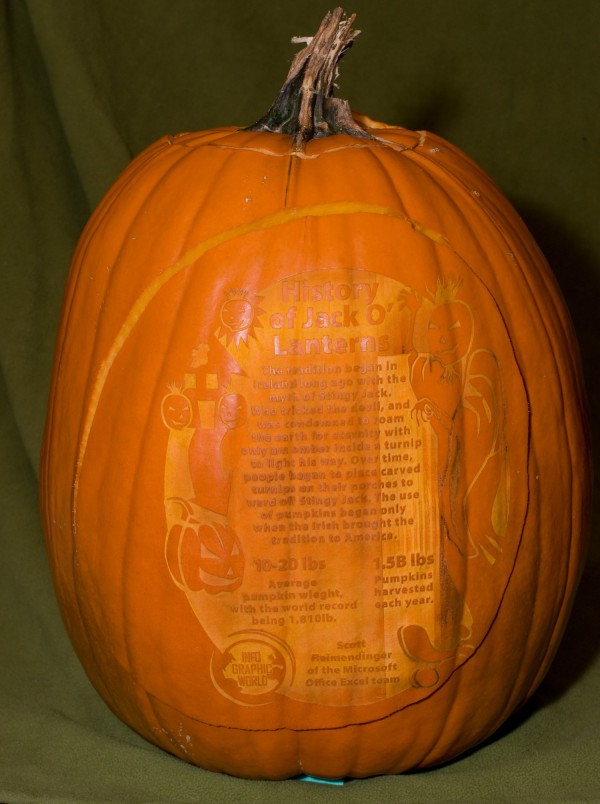
One final Halloween infographic this year is the Infographic Pumpkin from InfographicWorld.com.  

Whats better than a pumpkin carving? A pumpkin carved with Lasers, that’s what. Having carved pumpkins most of my life, and getting heavily into it in 2008 with my Obama pumpkins. I decided to combine my love of information and pumpkin carving to create the first infographic pumpkin. Long story short, doing it with stencils and by hand was a good waste of three 40lb pumpkins, a dozen hours and a few exacto knife war wounds. As luck would have it though, the very day i was about to throw in the towel I stumbled upon a Microsoft employee who carves pumpkins with lasers. Being that lasers are just about the most awesome thing in the world, i couldn’t pass up seeing if something could be arranged.

11 days, a few setbacks and a trip to the Microsoft campus to deliver a pumpkin and the fruit(that’s right, pumpkin is a fruit) of our labor was complete:
(click to enlarge)

What a fun project.  Great job Justin!

Sunday
Oct312010

The Halloween Report [infographic]


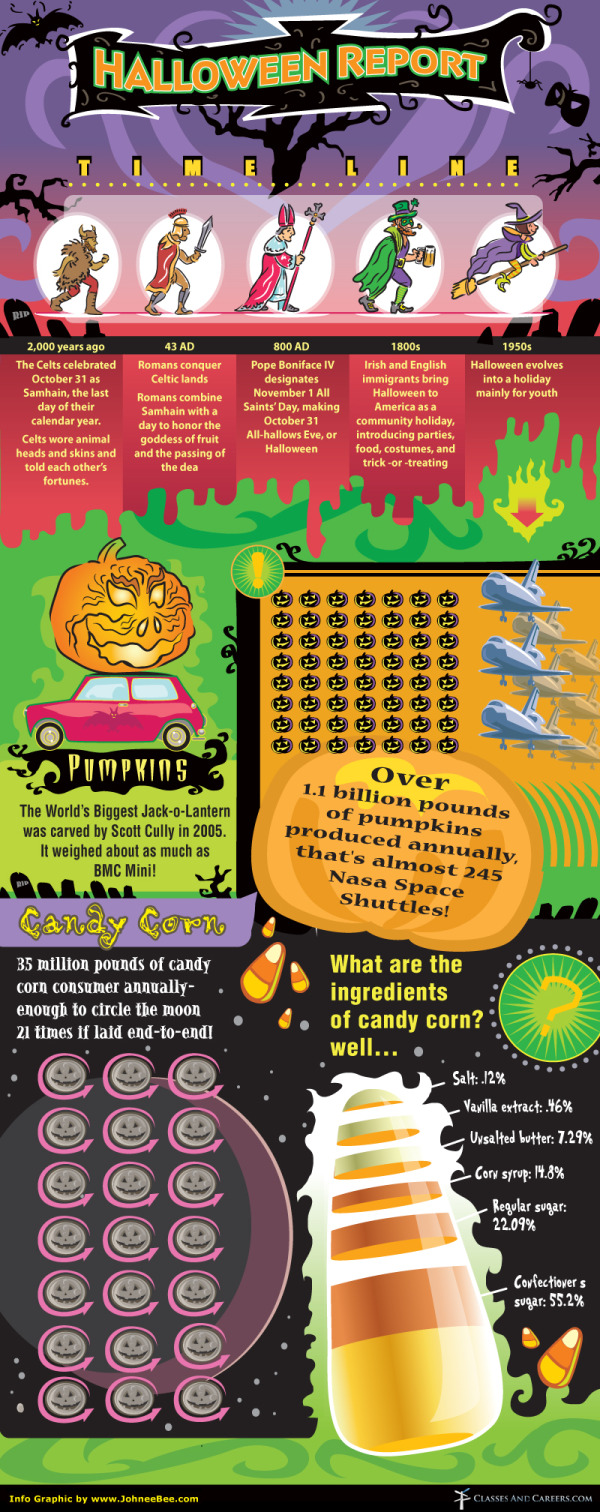
Overall, I like this one but The Halloween Report is a mixed bag.  Heavy on the illustration, The Halloween Report includes elements like the historical timeline, some pumpkin facts and an analysis of candy corn.  

I really like the 21 moons with jack-o-lantern faces, and the pumkpin comparison to the BMW Mini makes a good reference.  I like the idea of the candy corn ingredients, but the slices don’t accurately represent the proportions.

I don’t understand the 7x8 visual grid of pumpkins.  How does that mean 1.1 billion pounds?  The comparison to space shuttles is tough too, because most people don’t have a good feel for how much a space shuttle weighs.  I would have continued the BMW Mini comparison and shown how many Minis it takes to weigh 1.1 billion pounds.

Designed by Johnee Bee for ClassesAndCareers.com.

Thanks to Aubrey for sending in the link!

Saturday
Oct302010

America’s Most Haunted Hotels infographic

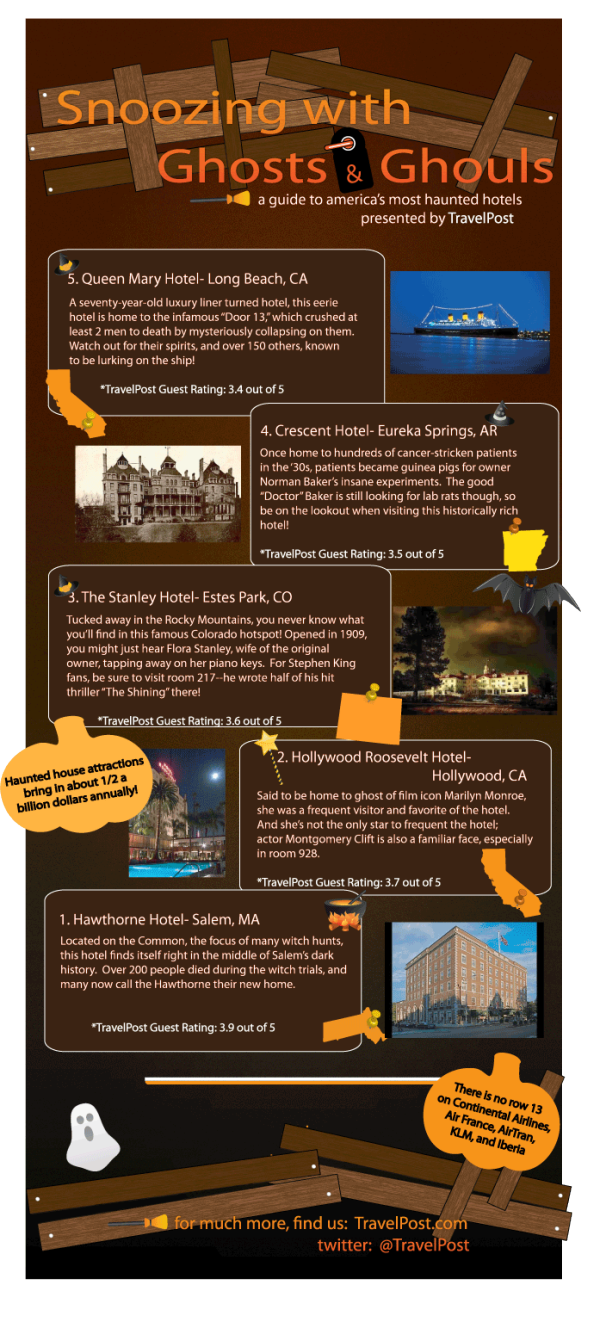
I really like Snoozing With Ghosts & Ghouls: A guide to America’s most haunted hotels from TravelPost.com.  It’s light on visualizing data, but I like both the content and the easy-to-read graphic.  The locations are the only thing actually visualized, but they could also have done visuals for the Guest Ratings.

Thanks to Ambika for sending in the link!

Friday
Oct292010

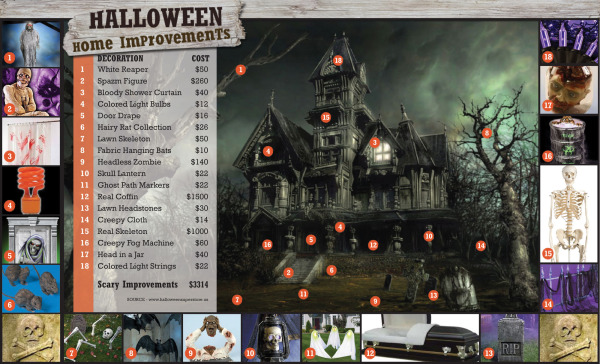
Halloween Home Improvements [infographic]

Click to enlarge

Halloween Home Improvements gives you 18 inexpensive ideas to improve your outside house decorations for Halloween, and make your house the most memorable in your neighborhood.

Looking to scary up your home? Well, here are some ideas for Halloween home improvements that will make your house a boo-tiful abode (see what I did there with boo-tiful? That kind of instinct for wordplay can’t be taught …).

From BuildDirect.com.