About
Randy Krum
President of InfoNewt.
Data Visualization and Infographic Design

Infographic Design

Infographics Design | Presentations
Consulting | Data Visualizations

DFW DataViz Meetup

Join the DFW Data Visualization and Infographics Meetup Group if you're in the Dallas/Fort Worth area!

Search the Cool Infographics site

Custom Search

Subscriptions:


Feedburner

The Cool Infographics® Gallery:

How to add the
Cool Infographics button to your:

Cool Infographics iOS icon

- iPhone
- iPad
- iPod Touch


Read on Flipboard for iPad and iPhone

Featured in the Tech & Science category

Flipboard icon

Twitter Feed
From the Bookstore

Caffeine Poster

The Caffeine Poster infographic

Entries in storage (5)

Monday
Apr112016

What are Data Centers?

What are Data Centers? infographic

The Internet is where we store and receive a huge amount of information. It is also the home of Netflix, one of our largest sources of instant entertainment these days. But how does it work? The Internet is so vast! How does Netflix even get the videos to you? Where is all the information stored? And what does it mean when I store things on "The Cloud?" The answer is data centers.

What are Data Center? infographic from Wilcon can answer all these questions and more about Internet storage and dispersion. 

When you think of a data center, you probably think of a room that looks like it’s out of Star Wars. A darkened room with rows of blinking servers and cool air blowing through the floor. But what does that have to do with your day-to-day life? More than you realize. The role of the data center is surprisingly understated due to how vital it is in nearly every business function. All the movies and TV shows you stream on a daily basis wouldn’t be possible without data centers. So, what exactly are they and how do they work? This infographic from Wilcon examines the layout of data centers and how they function to keep our data secure.


Thanks to Alan for sending in the link!

Monday
May052014

The Explosive Growth of Cloud Computing

The Explosive Growth of Cloud Computing infographic

Cloud computing is definitely a growing trend. Are you in the position to enjoy all of what cloud computing has to offer? The Explosive Growth of Cloud Computing infographic from Eclipse lets you know what you could be missing if you don’t join their network. 

Now is the time to get on the growth curve of cloud services as we are seeing ever-increasing demand for these services – look at how they have developed in the home with subscription services such as Netflix and Love Film. There is a real on-demand economy and as a result, a new, smarter way of working.

So, if it’s time to investigate cloud services for your business it’s also time to look at your connectivity partner, and a partner who provides both connectivity and cloud services will know exactly what you need to ensure a robust internet connection. Look for a partner who is prepared to really understand your business needs and the role of both the cloud and connectivity in those needs; a partner that will tailor-make solutions to your exact business requirements and stay away from the one-size-fits-all mantra; and a partner who provides a high service assurance accompanied by easily accessible monitoring systems so you can be ‘in the know’ regarding your network’s performance.

Great use of doughnut charts, bar charts, logos and icons to tells the story of the growth of cloud computing.

Thanks to David for sending in the link!

Tuesday
Jan142014

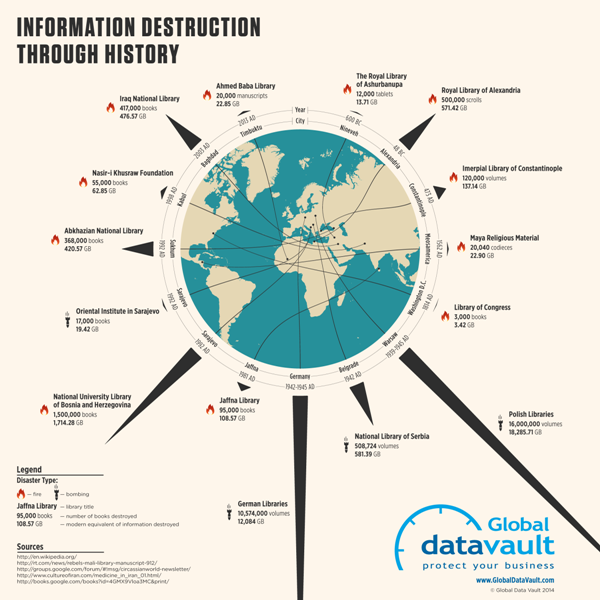
Information Destruction Through History

Information Destruction Through History infographic

Information Destruction Through History from Global Data Vault explores and quantifies the worst data disasters in history.

Information the most valuable commodity in the world. All human progress depends on the accumulation and preservation of information. When information is lost, human progress suffers. This infographic displays some of the most significant loses of information human civilization has suffered.

The circular timeline shows the data disaster events in chronological order, while also connecting to their geographic locations.  The triangles are proportionally sized so readers can visually compare the modern data equivalents between the events.  This really helps put the disasters into perspective for the audience.

A great infographic design that tells one story really well, but there are a few things I would recommend to improve the design:

  • I wouldn’t have any of the triangles run off the page, because the audience will lose perspective on how disastrous those specific events were.  Show the full impact of those events to the readers.
  • Add the URL directly to the infographic landing page so readers can find the original full-size version when people don’t link back correctly
  • I wouldn’t list Wikipedia as a data source if possible. Track the Wikipedia references back to the original data source to include in the list.

Thanks to Joe for sending in the link!

Friday
Oct112013

Zombies vs. Mobile Storage Containers

Zombies VS Door to Door Storage infographic

The Walking Dead return this weekend! Why should you buy a mobile storage unit? Because in the event of a zombie apocalypse, you’d be prepared! With this comical visual, Door to Door uses zombie apocalypse scenarios in it’s 10 Ways to Use a Door to Door Storage Mobile Storage Container in the Event of a Zombie Apocalypse (long title!) infographic to point out the strengths of their storage units.

Bottom Line: If you’re prepping for the zombie apocalypse or, you know, looking to move somewhere new or store your belongings, visit us at www.DoorToDoor.com.

Definitely a fun way to use an infographic to raise your brand awareness!

Thanks to Jayson for sending in the link!

Tuesday
Aug142012

The Lifespan of Storage Media

Crashplan has just released The Lifespan of Storage Media, a comprehensive guide to how long your data will last.  Designed by Mike Wirth with InfoNewt, this infographic compares the expected lifespans of popular media types used over the last 100 years to save different kinds of information: computer data, photos, videos and audio.  Do your 8-tracks still play?

As each new form of data storage comes on the scene, the market is at first enamored with its compactness, convenience and hoped-for data longevity. But invariably, the reality of physical vulnerability and a limited lifespan remains. Eventually, all media fails, but Cloud backup is forever.

This was a fantastic project to work on, and the data research was the most challenging piece.  We had to find data to support both an average expected life and an extended “with extreme care” life.  We certainly found some contradictory data sources, and ultimately used data we felt was the most commonly accepted in the industry.

Do you have old computer backups burned to CDs, tapes or even hard drives on your shelf?  Don’t count on being able to read the data from them too much longer!  The short lifespan for many of these types of media that people use everyday to archive their personal photos and videos was most surprising.

Thanks to the team at Crashplan for a great project!