About
Randy Krum
President of InfoNewt.
Data Visualization and Infographic Design

Infographic Design

Infographics Design | Presentations
Consulting | Data Visualizations

DFW DataViz Meetup

Join the DFW Data Visualization and Infographics Meetup Group if you're in the Dallas/Fort Worth area!

Search the Cool Infographics site

Custom Search

Subscriptions:


Feedburner

The Cool Infographics® Gallery:

How to add the
Cool Infographics button to your:

Cool Infographics iOS icon

- iPhone
- iPad
- iPod Touch


Read on Flipboard for iPad and iPhone

Featured in the Tech & Science category

Flipboard icon

Twitter Feed
From the Bookstore

Caffeine Poster

The Caffeine Poster infographic

Entries in Cloud (4)

Monday
May052014

The Explosive Growth of Cloud Computing

The Explosive Growth of Cloud Computing infographic

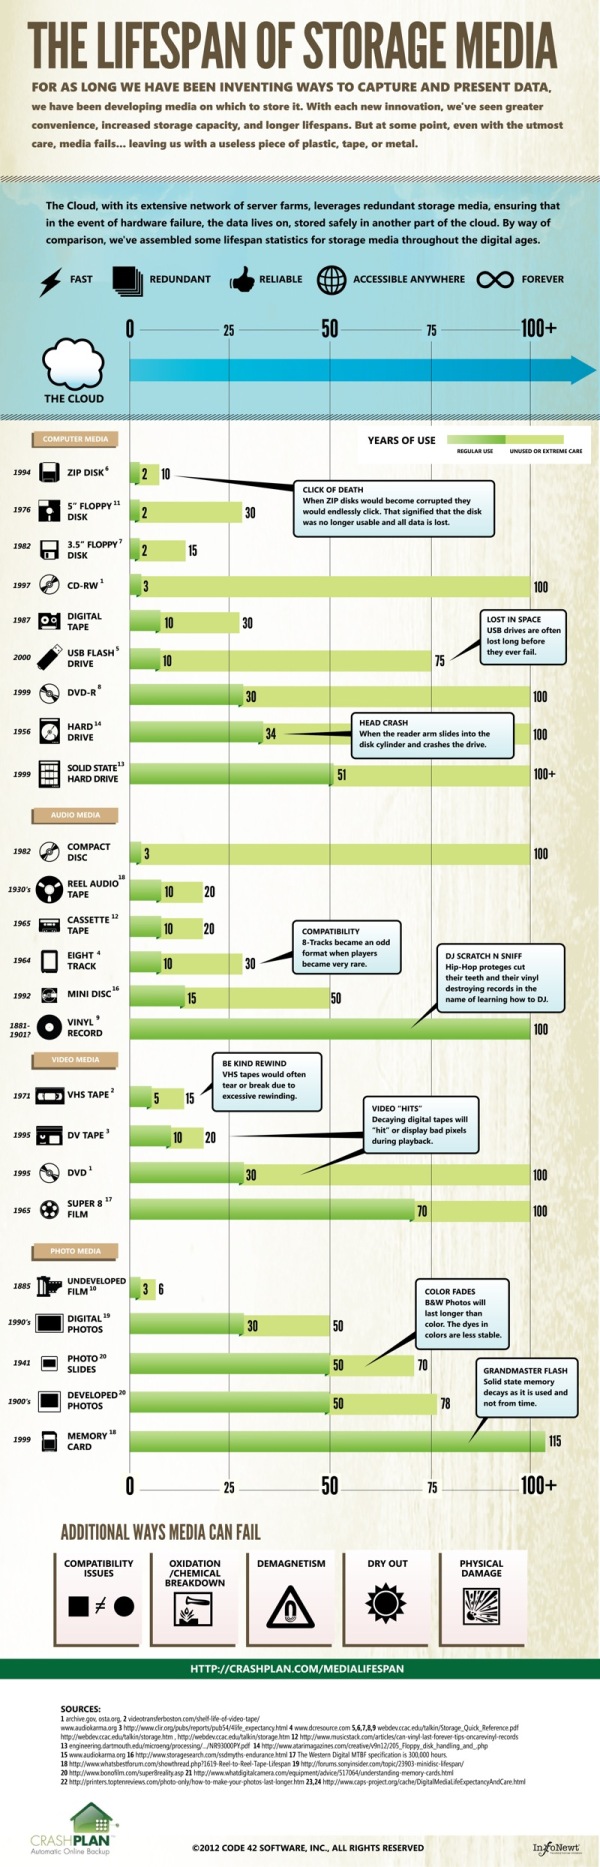
Cloud computing is definitely a growing trend. Are you in the position to enjoy all of what cloud computing has to offer? The Explosive Growth of Cloud Computing infographic from Eclipse lets you know what you could be missing if you don’t join their network. 

Now is the time to get on the growth curve of cloud services as we are seeing ever-increasing demand for these services – look at how they have developed in the home with subscription services such as Netflix and Love Film. There is a real on-demand economy and as a result, a new, smarter way of working.

So, if it’s time to investigate cloud services for your business it’s also time to look at your connectivity partner, and a partner who provides both connectivity and cloud services will know exactly what you need to ensure a robust internet connection. Look for a partner who is prepared to really understand your business needs and the role of both the cloud and connectivity in those needs; a partner that will tailor-make solutions to your exact business requirements and stay away from the one-size-fits-all mantra; and a partner who provides a high service assurance accompanied by easily accessible monitoring systems so you can be ‘in the know’ regarding your network’s performance.

Great use of doughnut charts, bar charts, logos and icons to tells the story of the growth of cloud computing.

Thanks to David for sending in the link!

Friday
Feb222013

Cloud Computing: Fact or Fiction?

Cloud Computing: Fact or Fiction? infographic

Cloud Computing: Fact or Fiction? is a new infographic from Devry University helping to explain the basics about cloud computing, and the clear up the common misunderstandings people have about the Cloud.

Cloud computing allows you to store, access and share data from Internet-connected devices in one central location.  As technology careers continue to grow across the U.S. and cloud computing creates nearly 14 million jobs by 2015, the Cloud is more important than ever.  Here are the fact you need to know about the Cloud - and the fiction than many believe.

This is a really clean and easy-to-read design, with a great color scheme.  The statistics to support each section are good, and clearly sourced in the long list of data sources in the footer.

The data visualizations are a mixed bag.  The doughnuts are easy to read and the percentage bars are clearly visualized as portions of 100%.  The 24% doughnut in the top visualization is wrong.  That will catch many people’s eye, and cast doubt on the rest of the visualizations.  Once you get one data visualization wrong, you lose credibility and people will more closely scrutinize the rest.

Why are other numbers not visualized?  The “cyber attacks” and “people using the cloud” statistics would have been easy to visualize, but now seem unimportant to the reader because they are just shown in text.


The most interesting thing is that I got this promotional, marketing email (image above) from YouSendIt.com highlighting this infographic and showing the top portion with the incorrect visualization.  As far as I know, Devry and YouSendIt are not related in any way, so this is just using someone else’s work for their own purposes.  

Of course, infographics are meant to be shared, but you shouldn’t claim credit for someone else’s work, especially in an email promoting your own commercial services.  By omitting any design credit to Devry in the email, the message implies that the infographic is coming from YouSendIt, so it looks like the YouSendIt designers messed up the data visualization.  The negative impression created by the false visualization will now also create a negative impression of the folks at YouSendIt.  Oops.

Tuesday
Aug142012

The Lifespan of Storage Media

Crashplan has just released The Lifespan of Storage Media, a comprehensive guide to how long your data will last.  Designed by Mike Wirth with InfoNewt, this infographic compares the expected lifespans of popular media types used over the last 100 years to save different kinds of information: computer data, photos, videos and audio.  Do your 8-tracks still play?

As each new form of data storage comes on the scene, the market is at first enamored with its compactness, convenience and hoped-for data longevity. But invariably, the reality of physical vulnerability and a limited lifespan remains. Eventually, all media fails, but Cloud backup is forever.

This was a fantastic project to work on, and the data research was the most challenging piece.  We had to find data to support both an average expected life and an extended “with extreme care” life.  We certainly found some contradictory data sources, and ultimately used data we felt was the most commonly accepted in the industry.

Do you have old computer backups burned to CDs, tapes or even hard drives on your shelf?  Don’t count on being able to read the data from them too much longer!  The short lifespan for many of these types of media that people use everyday to archive their personal photos and videos was most surprising.

Thanks to the team at Crashplan for a great project!

Wednesday
Feb152012

Website Hosting Decisions

The Hosting Decisions, From the Chalkboard infographic from Rackspace UK Hosting helps customers to choose how to host their site with this visually decision map.

OK so you already know that we’ve been helping customers define their hosting needs for some years now.

But as customers adopt more service based computing resources like cloud hosting, it’s only logical that they will also now ask more of their hosting provider to ensure they are getting the correct solution.

So we thought hey, let’s produce an infographic to take customers through a simple decision making process on a route to the solution that’s right for them.

This one is a clear, focused topic.  Easy to read, and not a lot of illustrations or images to get in the way.  This decision for companies is actually a little more complicated, but the infographic does pose the right questions.

Thanks to Sav for sending in the link!