About
Randy Krum
President of InfoNewt.
Data Visualization and Infographic Design

Infographic Design

Infographics Design | Presentations
Consulting | Data Visualizations

DFW DataViz Meetup

Join the DFW Data Visualization and Infographics Meetup Group if you're in the Dallas/Fort Worth area!

Search the Cool Infographics site

Custom Search

Subscriptions:


Feedburner

The Cool Infographics® Gallery:

How to add the
Cool Infographics button to your:

Cool Infographics iOS icon

- iPhone
- iPad
- iPod Touch


Read on Flipboard for iPad and iPhone

Featured in the Tech & Science category

Flipboard icon

Twitter Feed
From the Bookstore

Caffeine Poster

The Caffeine Poster infographic

Entries in sports (38)

Monday
Apr022018

The Most Successful US State for Sporting Wins

The Most Successful US State For Sporting Wins infographic

The Most Successful US State for Sporting Wins infographic shows which state's professional teams have the most wins within the "Big Four" sport leagues. The "Big Four" consists of Major League Baseball, the National Basketball Association, the National Hockey League, and the National Football League. To find these statistics, PlayUSA researched the winners from the sports leagues since each competition began, then divided the winning teams by their state of origin.

Go Big Four or Go Home

Studying the wins of each state within the big four leagues across the decades, the research ranks all states who have had at least one win within these leagues and ranks them from most to least successful. To accompany this, PlayUSA have tapped into the loyalty of sports fans across the USA, delving into their views regarding politics on the pitch, and which sports Americans typically support outside of the Big Leagues.

Whilst the big leagues dominate U.S. sporting news and viewership, are they the be all and end all? The survey revealed that this might not be the case.

22% of men surveyed said they also follow Major League Soccer, although only 10% of women do the same. Another contender for fandom is college level sport, as 41% prefer watching this compared to the Big Four. In the Southeast, this stat is even higher, at 52%, compared to 33% of Northeastern respondents. However, when analysing the results by league, 72% of NFL fans from the Southeast favoured the Big League over the college level equivalent.


Thanks to Jessica for sending in the link!

Wednesday
Aug172016

The Fastest Men in the Olympics Since 1896

The Fastest Men in the Olympics Since 1896

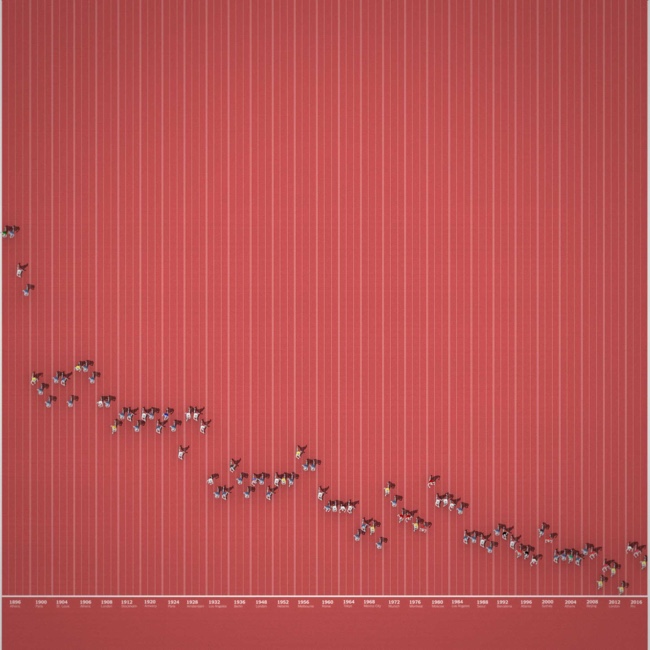
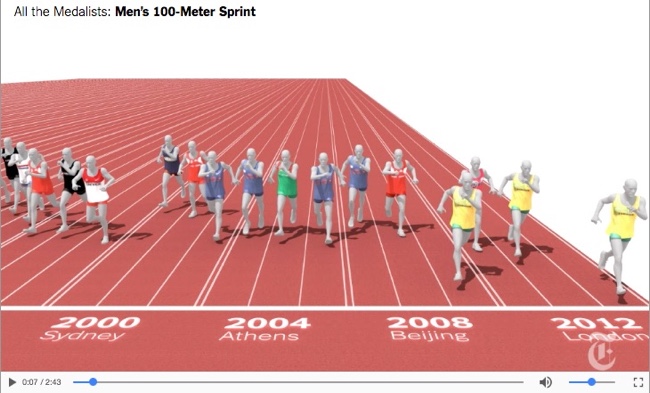
To put Usain Bolt's 3rd consecutive Olympic Gold Medal for the 100m dash into perspective, the NY Times designed this great graphic showing Usain Bolt and the Fastest Men in the World Since 1896 – on the Same Track.

Usain Bolt’s historic third consecutive gold medal in the men’s 100-meter dash cemented his status as history’s greatest sprinter and the world’s fastest man. He edged out Justin Gatlin, an American, and Andre De Grasse, a Canadian, on his way to the gold.

But how does Bolt compare to the full Olympic field in the 100-meter dash – not just this year, but against every Olympic medalist since 1896? To answer that question, we created a massive (and imaginary) track with 88 lanes – one for every medal awarded in the 100-meter dash in the modern Olympics.

We then pitted these runners against each other in an imaginary race, using their average speeds. We froze all the runners at the moment the winner crossed the finish line.

This is an update to the same graphic they created in 2012 when he broke his own World Record. The 2012 piece also included this great infographic video explaining the significance of his win:

Found on FlowingData

Thursday
Apr282016

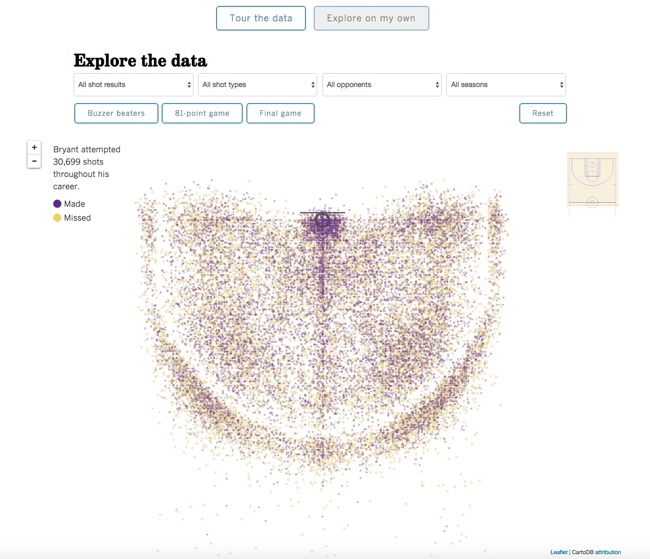
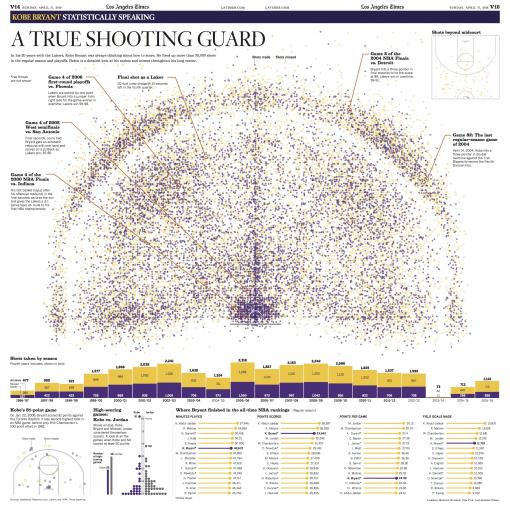
All 30,699 career shots by Kobe Bryant


The LA Times created a fantastic interactive data visualization of every shot taken by Kobe Bryant during his career. All 30,699 of them!

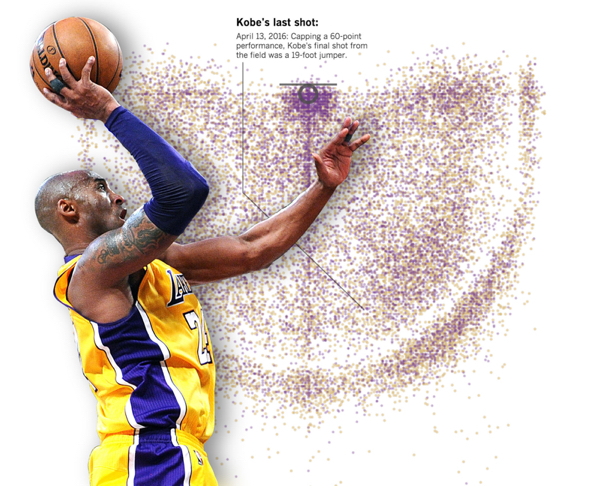
Kobe Bryant's 30,699th and final field goal came from 19 feet with 31 seconds left against the Utah Jazz. During his 20 years with the Lakers, he fired up more than 30,000 shots, including the regular season and playoffs.

Take a tour of key shots over his 20-year career, or explore the makes and misses over his long career on your own.

The data is sourced from stats.nba.com, and the visualization was build with leaflet and cartodb. The reader can hover over any specific dot to see the details of each shot. It's not obvious, but you can adjust the court image on the right to view the shots from the other end of the court. Color-coded for made and missed shots, you can also Tour the Data to see the most significant shots from his career, like his final shot:

Similar visualization style to the BallR visualization I posted about a few weeks ago.

For the serious fan, it's also available for purchase as a poster version for $59.95, which include more stats and visualizations from his career.

Found on FlowingData!

Monday
Mar282016

BallR: Interactive NBA Shot Charts

BallR: Interactive NBA Shot Charts

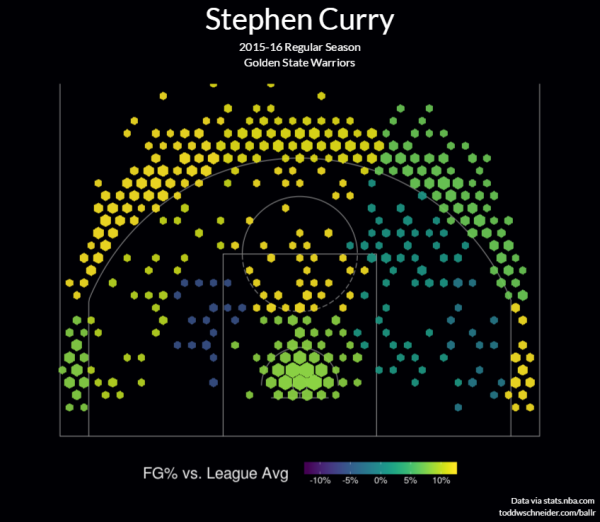
BallR: Interactive NBA Shot Charts is a tool built by Todd W. Schneider that takes the NBA's Stats API data and creates a visual representation of an NBA player's season. You can pick any NBA player and season to create the shot chart. The above infographic is an example of a hexagonal chart of Stephen Curry's Field Goal Percentage (FG%) relative to the league average within each region of the court during the 2015–16 season.

The NBA’s Stats API provides data for every single shot attempted during an NBA game since 1996, including location coordinates on the court. I built a tool called BallR, using R’s Shiny framework, to explore NBA shot data at the player-level.

BallR lets you select a player and season, then creates a customizable chart that shows shot patterns across the court. Additionally, it calculates aggregate statistics like field goal percentage and points per shot attempt, and compares the selected player to league averages at different areas of the court.

Hexagonal charts, popularized by Kirk Goldsberry at Grantland, group shots into hexagonal regions, then calculate aggregate statistics within each hexagon. Hexagon sizes and opacities are proportional to the number of shots taken within each hexagon, while the color scale represents a metric of your choice, which can be one of:

  • FG%
  • FG% vs. league average
  • Points per shot

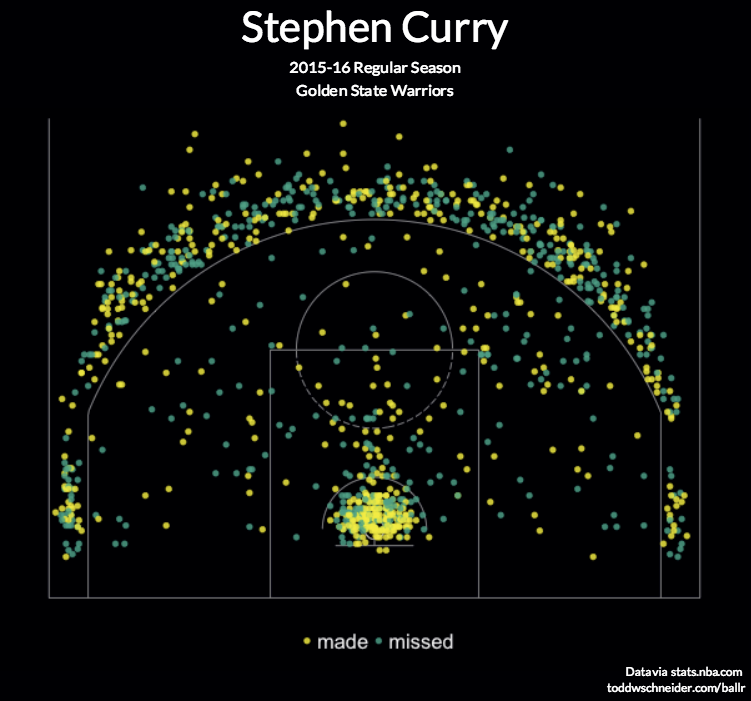
Scatter charts are the most straightforward option: they plot each shot as a single point, color-coding for whether the shot was made or missed. Here’s an example again for Stephen Curry


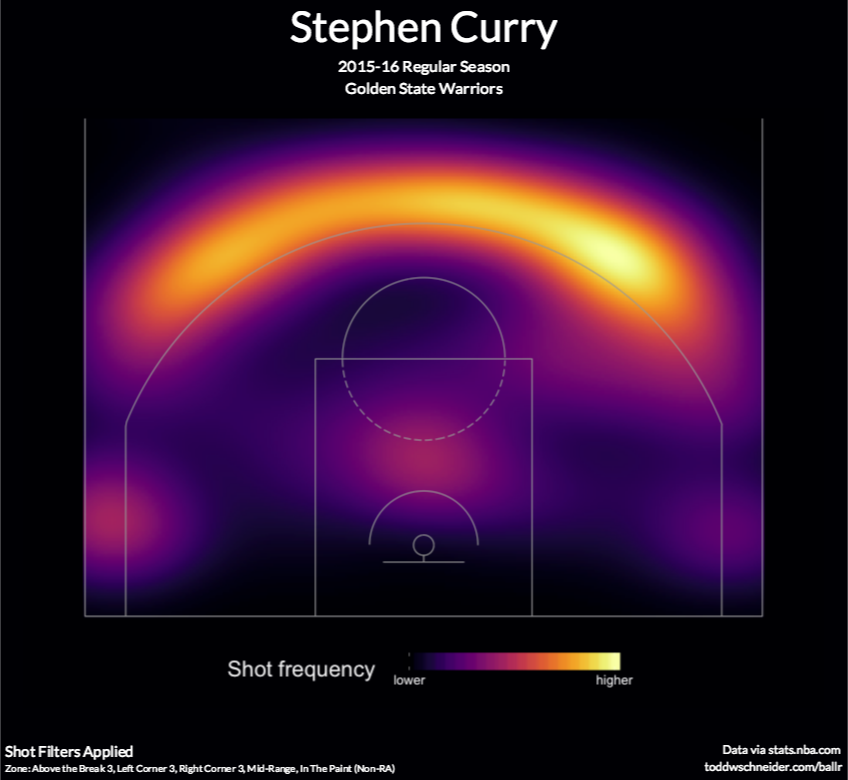
Heat maps use two-dimensional kernel density estimation to show the distribution of a player’s shot attempts across the court.

Anecdotally I’ve found that heat maps often show that most shot attempts are taken in the restricted area near the basket, even for players you might think of as outside shooters. BallR lets you apply filter to focus on specific areas of the court, and it’s sometimes more interesting to filter out restricted area shots when generating heat maps. For example here’s the heat map of Stephen Curry’s shot attempts excluding shots from within the restricted area (see here for Curry’s unfiltered heat map).

Built using R's Shiny framework, I really like this interactive dataviz. The code designed to create this was also published on GitHub so anyone can check it out and try your own modifications. Very cool!

Found on Flowing Data.

Monday
Feb162015

Easy Longboard Buyer's Guide

Easy Longboard Buyers Guide infographic

If you are new to the longboard scene, or just need a little help learning exactly what you need, the Easy Longboard Buyers Guide infographic from Longboard Reviews could be a life saver. This cheat sheet tells you the differences between the board styles, wheel sizes, wheel hardness, and deck length.

Thinking of buying a longboard? Use this easy-to-follow guide to discover exactly which is the best type of longboard for the riding style you enjoy.

Need to know what trucks, deck or wheels to buy? This guide will help you with that too.

If you are new to longboarding then all the different types of decks, trucks, wheels and bearings can be quite daunting. It seems like there is a minefield of choices out there. Do I want hard wheels or soft wheels? A concave deck or a drop-through deck?

Accidentally buy a slalom board for cruising and you’ll be in trouble!

In my guide (on the left hand side) I have made it really easy for you. Simply decide which type of riding style you want to do and I’ll show you exactly what type of board to buy.

Once you have done that, head over to my reviews page and discover which is the best longboard on sale at the moment for your needs.

This is a really good side-by-side comparison style design. The mix of actual photo images with the illustrations to visualize the data works very well, and adds a lot of credibility to the design.

The URL in the footer, should be the link to the infographic landing page so readers can find the original full-size version. The infographic is nowhere to be found on the front page, which would make readers frustrated by trying to search the site.

Thanks to Jon for sending in the link!

Monday
Oct272014

Winnipeg Jets Beat Arizona Coyotes Infographic

Winnipeg Jets Beat Arizona Coyotes Infographic

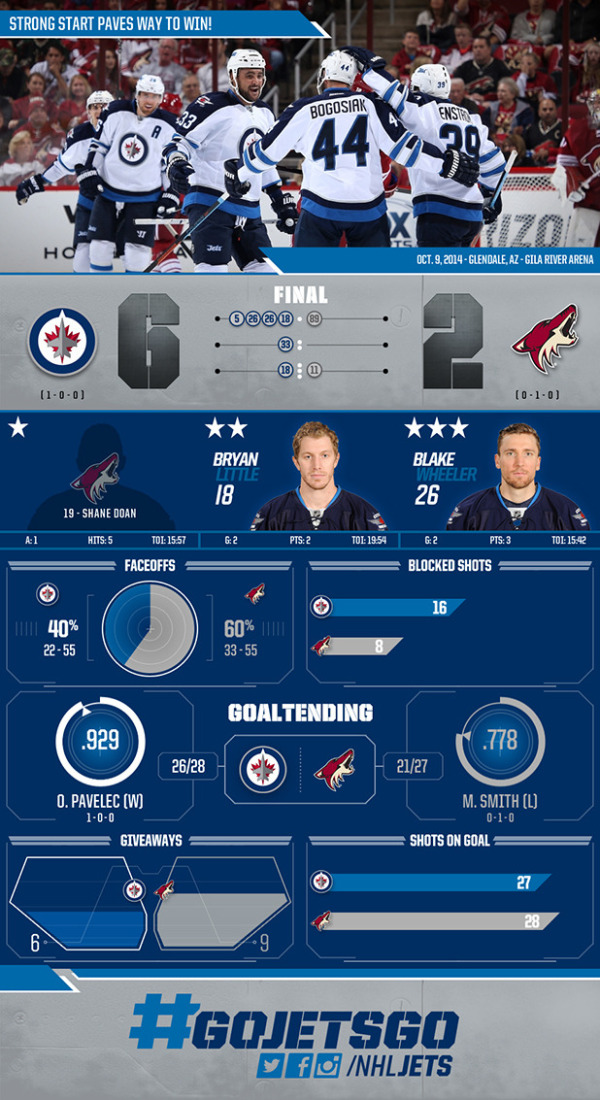
Jets Down Arizona 6-2 infographic from the Winnipeg Jets (Jets.NHL) gives an infographic summary of the October 9, 2014 NHL game between the Jets and the Coyotes. Sports statistics are ripe for data visualization and infographics, but are so rarely used.

The design does a great job of using a few simple visualizations to communicate data about the game. They don’t just show the score, but visualize when the goals were made by using the numbers of the scoring players shown in each period. Other visualizations cover statistics like Face-off results and Goal Tending percentages.

I don’t understand the visualization for the Giveaways. I get that the filled area is supposed to represent the number, but the’re shown in a shape I don’t recognize. Is that a car door? There’s no way the designer accurately calculated the area shown of that odd shape to get the visualization right.

Thanks to Reid Parker for posting the link!

Wednesday
Jul302014

World Records from the Commonwealth Games


World Records from the Commonwealth Games infographic

IVC Signs has compiled some statistics about the commonwealth games into the World Records from the Commonwealth Games infographic. Find out record holders names, time, and place where each record was made!

Following on from being appointed the official signage supplier for the 2014 Games, IVC Signs have followed this up with this fantastic info graphic, packed full of world records and global statistics from the Commonwealth Games over the decades.

The infographic has great, fun illustrations to portray the sports that are being discussed. I would of liked to see a better interpretation of time, distances and locations rather than the same graphic icon over and over again with the value underneath it. The infographic is missing the URL link at the bottom, as well as a list of sources.

Thanks to David for sending in the link!

Wednesday
Jun182014

World Cup Final Stadiums: A Visual History

World Cup Final Stadiums: A Visual History infographic

The World Cup is in full swing with group play starting last week. We cannot tell you who will be the winner of this World Cup; however, the World Cup Final Stadiums: A Visual History infographic from Grass Form can tell you the countries, stadiums, and winners of the past.

La Coupe de Monde. La Copa del Mundo. The World Cup. No matter what language you say it in the biggest competition in football always means the same thing; a summer festival for millions watching the beautiful game.

Every edition of the World Cup is special in it’s own right but this year stands out from the rest; football is heading back to its spiritual home, Brazil.

The Seleção are aiming for a historic sixth triumph in front of an expectant home crowd – the pressure is on for Neymar & co. to deliver the goods in classic Jogo Bonito style.

Of course part of the World Cup legend are the iconic stadia; from the timeless twin towers of Wembley to the newly-revamped Maracanã which will take pride of place at this year’s tournament, these coliseums have provided the platforms for the most iconic moments in the history of the game.

A good visual representation of each stadium. Adding the flag of the host’s country on top of each of the stadiums is great touch. However, underneath the stadiums, we could use some better visuals.  The design could have visualized the relative sizes of the stadium capacities and used the flag of the winning teams.  The year each stadium was built isn’t really relevant information.

I love the topic choice by Grass Form, a turf company.  More information could have been included in the infographic about the type of grass used in each stadium to make the topic even more relevant to the publishing company.

Thanks to Dave for sending in the link!

Thursday
Mar272014

Visualizing NBA Passing Frequency Data

Visualizing NBA Passing Frequency Data infographic

NBA Passing by Andrew Bergmann was designed for NBA.com.  By analyzing data gathered by SportVU technology cameras installed in NBA arenas, the line thickness represents the average number of passes per game between specific players.

Here’s a look at how starters on all 30 NBA teams share the basketball.

The thickness of the gray lines on the accompanying chart represents the average number of passes per game between two players.

A very clear picture emerges on which teams distribute the ball more evenly between players, such as the Nets, Bulls and Cavaliers. On the flip side, Chris Paul and Blake Griffin dominate passing for the Clippers, and likewise for Kevin Love and Ricky Rubio of the Timberwolves.

This is a great way to visualize this data set.  The visualization method is unique, memorable, and really makes the connections between players easy to understand.

The infographic vaguely lists the data sources at “Stats”, and the original post explains that the data is gathered from the newly installed SportsVU camera systems.  However, the actual data is still unavailable for readers to investigate on their own.  This design would have been a great opportunity for the data set spreadsheet to be shared with the audience through a public spreadsheet in Google Docs.

Knowing the infographic is going to be shared online, the image file should include the URL back to the original post on NBA.com.  Don’t make it hard for readers to fit find the original, full-size version of your infographic.

Found on Flowing Data and Fast Company

Tuesday
Mar182014

The Power of ACC Basketball

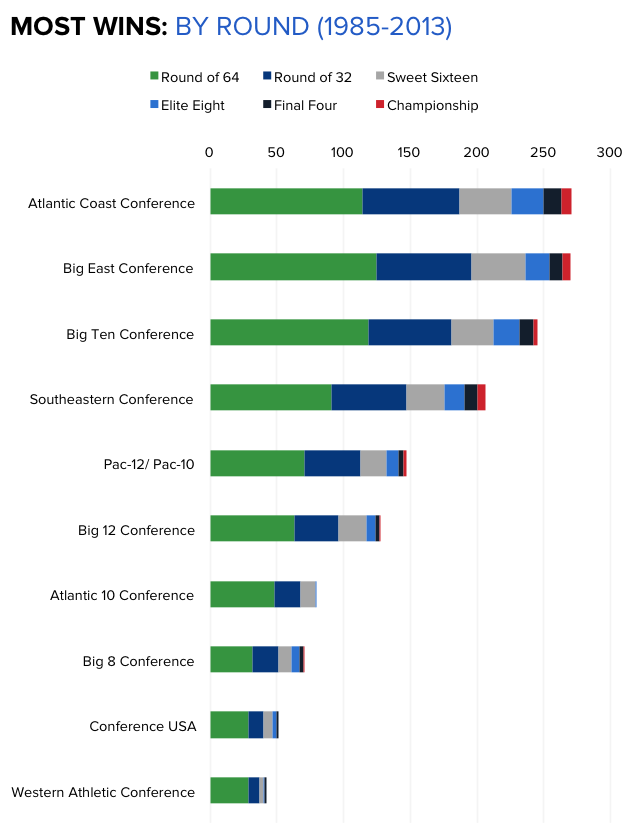
The Basketball Staff at CBS Sports has put together a handful of really good data visualizations showing the 29-year history of the NCAA Tournament since the field expanded to 64 teams.  The chart above shows Most Wins won in the Tournament by conference, color-coded by round.  These aren’t complicated designs, but the story they tell is very powerful.

Go N.C. State Wolfpack!  Fantastic win over Xavier tonight!  The Big East looks pretty strong too, but there’s nothing like ACC Basketball.  These data visualizations tell that story much better than text and numbers.  In Texas (Big 12), they just don’t seem to understand the importance of basketball.  Football is what you play in the off-season!  They have it reversed here in Texas, where football is much more important.

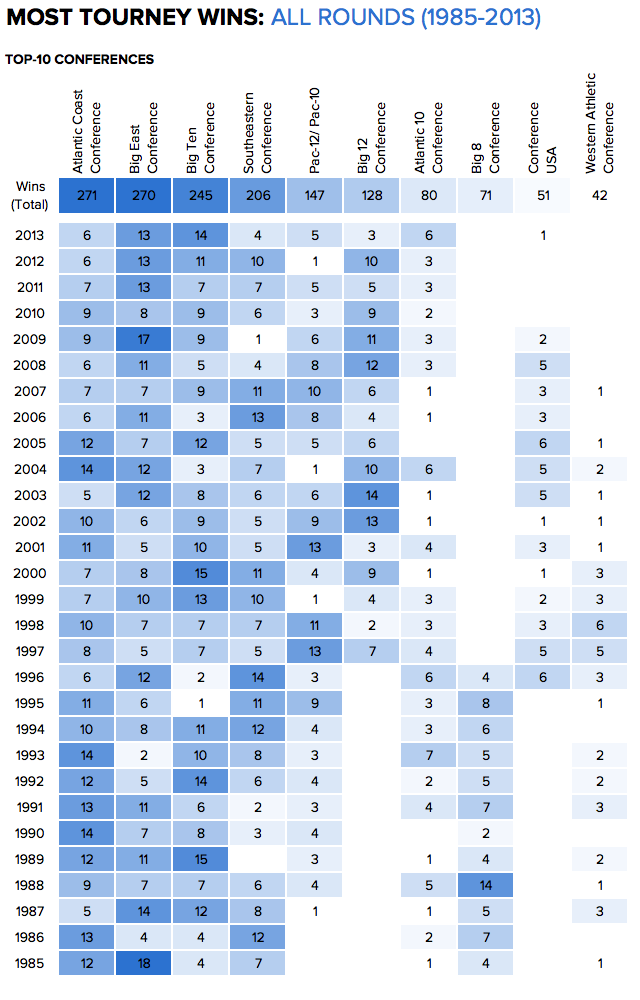
Here is that same data shown as a color-coded table that spells out the Most Tournament Wins by Year by year.  This looks like it could have been designed with Conditional Formatting in Microsoft Excel, but it’s done very well.  The simple color-coding adds context and makes the entire table easier to understand.

As an infographics design, the PNG image file itself should include a little more information, in case it gets shared online without the rest of the article (like this blog post).  It should list CBS Sports as the publisher/designer and the URL back to the original article.  I also would have used the conference logos along the y-axis instead of text.

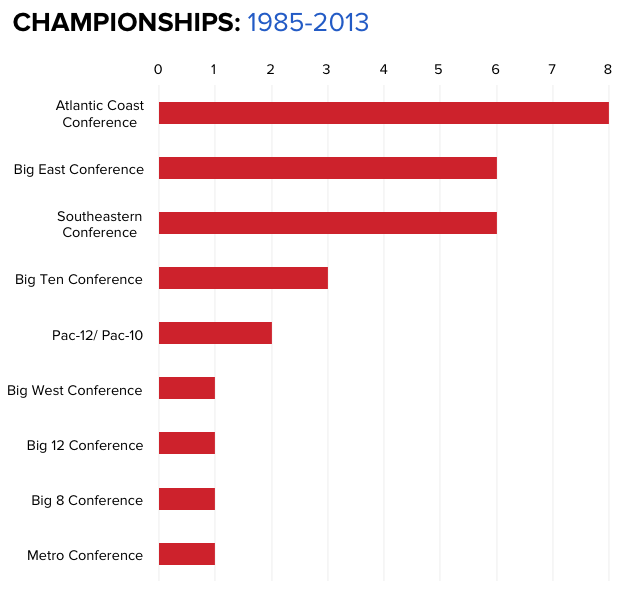
Here’s their chart of overall NCAA Championship Wins over that same 29 year period.