About
Randy Krum
President of InfoNewt.
Data Visualization and Infographic Design

Infographic Design

Infographics Design | Presentations
Consulting | Data Visualizations

DFW DataViz Meetup

Join the DFW Data Visualization and Infographics Meetup Group if you're in the Dallas/Fort Worth area!

Search the Cool Infographics site

Custom Search

Subscriptions:


Feedburner

The Cool Infographics® Gallery:

How to add the
Cool Infographics button to your:

Cool Infographics iOS icon

- iPhone
- iPad
- iPod Touch


Read on Flipboard for iPad and iPhone

Featured in the Tech & Science category

Flipboard icon

Twitter Feed
From the Bookstore

Caffeine Poster

The Caffeine Poster infographic

Entries in experience (21)

Friday
Sep162016

Mapping the Disciplines of User Experience Design

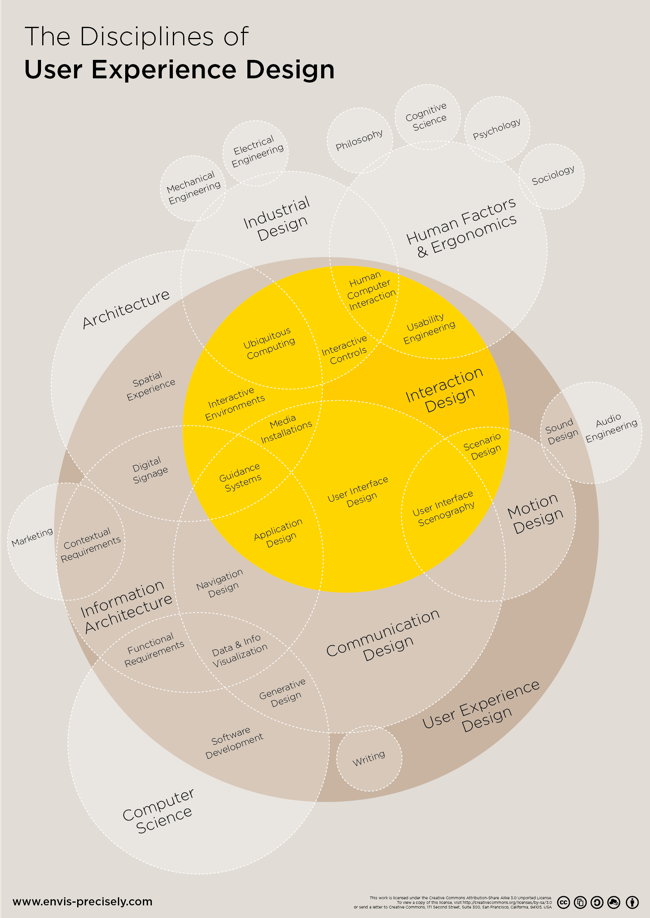
Mapping the Disciplines of User Experience Design infographic

Mapping the Disciplines of User Experience Design is an uber-complex Venn Diagram. The original concept by Dan Saffer at KickerStudio was given a clean DataViz overhaul by Thomas Gläser who was with envis precisely at the time.

An infographic approach to visualize all players of the interactive field

. It shows the different areas and how they connect and overlap.

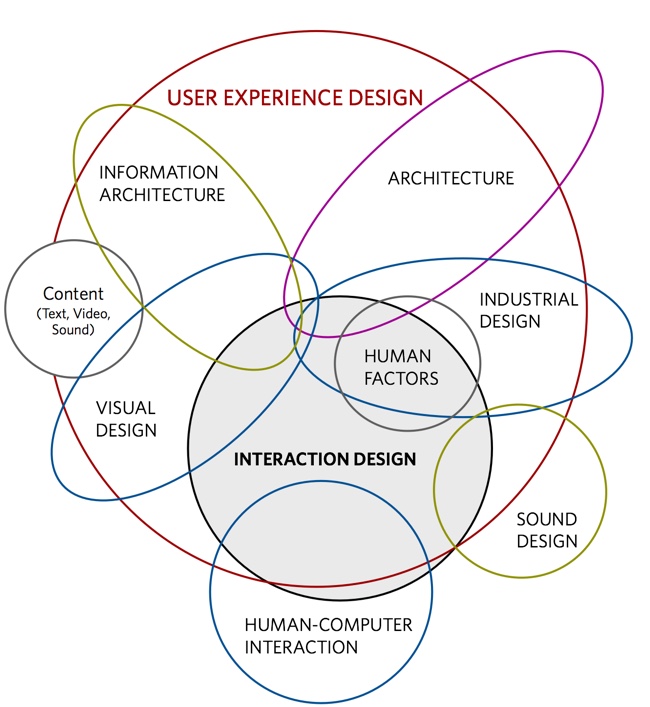
The diagram is based on the work of Dan Saffer

It's a couple years old, but all of the files were published on Github under Creative Commons 3.0 Attribution-ShareAlike so anyone can Adpapt or Improve the design going froward.

You can see the original concept from Dan Shaffer here:

Found on FastCoDesign

Tuesday
Oct272009

Eye Tracking Infographic Plots


Eye tracking is used is a number of different fields of study; consumer interaction design, advertisements, product packaging, website/software usability, store shelf merchandising design and many more.  The results are plotted visually as an infographic, because it instantly makes the data understandable to the researchers.

In the fixation map image above, a participant's focal points on a website are tracked and the points are numbered in sequential order (like connect-the-dots).  The dots are also each sized based on "Gaze Duration", the amount of time the participant spent looking at that particular point.  In the example above, it took the participant 90 fixations to find the information they were looking for...not a good site design.


Of course, you can narrow down the fixation points and only see the first few points that attracted the participant's attention.  Answering the question "What does the user see first?"  In this example, the participant looking at the flight website saw the hotel ad first.


It's not just for websites.  When you use this method for product packaging, you can tell what the consumer sees in the store during the first few seconds, and the popular understanding is that you only have 3 seconds of the consumer's attention in the store.  The use of the infographic fixation map instantly conveys to the packaging designers what the consumer sees, and what parts of the design are ignored.


The fixation maps are converted into heat maps to aggregate many participant results together.  You can see here that participants aren't seeing the "Diesel for Successful Living" message.

Thanks to Colin from IDG Consulting for providing the images!  I have used IDG for consumer research projects in the past, and I highly recommend them.

Monday
Oct262009

Procrastination: The Infographic Video

Although I really like this video by Johnny Kelly at Design You Trust (Good-Okay-Brilliant-Great job Johnny!), I not convinced this is infographics.

What do you think?  Is this infographics or illustration?

Found on The MLxperience

Wednesday
Oct142009

10/GUI - Re-imagining a Desktop Touch Interface


10/GUI from C. Miller on Vimeo.

A little off-topic, but I love this video idea for a new touch interface to replace the mouse from 10/GUI. Designed by R. Clayton Miller.

This video examines the benefits and limitations inherent in current mouse-based and window-oriented interfaces, the problems facing other potential solutions, and visualizes my proposal for a completely new way of interacting with desktop computers. 
Thanks for the link Tyler!  Found on Ignore The Code.

Thursday
Sep032009

reMap: An Amazing Visual Browsing Interface to VisualCompexity.com


Bestario has created reMap, an interactive portal to view all of the infographics posted on VisualComplexity.com, and it's amazing.  They've created semantic connection between the different infographics using tags tat allow for an incredible browsing experience.

An interactive, visual browsing interface to an infographic archive.

reMap displays visualcomplexity.com projects allowing navigation using a semantic approach and depicting relations among them. All images and texts belong to vc portal. Tags are assigned using a semantic engine created by Bestiario.
Thanks Jose!  I love it!

Wednesday
Aug122009

Improved Microsoft Windows 7 Upgrade Chart

The chart above is NOT from Microsoft.  Ed Bott, over at ZDNet, was able to quickly redesign the Windows 7 Upgrade Chart from Microsoft in about an hour.  And Ed's a journalist.

The original chart (below) is unnecessarily complicated and hard to comprehend.  I generally don't post about bad infographics, but in this case Ed was able to re-do Microsoft's chart into the improved, simpler version you see above. 

Honestly, the upgrade process is still too complicated and Microsoft should be ashamed of themselves.  This deserves a new Mac vs. PC ad just by itself.

Found on Engadget and All Things D.

Here's the official "horrendous" (I don't get to use that word often) chart from Microsoft.

Monday
Apr272009

The AlloSphere: Step inside your visual data!

Awesome sphere that you step into and become completely immersed in visual data!  I can't wait for one of these to be available for the public to experience.  Great TEDTalks video.

JoAnn Kuchera-Morin demos the AlloSphere, a new way to see, hear and interpret scientific data. Dive into the brain, feel electron spin, hear the music of the elements ... and detect previously unseen patterns that could lead to new discoveries.

Tuesday
Apr072009

Can design save the newspaper? (Jacek Utko)

Short TED Talk by Jacek Utko that explores how design can not only improve newspapers, but also your product or brand.

Jacek Utko is an extraordinary Polish newspaper designer whose redesigns for papers in Eastern Europe not only win awards, but increase circulation by up to 100%. Can good design save the newspaper? It just might.

Tuesday
Mar242009

The Trilogy Meter


Dan Meth did a great job creating his own personal Trilogy Meter showing his personal enjoyment of movies released as a trilogy.  This shows that Dan never likes the 3rd movie as much, so he should just stop spending the money.

Although this is based on Dan's personal ratings for each movie, there's no reason why something like this couldn't be done with more official data like critic ratings or box office dollars.

Thanks for the link Jesper and Daniel!

Monday
Mar092009

Microsoft's Vision 2019

Apparently by 2019, we will all live in an infographic world, and that's good news for us.  Microsoft had the first public showing of the video at the Wharton Business Technology Conference.  Some found Microsoft's video inspiring, and some were not impressed.

I love some of the ideas shown in the video, but much of it also felt like the magic of Hollywood.  Because this blog is focused on infographics, I understand how much thought and effort from the designer goes into making just one infographic image useful and easy to understand.