About
Randy Krum
President of InfoNewt.
Data Visualization and Infographic Design

Infographic Design

Infographics Design | Presentations
Consulting | Data Visualizations

DFW DataViz Meetup

Join the DFW Data Visualization and Infographics Meetup Group if you're in the Dallas/Fort Worth area!

Search the Cool Infographics site

Custom Search

Subscriptions:


Feedburner

The Cool Infographics® Gallery:

How to add the
Cool Infographics button to your:

Cool Infographics iOS icon

- iPhone
- iPad
- iPod Touch


Read on Flipboard for iPad and iPhone

Featured in the Tech & Science category

Flipboard icon

Twitter Feed
From the Bookstore

Caffeine Poster

The Caffeine Poster infographic

Entries in atom (9)

Wednesday
Oct212009

Circular Periodic Table of the Elements


Mohd Abubakr has redrawn the classic periodic table in a circular pattern to improve the proximity and relationships between the elements.
So why change it? According to Mohd Abubakr from Microsoft Research in Hyderabad, the table can be improved by arranging it in circular form. He says this gives a sense of the relative size of atoms--the closer to the centre, the smaller they are--something that is missing from the current form of the table. It preserves the periods and groups that make Mendeleev's table so useful. And by placing hydrogen and helium near the centre, Abubakr says this solves the problem of whether to put hydrogen with the halogens or alkali metals and of whether to put helium in the 2nd group or with the inert gases.
The strongest feedback about the new circular table is that you have to rotate it to read it.  Kind of a problem when you print a poster and post it in a classroom or a laboratory.  Although I think it's an easy thing to remedy by changing the orientation of the text.

Original post on Technology Review by MIT, and found on VizWorld by Randall Hand.

Friday
Sep112009

"Meet The Elements" - infographic video for kids

Found on BoingBoing and Information Aesthetics, a infographic music video, "Meet The Elements", from They Might Be Giants from their new kids album titled "Here Comes Science". Video directed by Feel Good Anyway.

Monday
Apr272009

The AlloSphere: Step inside your visual data!

Awesome sphere that you step into and become completely immersed in visual data!  I can't wait for one of these to be available for the public to experience.  Great TEDTalks video.

JoAnn Kuchera-Morin demos the AlloSphere, a new way to see, hear and interpret scientific data. Dive into the brain, feel electron spin, hear the music of the elements ... and detect previously unseen patterns that could lead to new discoveries.

Friday
Dec122008

The Nuclear Express


From NYTimes.com, this graphic is a summary of the proliferation of nuclear weapons based on the new book "The Nuclear Express: A Political History of the Bomb and Its Proliferation" by Thomas C. Reed and Danny B. Stillman.  The graphic is part of the NY Times article titled "Hidden Travels of the Atomic Bomb".
"The Nuclear Express" a new book on the history of the atomic age, describes the interlocking web of influence and espionage behind the proliferation of nuclear technology.  This diagram gives a summary of the authors' tracking of the transfers of nuclear technology and secrets.
Thanks Jesse for sending in the link.

Monday
Feb042008

Who has the Nuclear Weapons?

An infographic video from GOOD Magazine, a quick 3-minute video that shows who has the nukes, how many they have, and how much damage would one nuke hitting the Empire State Building cause.

Found on tunequest.org

Monday
Nov052007

Infographic Video Advertisement


Found on Uswim, a French company developed an ad campaign around the infographic video style we saw in the Royksopp video.

It had such an impact that a few years later Areva, the French nuclear giant, wanted to use it for their advertising. Being denied it by the Norwegian pop group they finally went for the hit “Funky Town” on a video that looks very similar (as it was done by the same French art collectif H5 that did Royksopp’s video).


Their objective was to show Areva’s expertise in the energy sector (see their corresponding website using Flash animation) as part of the branding campaign of a company anticipating to go private (still waiting because of internal French politics). The choice of animated graphics was to reinforce the educative aspect on Areva’s business and avoid the harsh reality of images of nuclear plants. In a way the almost childish graphics (almost like a comic strip) make it look like a video game of some sort, some kind of SimCity. It was very successful and the idea was again used in a slightly different angle (accelerated special effects video) by EDF (another French energy giant) in a commercial

I found the link to Uswim on Simple Complexity.


Sunday
Sep162007

The Elegant Universe


Following my earlier post on Imagining the Tenth Dimension, I found that NOVA has put the entire 3-hour show The Elegant Universe on their website.


The show is full of different visual methods to visual strings, gravity, the scale of particles and multiple dimensions. Brian Greene really did a fantastic job with this show based on his book on the same name.

Sunday
Aug052007

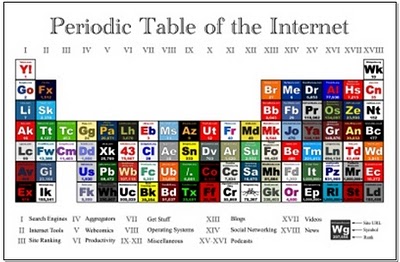
Periodic Table of the Internet


Wellington Grey has created a graphic representing some of the internet's most popular sites in a familiar layout. The Periodic Table of the Internet groups the most popular sites on the web in categories like Search Engines, Aggregators, Operating Systems, Blogs, Social Networking, etc. Each individual block links to its respective site.

Sunday
Jul152007

Hydrogen Atom


phrenopolis.com

Cool website that visualizes a hydrogen atom, showing how much empty space makes up our universe.

The page is scaled so that the smallest thing on it, the electron, is one pixel. That makes the proton, this big ball right next to us, a thousand pixels across, and the distance between them is... yep, fifty million pixels

If your monitor displays 72 pixels to the inch, then that works out to eleven miles - making this possibly the biggest page you've ever seen.