About
Randy Krum
President of InfoNewt.
Data Visualization and Infographic Design

Infographic Design

Infographics Design | Presentations
Consulting | Data Visualizations

DFW DataViz Meetup

Join the DFW Data Visualization and Infographics Meetup Group if you're in the Dallas/Fort Worth area!

Search the Cool Infographics site

Custom Search

Subscriptions:


Feedburner

The Cool Infographics® Gallery:

How to add the
Cool Infographics button to your:

Cool Infographics iOS icon

- iPhone
- iPad
- iPod Touch


Read on Flipboard for iPad and iPhone

Featured in the Tech & Science category

Flipboard icon

Twitter Feed
From the Bookstore

Caffeine Poster

The Caffeine Poster infographic

Entries in time (40)

Tuesday
May232017

How Do You Spend the Days of Your Life?

How the Average Working Adult Spends Days

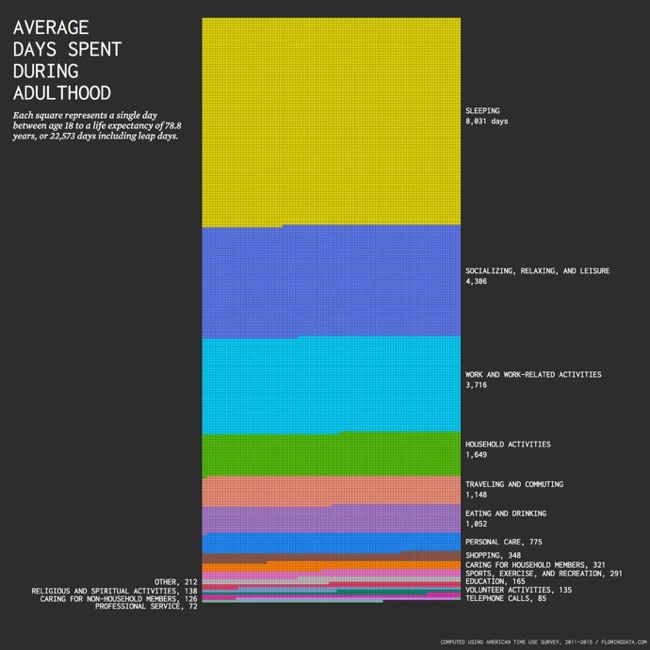
Nathan Yau from FlowingData has taken an in-depth look at the statistics behind How the Average Working Adult Spends Days in their lifetime.

There were some graphics going around that showed the total amount of time spent during an average person’s lifetime doing things. The numbers were pretty rough though.

For example, to calculate the number of days spent sleeping during a lifetime, it was assumed that the average person sleeps eight hours per day, and then estimates just extrapolated for life expectancy. But sleep patterns change as you age. You start to sleep less as you get older.

So I tried taking this into account using data from the American Time Use Survey. I still used averages, but I calculated averages for each year of life and then aggregated. Here’s what I got for adulthood (18 and older) — the time you’re presumably making your own choices. Employment and retirement are assumed.

Again, these are still averages for an adult who works and then retires around 65 years, so the same caveats apply as usual. Everyone’s own totals will be a bit different, especially as you compare across groups. For example, the time distribution for parents looks different from the distribution for those who never have kids. Similarly, some never enter the labor force whereas others work full-time.

The data is from the American Time Use Survey, which is made more easily available from IPUMS. After downloading data for 2011 through 2015, I tabulated and charted in R. Also, maybe you noticed that the number of squares doesn’t quite add up to 22,573. This is due to rounding, which offset the total above by three days.

I prefer data visualizations like this that show the actual number of days as squares (or other shapes/icons) instead of summarizing them together into a stacked bar chart or a doughnut chart. Seeing the full number of days represented gives the readfers a better understanding of the true magnitude of the values being shown

Found on Big Think

Friday
Apr142017

The Best Times to Post to Social Networks

The Best Times to Post to Social Networks infographic

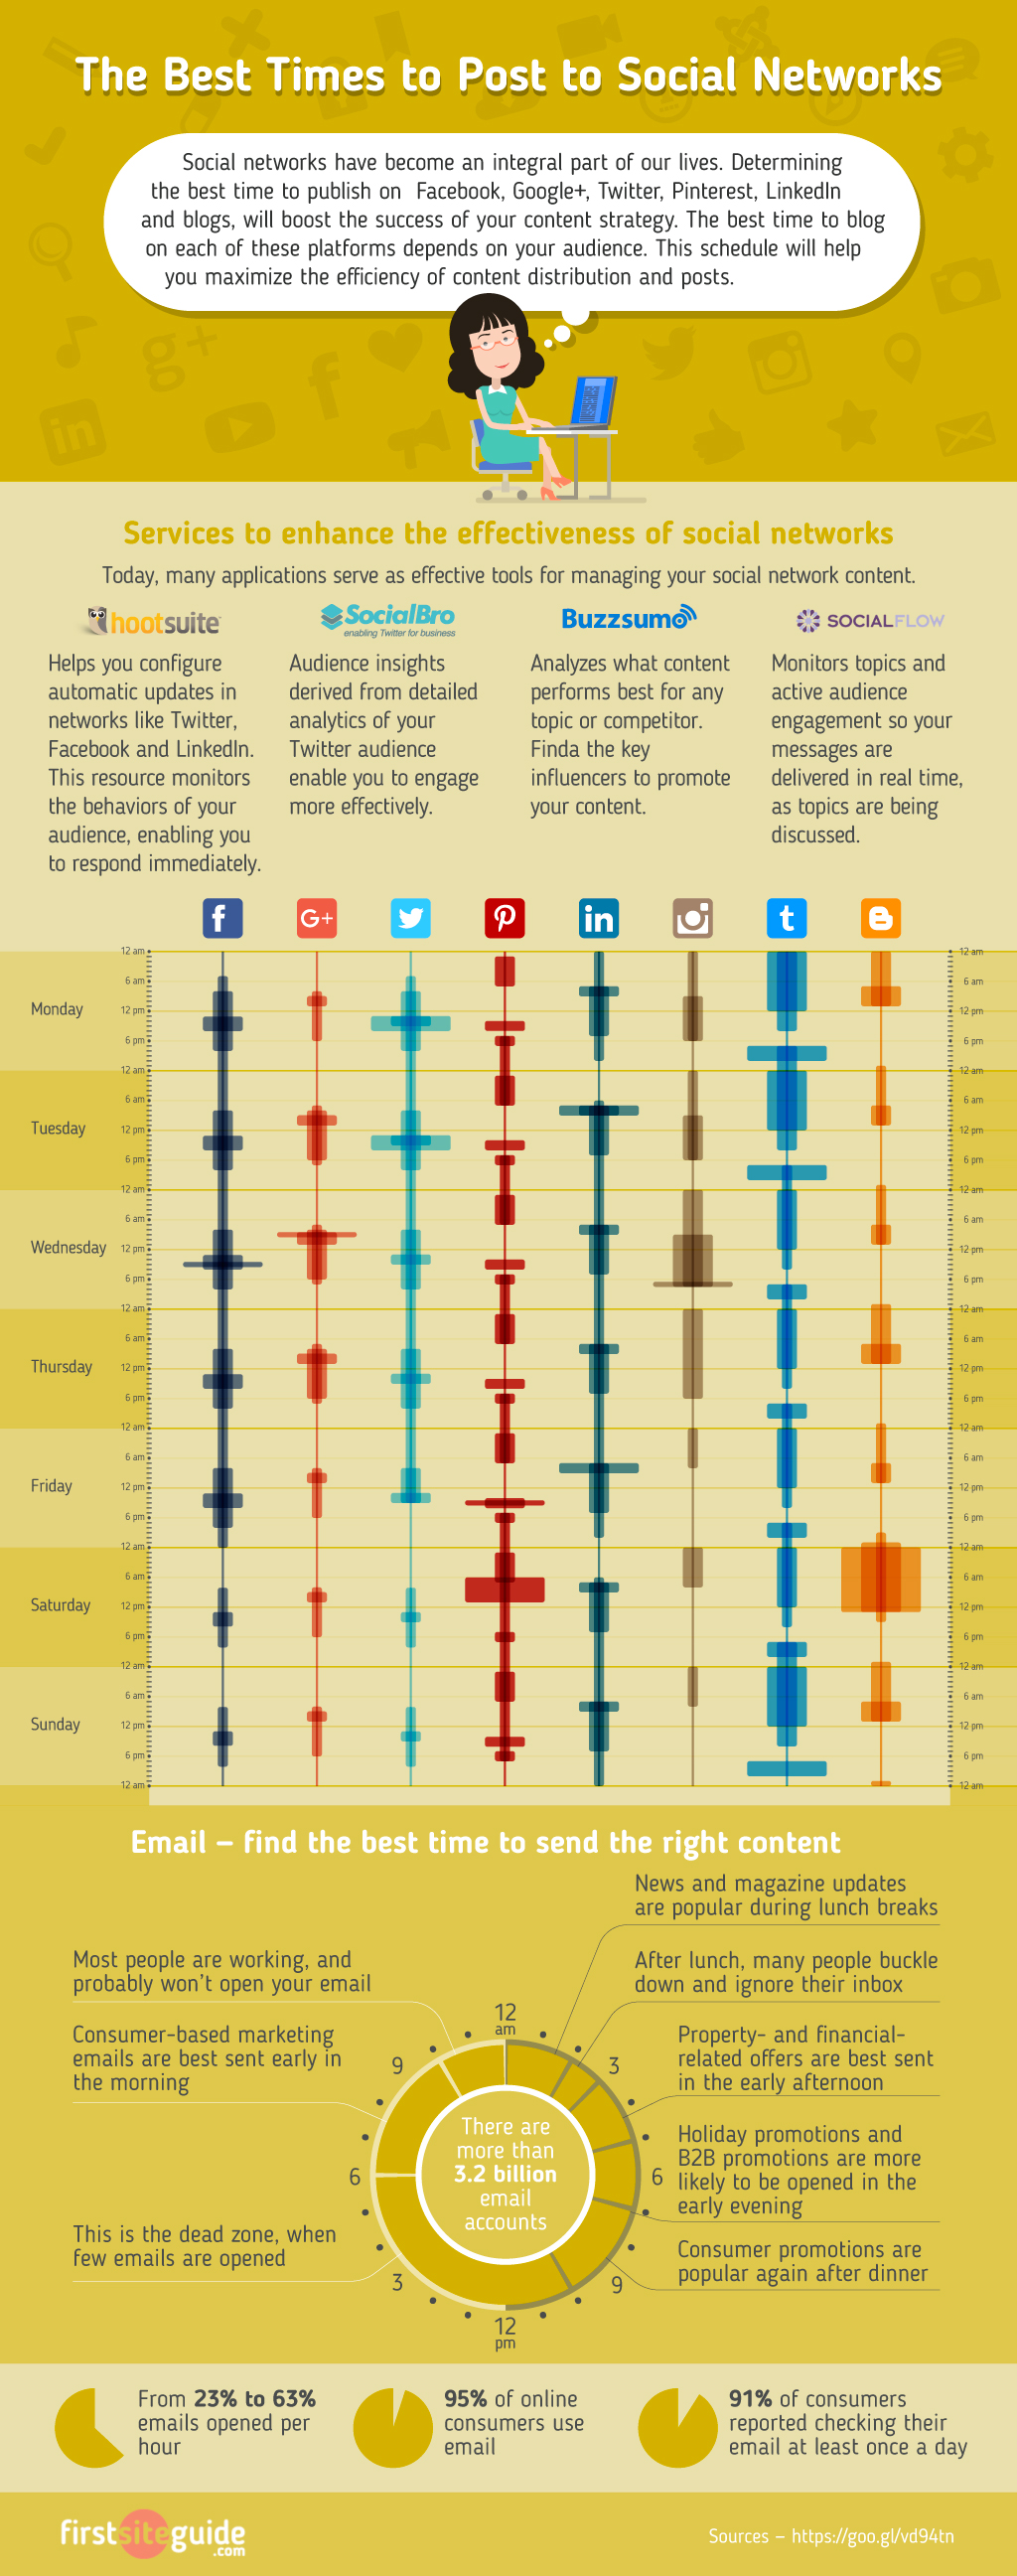
When you are promoting your product through social media platforms, you want to make sure you are setting yourself up for success. First Site Guide has published the The Best Times to Post to Social Media infographic cheat sheet gives you data on the daily high traffic times of each platform to increase the likelihood of your post being seen. It also gives tips on times to send emails based on your content. 

Social media’s all about throwing the metaphorical spaghetti at the wall and seeing what sticks, right? No. No, it’s not! Chances are good you saw that twist coming, but this First Site Guide cheat sheet is all about why time and type matter on social media. Believe it or not, there is a rhythm and a pulse to the tweets and the posts, and patterns of sharing and engaging with content which can be examined scientifically.

Why should you care, though? Well, as it turns out, knowledge is power and someone who knows when to post, where to post, what to post, and how often to post gets a lot more bang for their buck than someone who just sporadically adds random content to whichever social media platform has their attention.

Knowing your audience is an important part of the process. Did you know that emails containing news and magazine updates get opened more often during the lunch hour, but holiday promotions are best sent in the evenings?

There's some really good information here that was gathered from a number of different sources. However, I have a handful of serious issues with this design:

  • Is this data credible? I can't tell from what is shared on the infographic itself. The Sources link is just a shortened URL, so no visibility to where the sources of the data.
  • The Sources link is a downloadable Word DOC from a Russian cloud stoage site. The document includes nine links to data sources, but many of them are broken links.
  • Is the data visualization, I'm guessing the wider sections of the stream are the better times to post. There's no explanation.
  • For the Email section, the time wheel has the days and nights reversed (AM vs. PM). We don't all go to sleep for six hours after lunch.
  • A couple of text typos in the infographic.
  • The footer should include a copyright and the URL to the original infographic landing page so readers can find the full-size original when people don't share the actual link.
  • How do time zones play into these times and scheduling posts?

Thanks to Peter for sending in the link!

Monday
Jan262015

How to Have the Perfect Workday

How to Have the Perfect Workday infographic

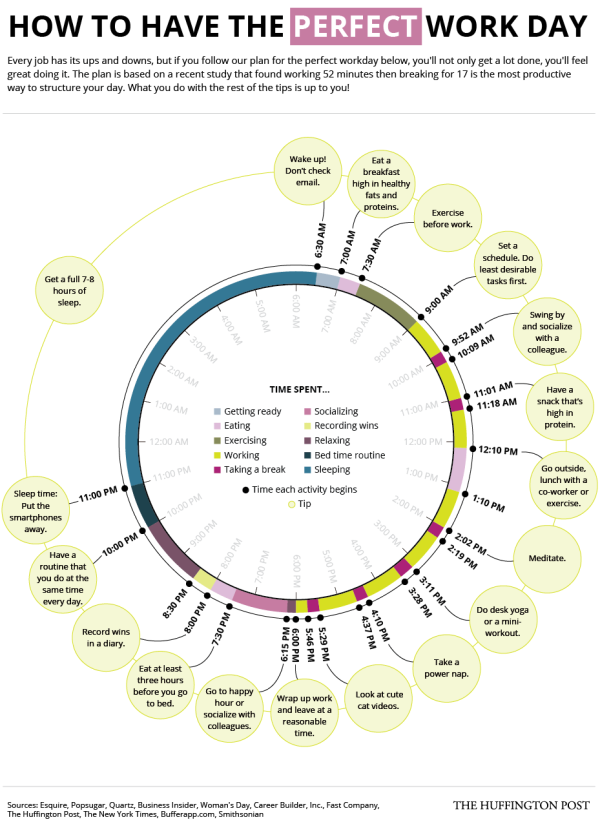
How do you manage your time? The How to Have the Perfect Workday infographic designed by Alissa Scheller for The Huffington Post tries to map out the perfect schedule to maximize your productivity. 

The good news is that there are plenty of little things you can do to improve both your productivity and your happiness if you feel stuck at your desk all day.

One simple trick is to structure your time better — which includes taking more breaks. In fact, the highest performers work for 52 minutes consecutively before taking a 17-minute break, according to a recent experiment conducted by the productivity app DeskTime.

Check out HuffPost’s perfect workday below:

The doughnut chart is easily understood by readers as visualizing the complete day, and this design tells this one story in the visualization very well. Nicely done.

Thursday
Jul102014

The Ultimate Guide to the Moustache

The Ultimate Guide to the Moustache infographic

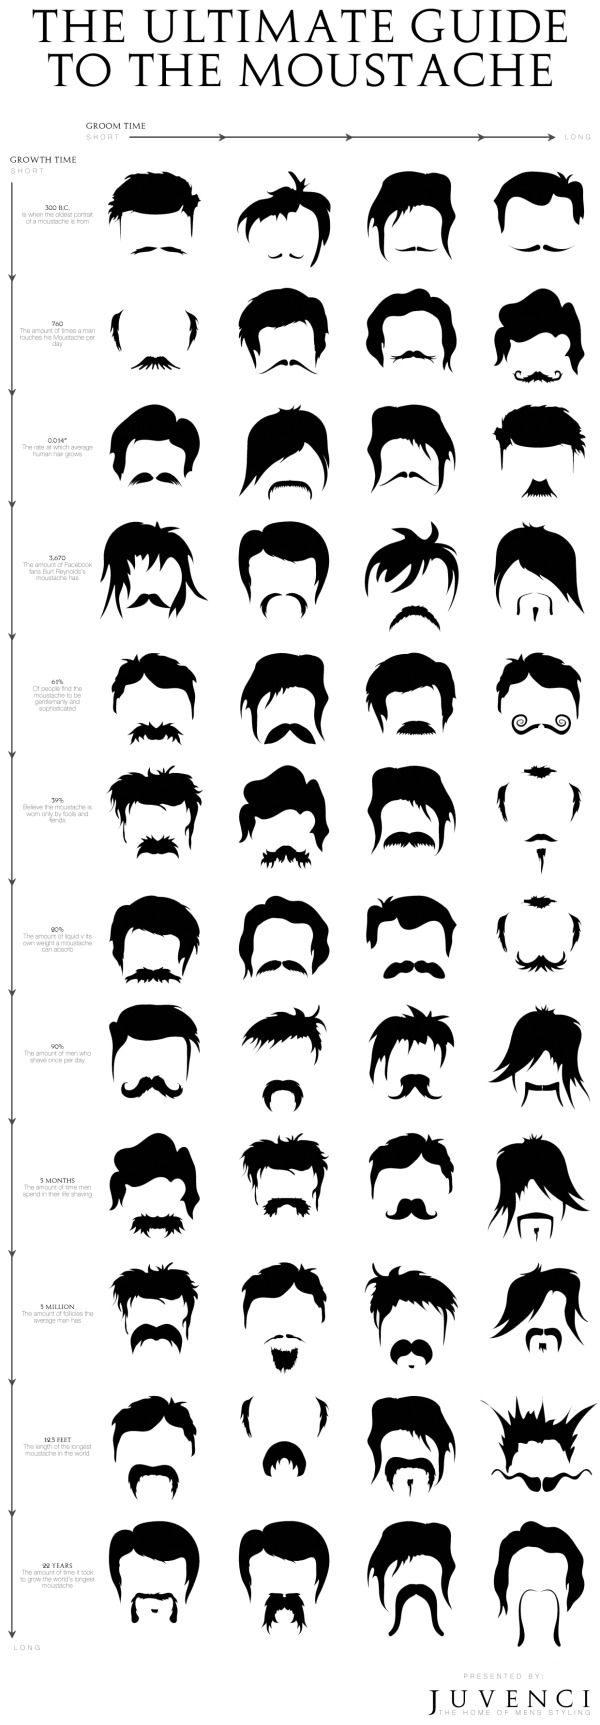
I moustache you a question. How do you pick your facial hair style?! The Ultimate Guide to the Moustache infographic presented by Juvenci balances length with groom time. Find out where you are on the spectrum!

We have just finished working on our ultimate guide to the moustache! It features 48 moustache styles sorted by a groom time v growth time matrix (with some fun moustache facts thrown in there too!).

This is a fun little graphic that brings style into the daily struggle of a man with his moustache.  The infographic design needs to include the infographic’s URL at the bottom of the graphic so that people can find the original.

Thanks to Conner for sending in the infographic!

Thursday
May222014

Hack Your Grill

Hack Your Grill infographic

Are you planning on grilling for Memorial Day? Check out the recommended cooking instructions for your meal with the Hack Your Grill infographic from Column Five.

With Memorial Day weekend right around the corner, we can’t wait to get our beer and BBQ on. But mastering the grill can be tricky, whether it’s raw veggies or red meat. To help us crack the code, we created the helpful infographic to make sure everything cooks at the right temperature and time.

Column Five created this guide to average cook times to take the guesswork out of grilling. The guide provides average times for a wide variety of beef, poultry, pork, and vegetable items you might plan on throwing on the grill this summer—all you’ll need is a watch and a meat thermometer.

An easy-to-read, clear guide to grilling times, this design does a great job of focusing on telling one story really well.

The tall format design works really for sharing online, but I would bet that many people will want to print this out as a cooking reference.  It would be nice to have a separate PDF version that breaks the design into two printable pages that readers can print out to keep near the grill.

I would recommend two things to improve the information included in the footer.  First, the sources list only shows the main URL of the sites where the data came from.  This means that any readers would have to search for the information themselves on those sites.  It would be more transparent to list the URL directly to the report or web page that shows the specific data used in the infographic.  

Second, the footer should include the URL directly to the infographic landing page on the Column Five site.  Sadly, many blogs and sites will share an infographic without appropriately linking back to the infographic landing page, and by putting the URL in the infographic itself readers will always be able to find the original.

Thanks to Column Five for sending in the infographic! 

Wednesday
May072014

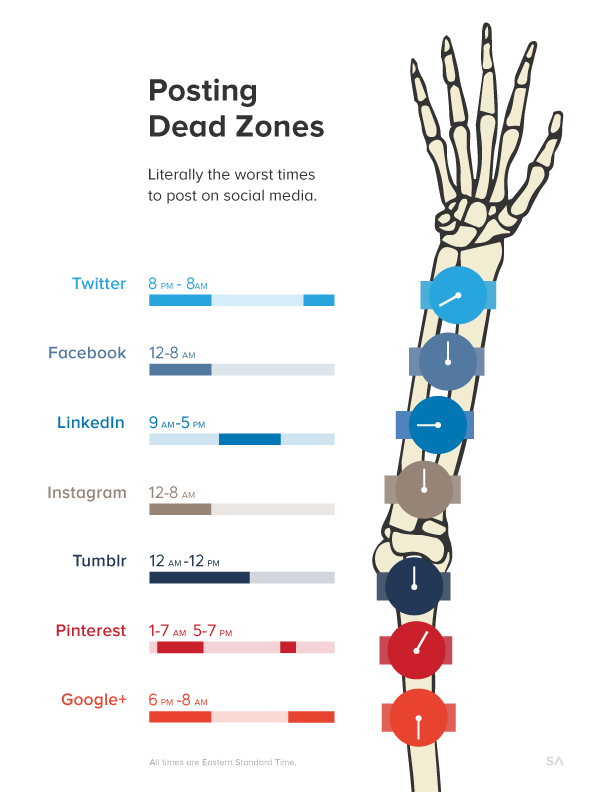
The Dead Zones: When Not to Post on Social Media

The Dead Zones: When Not to Post on Social Media infographic


The Dead Zones: When Not to Post on Social Media infographic from SumAll takes a look at the the worst times to post content on social media.

Now that everyone knows the best times to post on social media – and if you don’t, take a look at our infographic for a refresher–we started thinking about the flip side to the golden hours: the dead zones.

We researched what hours of the day your post will be seen by the fewest number of people and collected them all into this infographic. Beware.

Tell one story really well is one of the keys to a successful infographic, and this design does just that!

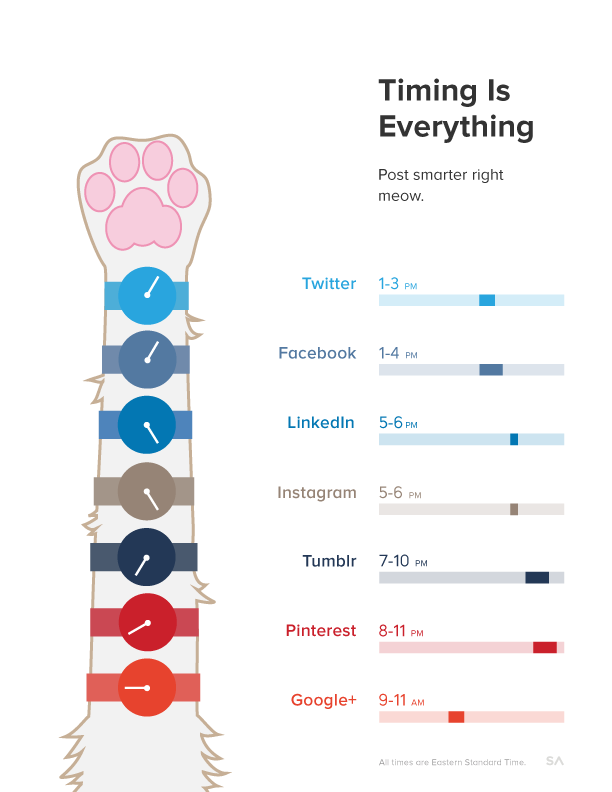
Here’s their prior infographic about the BEST times to post for comparison:

BEST times to post on social media infographic


Thursday
Apr102014

3 Common Time Wasters at Work

3 Common Time Wasters at Work infographic

Do you feel like your employees are slacking? The 3 Common Time Wasters at Work infographic from Biz 3.0 points out the time wasting problems so that you can target them and create a more efficient work day.

No business can afford to have wasted time at work, especially when growth and profitability is directly tied to how productive your employees are. So check out our new infographic that identifies the top three reasons why people waste their time at work, so that you can find possible solutions to eliminating them. 

Great data with fun illustrations that engage the audience.  Great topic for a productivity software company.  The design is informative and will appeal to a broad audience, while being directly related to their product.

However, with all of the number values shown in circles, very few of them are visualized.  For the percentages, the circles could at least have been doughnut charts coloring only the appropriate portion of the circumference.  A good infographic design is supposed to make the data meaningful and relevant to the audience.  This helps them better understand the data, and you have to visualize the information to make that work.

Thanks to John for sending in the link!

Friday
Mar212014

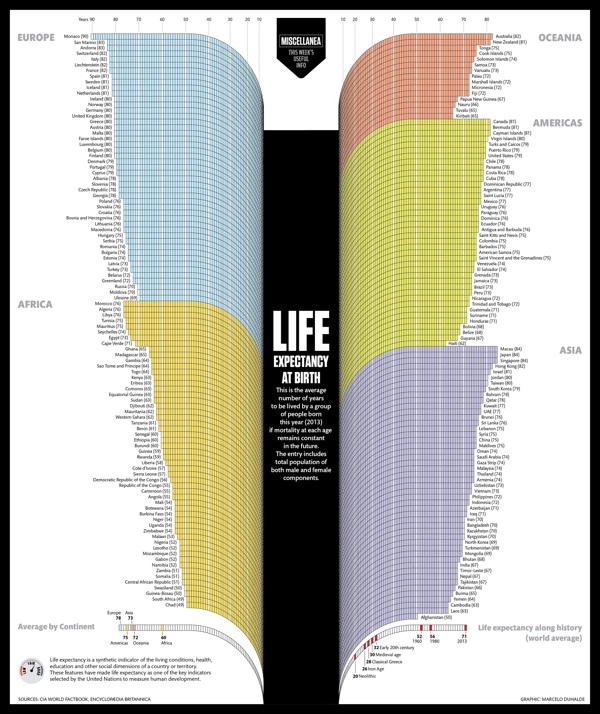
Life Expectancy at Birth

Life Expectancy at Birth infographic

The Life Expectancy at Birth infographic by designer Marcelo Duhalde from Muscat, Oman is a fantastic data visualization of the current life expectancies by country if you were born 2013.

Average number of years to be lived by a group of people born last year (2013) if mortality at each age remains constant in the future.  The entry includes total population of both male and female components.

From a design perspective, this infographic tells one story really well.  The infographic focuses on communicating one set of data effectively (lifespan) without complicating the design with additional extraneous information.  The overall design is very attractive, and grabs the audience’s attention with a big, central visual element.  The curving bars are unusual, but have the benefit of condensing the early years so they take less space in the overall design.

At the macro level, it’s obvious there is a big difference between the various countries and continents.  The readers are drawn in to compare the details of the different countries they are familiar with.  Usually starting with where you live, and then looking to see which countries fare better or worse than your location.  Of course the data represents a massive generalization of millions of people, but does tell a great story at that higher level.

The design looks like it’s perfectly sized to be printed as a poster, but I couldn’t find any mention of one.  The sources could definitely be more specific than just listing the top level sites that data was gathered from, and the URL to the infographic landing page on Visualizing.org should have been included in the footer information.

Found on PolicyMic

Tuesday
Oct292013

How Many Jelly Beans Do You Have Left?

The Time You Have (in Jelly Beans) is a great visualization in video of how many days are available to each of us during our lives.  Created by Ze Frank from Buzzfeed.com.  What will you do with the jelly beans you have left?

Found on Elite Daily.  Thanks to Mary Kaye for the link!

Friday
Oct182013

A Perspective on Time

A Perspective on Time infographic

A Perspective on Time is an infographic that puts large time scales into perspective using a series of stacked bar charts.  Starting with 24 hours, and building up to the life of the universe, each horizontal bar represents a new, larger time scale that incorporates the prior bar for context.

Humans are good at a lot of things, but putting time in perspective is not one of them. It’s not our fault - the span of time in human history, and even more so in natural history, are so vast compared to the span of our life and recent history that it’s almost impossible to get a handle on it.

Designed by Mayra Magalhães as a collaboration project between Visually and wait but why.  I love the building use of color throughout the design.  One bar’s color is then carried into the next bar for context.  The icons and minimal text for events also help make the design easy to read.

The footer should include the URL back to the original so readers can find the full-size version.  The scale of this design needs to be enlarged in order to read.