About
Randy Krum
President of InfoNewt.
Data Visualization and Infographic Design

Infographic Design

Infographics Design | Presentations
Consulting | Data Visualizations

DFW DataViz Meetup

Join the DFW Data Visualization and Infographics Meetup Group if you're in the Dallas/Fort Worth area!

Search the Cool Infographics site

Custom Search

Subscriptions:


Feedburner

The Cool Infographics® Gallery:

How to add the
Cool Infographics button to your:

Cool Infographics iOS icon

- iPhone
- iPad
- iPod Touch


Read on Flipboard for iPad and iPhone

Featured in the Tech & Science category

Flipboard icon

Twitter Feed
From the Bookstore

Caffeine Poster

The Caffeine Poster infographic

Entries in work (7)

Friday
Jan062017

Does Coffee Really Make You More Productive at Work?

Does Coffee Really Make You More Productive at Work? infographic

63% of Americans can't get through the work day without coffee. Does Coffee Really Make You More Productive at Work? infographic explores our cultural obsession with coffee. Turns out that coffee boosts your speed, not your talent so tasks that require quality over quantity do not benefit from caffeine. Toll Free Forwarding tells us how and when to drink coffee for it to be most effective. 

Could you start the day without your morning cup of coffee?   Latest research shows that 61% of Americans can’t get through the day without a cup of java, and even that’s 2% down from 2013.   Let’s face it, ever since the Europeans discovered coffee in the 1600s, it’s been an infatuation of the western world.  This magic brew that makes you vibrant and productive isn’t just an addictive substance, it’s a cultural phenomenon.  

Coffee shops are often credited as the birthplace of the Enlightenment, the American and French Revolutions, and even the Shins!   But what role does coffee have in the workplace?  Does it actually make us more productive or is it mankind’s most effective placebo? This infographic goes in-depth to explain just how coffee affects our daily routine, and how we can nurture our caffeine fixes without over-doing it.   So sit back with your bagel and morning brew, and enjoy the only Infographic that dares to ask: “Does Coffee Really Make You More Productive at Work?”

There's a lot of good information in this design, and it's organized nicely in sequence from top-to-bottom. Most of the information is visualized with good, related illustrations or icons.

It's odd that this infographic comes from Toll Free Forwarding, a company whose business has nothing to do with coffee. This is a challenge for relevance in the SEO world, and if this infographic becomes popular, it still may not have a significant benefit to the publisher because it will be promoting keywords unrelated to their business.

Thanks to Jennie for sending in the link!

Tuesday
Oct202015

How to Improve Your Chances of Getting an Apprenticeship

How to Improve Your Chances of Getting an Apprenticeship infographic from Apprenticeship Connect has compiled a great list of tips and tricks to land your dream apprenticeship! The infographic covers ways to find an apprenticeship, and then how to best present yourself.

With the government working hard to create three million new apprenticeships within the next five years, there has never been a better opportunity to earn while you learn. Apprenticeship Connect reveals some very handy tips and tricks to help you during your search.

There are so many different types of apprenticeships out there in the market, so you don’t have to go down the path of university once you leave school.

In order to secure your dream apprenticeship however, you’ll need to impress your potential employer.

With the internet and social media play an ever increasing role in finding an apprenticeship; there are several things you need to keep in mind when looking for the next stage in your career.

This is a text-heavy design, but it's loaded with good content.

The footer is missing a copyright (or Creative Commons) license statement and the URL to the infographic landing page. It lists the home page for Apprenticeship Connect, but there is no mention of the infographic on there. It's really difficult for readers to find the original, full-size infographic.

Monday
Jan262015

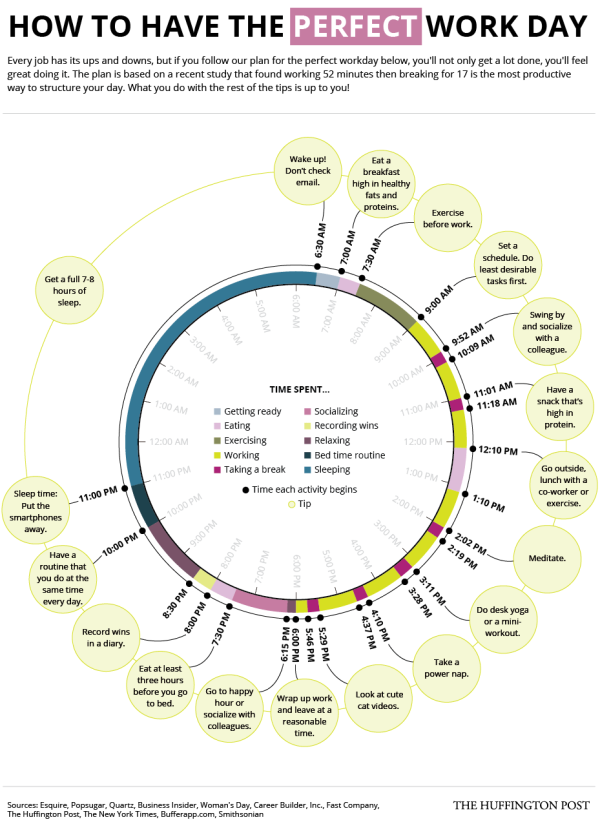
How to Have the Perfect Workday

How to Have the Perfect Workday infographic

How do you manage your time? The How to Have the Perfect Workday infographic designed by Alissa Scheller for The Huffington Post tries to map out the perfect schedule to maximize your productivity. 

The good news is that there are plenty of little things you can do to improve both your productivity and your happiness if you feel stuck at your desk all day.

One simple trick is to structure your time better — which includes taking more breaks. In fact, the highest performers work for 52 minutes consecutively before taking a 17-minute break, according to a recent experiment conducted by the productivity app DeskTime.

Check out HuffPost’s perfect workday below:

The doughnut chart is easily understood by readers as visualizing the complete day, and this design tells this one story in the visualization very well. Nicely done.

Thursday
Apr102014

3 Common Time Wasters at Work

3 Common Time Wasters at Work infographic

Do you feel like your employees are slacking? The 3 Common Time Wasters at Work infographic from Biz 3.0 points out the time wasting problems so that you can target them and create a more efficient work day.

No business can afford to have wasted time at work, especially when growth and profitability is directly tied to how productive your employees are. So check out our new infographic that identifies the top three reasons why people waste their time at work, so that you can find possible solutions to eliminating them. 

Great data with fun illustrations that engage the audience.  Great topic for a productivity software company.  The design is informative and will appeal to a broad audience, while being directly related to their product.

However, with all of the number values shown in circles, very few of them are visualized.  For the percentages, the circles could at least have been doughnut charts coloring only the appropriate portion of the circumference.  A good infographic design is supposed to make the data meaningful and relevant to the audience.  This helps them better understand the data, and you have to visualize the information to make that work.

Thanks to John for sending in the link!

Friday
Apr042014

44 Simple Daily Activities To Enjoy Your Work

44 Simple Daily Activities To Enjoy Your WOrk infographic

Here are 44 Simple Daily Activities To Enjoy Your Work created by OfficeVibe to help keep the motivation high and add some fun back in your work day!

You might think it’s a truism, but most people tend to forget this crucial fact:

You should always make the effort to build good habits that will make you healthier, happier, and more productive over time.

Also, when it comes to new habits, it’s important to remember that these are things to do for long term changes.

This infographic will give you an overview of 44 habits to improve your productivity, your health and the overall quality of your workdays.

A fun infographic for Friday!  There is some fantastic information included in here.  The topic choice will also have a long Online Lifespan, and has the potential to be relevant to readers for years.

The design is visually very busy.  I understand the color-coding of the different activities, and those should be the visual highlight.  The illustrations in the background should be less “noisy” with simpler illustrations and fewer colors.  I might even consider making the background illustrations grayscale to make the 44 activities stand out even more.

The font choices in the text boxes seems too small, and clicking the image on the infographic landing page doesn’t open up a larger version.  I think this was done to allow more of the background illustration to be visible, even though that shouldn’t be the focus of the design.  The designer didn’t want all of their background illustration work to be covered up by the important information?  This also made the great activity icons too small to understand.

The point scores for each activity were intended to add the element of gamifying these activities, but that gets lost in the overall design.  There aren’t any score total categories, so there’s no benefit to the readers from adding up their scores.

The additional text on the infographic landing page is a little out of control.  Every one of the 44 activities has a few paragraphs of text on the page providing more details.  WAY more information that readers will stick around for, but thankfully they kept that separate from the infographic design.  

The infographic should include the URL to the landing page so readers can find this additional information about the activities as well as the original, full-size version of the infographic.  They include the URL to the OfficeVibe home page, but there are no links to the infographic there.

Thanks to @JacobShirar on Twitter for sending in the link!

Monday
Oct142013

The Modern Workforce

The Modern Workforce infographic

The Modern Workforce infographic from unum shows that the workforce demographic has changed in the last 30 years, but the benefits have not evolved to support this. There are more women, disabled, and older people in the modern workforce, but the protection, time away from work, and services given to employees are not keeping up.

The research finds significant gaps have opened up between employer-provided benefits and the protection required by today’s workforce. At a time when the demographics of the modern workforce are shifting towards employees that have a greater need for financial benefits, the research shows that the ratio of wages to employee benefits is outdated.

As a result, we’re more likely to fall into financial difficulty than we were 30 years ago. And, if we’re in financial difficulty we’re less productive, so it’s in an employer’s best interests to better protect their people.

We’ve published research called Keeping Pace? Financial Insecurity in the Modern Workforce with Cass Business School. It paints a picture of how the make-up of our workforce has changed. It also makes recommendations about what employers should do to better protect their people.

The infographic has some great data from their case study research, but the design could have done a better job making the information easier to understand for readers.  Many of the visualizations don’t match the data from the study.

For example, the pie slices shown in the Demographic Changes section changed their radius instead of their angle.  This creates a false visualization because the area of a pie slice with twice the radius is much larger than the data values.  So, the visualization is displaying a much larger increase than the data actually shows.  This design mistake with the radii was repeated in the Social Changes section, so that visualization doesn’t match the data either.

Unum also created a motion graphic video to share some of the research findings as well.  I would have recommended tying these two content types together, using the same design assets in both.  They already have the data visualizations from the static infographic, so use them in the video as well.


Thanks to Ed for sending in the link!

Thursday
Sep052013

The Monstrous Cost of Work Failure

The Monstrous Cost of Work Failure infographic

The Monstrous Cost of Work Failure infographic from AtTask looks closely at the cost of failure within companies.  How many at-bat attempts does your company take before hitting a homerun?

Projects fail, budgets blow up, fire drills reign and chaos abounds

Work failure plagues all types of teams – from marketers working on a campaign to IT teams deploying a major software system. The root of the problem – impacting 70% of teams – is work chaos. And it can be conquered. Click on the image below to view or download the full graphic and learn more about work failure and how to avoid it.

Fun design with monster characters to help tell the story to readers.  The design does a good job telling a 3-part story to the audience:

  1. Introduction - What is the problem?
  2. The Main Event - How big is the impact?  How can this effect me?
  3. Call To Action - How do I fix the problem? 

Big fonts are not data visualizations, and in this design I would liked to see more of the statistics visualized.  Visualization would help put the data into context for the audience.  The footer of the design should also include the copyright information and the URL to the original infographic landing page so readers can see the full-size infographic.

Thanks to Matt for sending in the link!