About
Randy Krum
President of InfoNewt.
Data Visualization and Infographic Design

Infographic Design

Infographics Design | Presentations
Consulting | Data Visualizations

DFW DataViz Meetup

Join the DFW Data Visualization and Infographics Meetup Group if you're in the Dallas/Fort Worth area!

Search the Cool Infographics site

Custom Search

Subscriptions:


Feedburner

The Cool Infographics® Gallery:

How to add the
Cool Infographics button to your:

Cool Infographics iOS icon

- iPhone
- iPad
- iPod Touch


Read on Flipboard for iPad and iPhone

Featured in the Tech & Science category

Flipboard icon

Twitter Feed
From the Bookstore

Caffeine Poster

The Caffeine Poster infographic

Entries in coffee (5)

Friday
Jan062017

Does Coffee Really Make You More Productive at Work?

Does Coffee Really Make You More Productive at Work? infographic

63% of Americans can't get through the work day without coffee. Does Coffee Really Make You More Productive at Work? infographic explores our cultural obsession with coffee. Turns out that coffee boosts your speed, not your talent so tasks that require quality over quantity do not benefit from caffeine. Toll Free Forwarding tells us how and when to drink coffee for it to be most effective. 

Could you start the day without your morning cup of coffee?   Latest research shows that 61% of Americans can’t get through the day without a cup of java, and even that’s 2% down from 2013.   Let’s face it, ever since the Europeans discovered coffee in the 1600s, it’s been an infatuation of the western world.  This magic brew that makes you vibrant and productive isn’t just an addictive substance, it’s a cultural phenomenon.  

Coffee shops are often credited as the birthplace of the Enlightenment, the American and French Revolutions, and even the Shins!   But what role does coffee have in the workplace?  Does it actually make us more productive or is it mankind’s most effective placebo? This infographic goes in-depth to explain just how coffee affects our daily routine, and how we can nurture our caffeine fixes without over-doing it.   So sit back with your bagel and morning brew, and enjoy the only Infographic that dares to ask: “Does Coffee Really Make You More Productive at Work?”

There's a lot of good information in this design, and it's organized nicely in sequence from top-to-bottom. Most of the information is visualized with good, related illustrations or icons.

It's odd that this infographic comes from Toll Free Forwarding, a company whose business has nothing to do with coffee. This is a challenge for relevance in the SEO world, and if this infographic becomes popular, it still may not have a significant benefit to the publisher because it will be promoting keywords unrelated to their business.

Thanks to Jennie for sending in the link!

Thursday
Jan152015

Starbucks Espresso Infographic Advertising

 
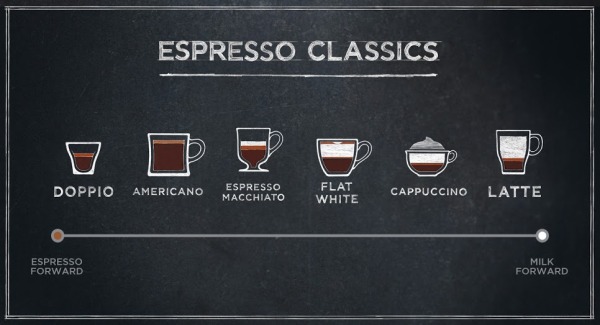
Can you name all 6 Espresso Classics?
Starbucks Guatemala


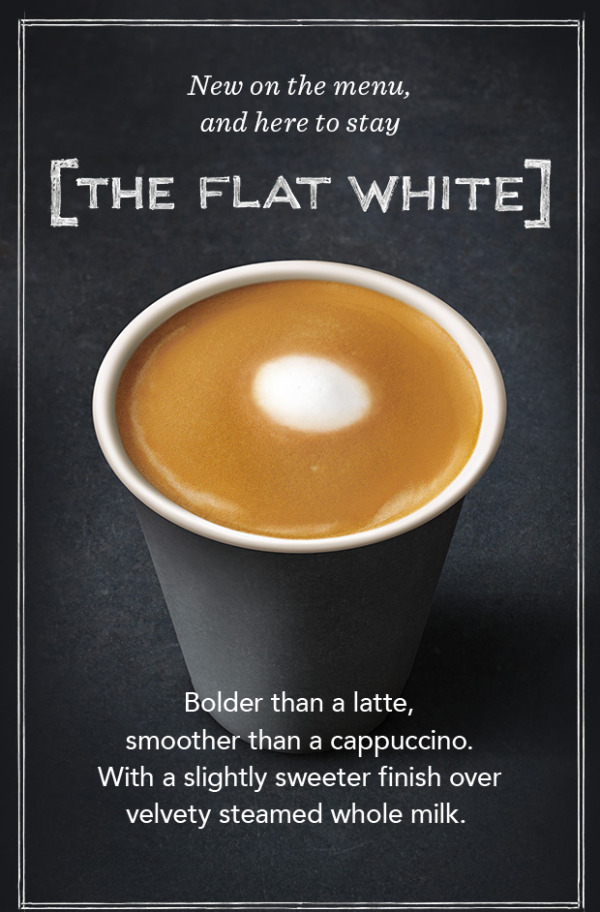
NOW AT STARBUCKS! The newest addition to the Starbucks menu is the Flat White. But what is the difference between The Flat white and the rest of Starbuck’s menu?

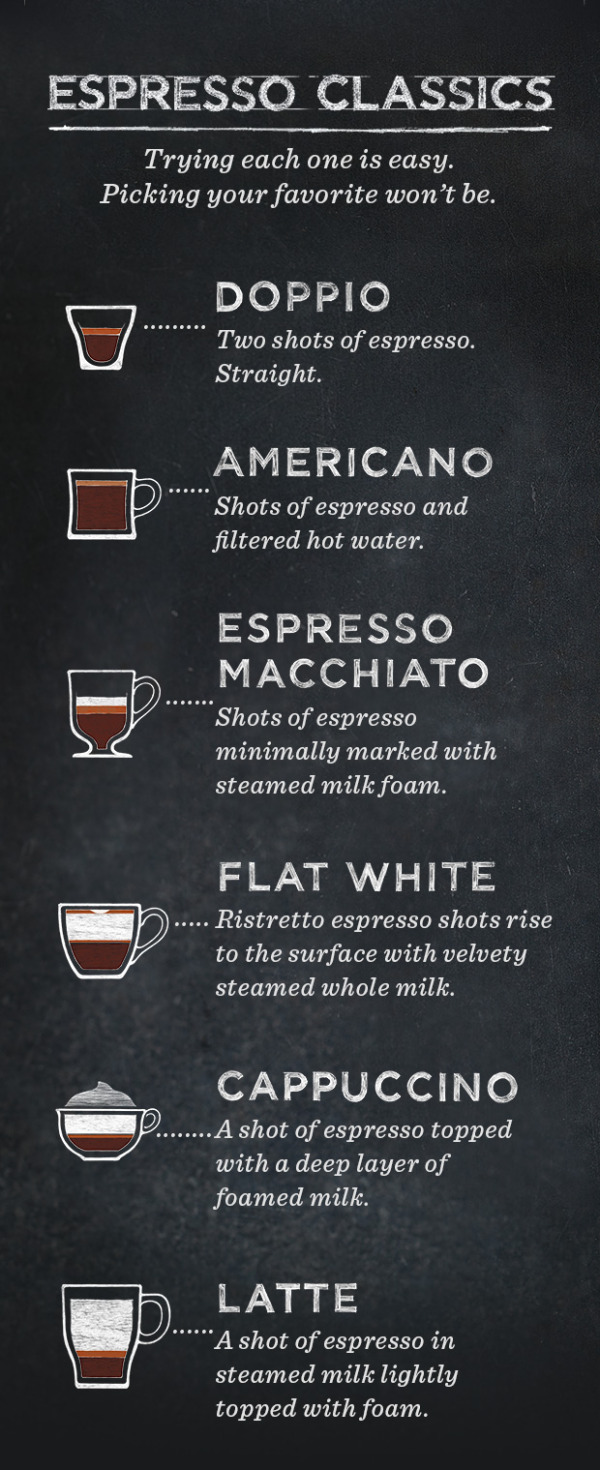
Starbucks sent this cool infographic as a content marketing piece in an email to all of their customers introducing The Flat White to their menu. The infographic visualizes the recipes for the 6 Espresso Classics. Currently available for view in most Starbucks stores around the country is an infographic that explains the differences between the styles of drinks on the menu.

The graphics in the email are actually the 3 separate images you see above, and I assume they could be changed for different people receiving the email. For example, someone else might receive an email about the Cappuccino or a different coffee flavor ad at the bottom. Good for flexibility in the emails, but bad for sharing in social media.

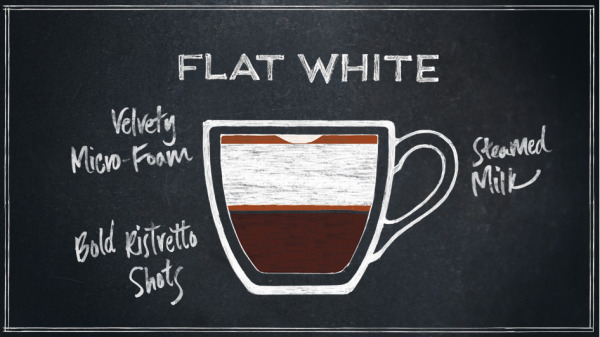
A product of simplicity, crafted into artistry, our baristas know that balance is key to the perfect Flat White. An extra ristretto shot ensures that it’s bolder than a latte, yet steamed milk keeps it smoother than a cappuccino. But perfection doesn’t end there—the technique for steaming and pouring the milk requires close attention as well. Steamed milk is folded into itself creating a velvety microfoam that gives the Flat White its silky texture and signature white dot.

Starbucks The Flat White

Love the cafe-style chalkboard look, and the layered drink r recipe visualization design!

Using this infographic in an email campaign is brilliant, but I wish it had been designed to also stand on its own so it could be shared online in social media easier.

Starbucks Espresso Spectrum

They use this design style throughout their entire espresso menu of drinks.

Thanks to Starbucks for sending the infographic to it’s customers! I put the separate pieces together below to make sharing easier!

Starbucks The Flat White Espresso Email Infographic

Wednesday
May232012

Fast Facts on Coffee Consumption 

Fast Facts on Coffee Consumption infographic


Pouring in Your Cup: Fast Facts About Coffee Consumption is a good infographic from Hamilton Beach.

This is a good example of a company publishing an informative, marketing infographic about a topic related to their products (coffee makers), without feeling like a sales pitch or ad for their products.  However, I don’t think there is a clear story told by the infographic.  It’s generally a bunch of coffee and caffeine statistics put together in an infographic without a clear message.

I like the design and the simple color palette.  Most of the visualizations are clear and easy to understand except the bunch of coffee cups lined up in the middle.  I think each cup is supposed to represent the 20 cups/week the average office worker drinks, and all of the cups together is supposed to represent a year of coffee consumption.  When you line up images like this, the rows really should have only 10 images each for the reader to easily understand the quantity.  So, there should be 52 cups to represent the whole year, but there are only 48 cups shown.

There are a handful of stand-alone statistics that are just shown in text, that could have been visualized.  The clock image shown next to the stats “24 minutes a day” should have had a highlighted portion showing 24 minutes.  I like the male/female symbols used on the coffee cups, and the Venn-diagram style of coffee blends is great.

I’m going to go pour myself my third cup of coffee this morning…

Found on Infographics Showcase, Infographic Pics and Infographipedia

Wednesday
Feb222012

Tea & Biscuit Dunking Guide

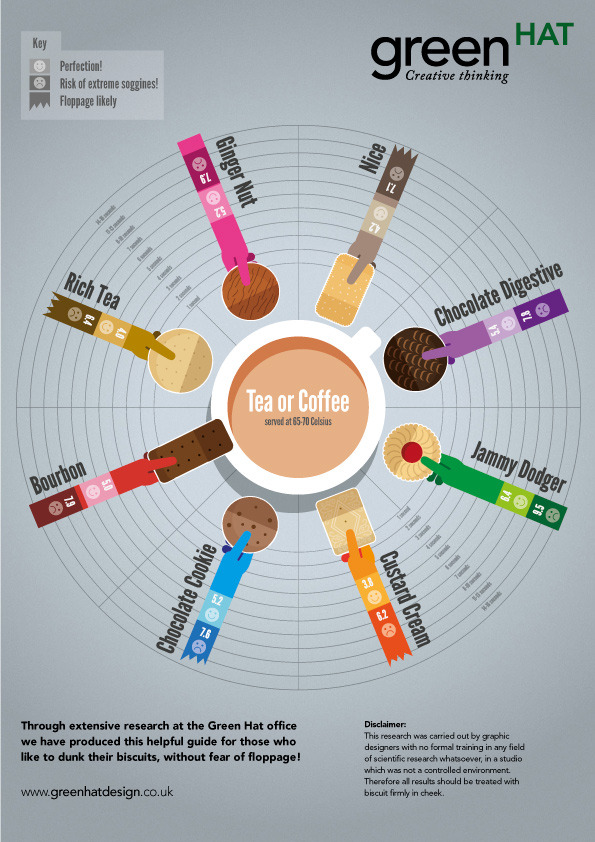
The Tea and Biscuit infographic from Green Hat Design in the UK shows avid dunkers of biscuits the proper timing to keep their favorite snacks in the tea or coffee to conquer floppage and avoid the disappointment of contamination!  Also available as a high-resolution PDF.

This biscuit infographic is based on 8 of our favourite UK brands which helps us (and others) to get the best out of his (or her) biccy when dunking it in hot tea or coffee, while at the same time assisting the user to avoid… floppage. That unfortunate moment that the biscuit suddenly gives way and contaminates your beverage. Nasty. We feel many could actually benefit from such details. I know it has changed my life.

This one is a fun topic.  Apparently the biscuits in the UK are so hard you have to dunk them to eat them…  :)

The radial design works well to show three values for each biscuit, and is easy for the reader to compare them.  The illustrations work well, even though readers in the U.S. (myself included) won’t recognize any of the biscuits.

A couple things are missing from a Marketing Infographic design perspective.  It needs a title!  I made up the “Tea & Biscuit Dunking Guide” because it didn’t have a good title of its own.  There should be some type of license statement, and in this case I would suggest Creative Commons.

The PDF file is hosted on the Green Hat Design site, but the infographic isn’t displayed anywhere.  t’sI hard to share a PDF compared to how easy it is to share an image file online.  It REALLY needs it’s own official landing page on the Green Hat Design site to display the infographic, and be the one place you want everyone else (like this blog) to link to.  They had uploaded it to visual.ly, and I linked to it there, but that shouldn’t be the primary landing page if they want to drive traffic to their site and awareness to their brand.

Thanks to Steve for sending in the infographic!

Wednesday
Jun152011

Caffè Italiano: 50 Types of Italian Coffee


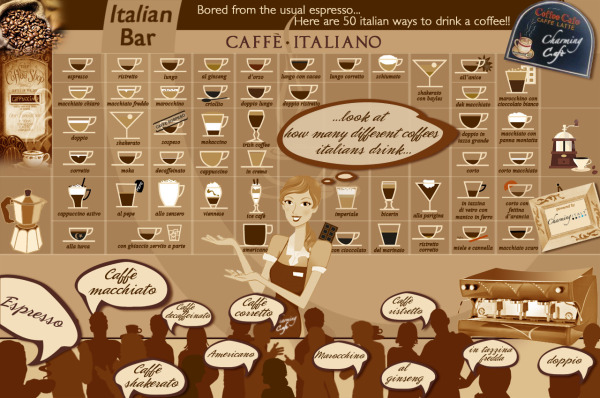
Caffè Italiano is another mouth-watering infographic from CharmingItaly.com.  I love how they took what could have been a standard drink ingredients visualization one step further and designed it as a menu board for an Italian coffee bar.

For Italians, coffee break is a sort of ritual in which the conviviality is a key point. Around a good coffee you can have a chat, take a few minutes for yourself and relax. It’s not just about inserting something into the stomach.

For Italians, drinking a good coffee is a pleasure: it is something to be sipped and not to be swallowed down; it is something to relish in the fullness of its flavour.

This is why a bad coffee gets Italians in a bad mood, while a good coffee can make their day!

When you enter an Italian Bar, around the clock, pay attention on what’s around you: we bet you won’t find 10 people ordering the same type of coffee!

The types of coffee in the Infographic are written in Italian, so you will be able to order them in the right way at the Bar!

The only problem is that there isn’t any guide or legend for the reader to understand the meaning behind the different colored portions of each drink.  They look carefully designed to be accurate to the how the drinks are mixed, but that effort is lost without an explanation.

Thanks to Paolo for sending in the link!