About
Randy Krum
President of InfoNewt.
Data Visualization and Infographic Design

Infographic Design

Infographics Design | Presentations
Consulting | Data Visualizations

DFW DataViz Meetup

Join the DFW Data Visualization and Infographics Meetup Group if you're in the Dallas/Fort Worth area!

Search the Cool Infographics site

Custom Search

Subscriptions:


Feedburner

The Cool Infographics® Gallery:

How to add the
Cool Infographics button to your:

Cool Infographics iOS icon

- iPhone
- iPad
- iPod Touch


Read on Flipboard for iPad and iPhone

Featured in the Tech & Science category

Flipboard icon

Twitter Feed
From the Bookstore

Caffeine Poster

The Caffeine Poster infographic

Entries in statisitcs (2)

Friday
Dec082017

Why Do Businesses Fail?

Why Do Businesses Fail? infographic

Starting your own business can be rewarding, but there are a lot of challenges. Why Do Businesses Fail? infographic from Insurance Quotes and NowSourcing outlines some of the biggest problems, paired with solutions.

Small businesses often have a hard time making it work. Just how hard of a time may surprise you. Did you know that 20 percent of businesses fail in the first year, while 70 percent fail by year 10? The biggest contributing factor may seem obvious — cash flow problems.

Despite all these challenges to starting and maintaining your own business, the payoff can make it worthwhile. Here at insuranceQuotes we want to help you navigate the challenges of starting a small business and understand the pitfalls that lay ahead. Here are some facts and strategies that can put you on the path to success.

Information is key for small businesses to survive and thrive. Keep in mind that having the proper business insurance can help you keep a mishap from becoming a disaster, whether you are just starting out in a new business or have been around for years.

Let us know your thoughts on the information we provided and please share any personal business stories that may help other entrepreneurs on our Facebook page. Your successes or failures could help others.

Big Fonts are not Data Visualziations!

There's a lot of great data included in this infographic, but there's too much text in this design and a number of the statistics could have been visualized better. Way too many statistics are shown as just large text numbers without any visualization or context.

There are a number of things wrong with this particular chart. The bar lengths don't match the data values. The bars for 220,000 and 205,000 should be very close, and they're not. Here I've added corrected bars to each cluster using the existing bar length for the New Businesses bar as the base.
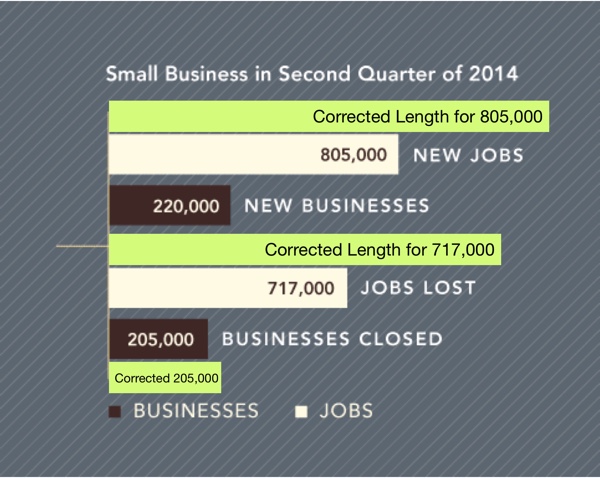
Maybe this is a non-zero baseline chart? If so, this is intentionally misleading to readers by showing the scale.

Found on Entrepreneur

Wednesday
May232012

Fast Facts on Coffee Consumption 

Fast Facts on Coffee Consumption infographic


Pouring in Your Cup: Fast Facts About Coffee Consumption is a good infographic from Hamilton Beach.

This is a good example of a company publishing an informative, marketing infographic about a topic related to their products (coffee makers), without feeling like a sales pitch or ad for their products.  However, I don’t think there is a clear story told by the infographic.  It’s generally a bunch of coffee and caffeine statistics put together in an infographic without a clear message.

I like the design and the simple color palette.  Most of the visualizations are clear and easy to understand except the bunch of coffee cups lined up in the middle.  I think each cup is supposed to represent the 20 cups/week the average office worker drinks, and all of the cups together is supposed to represent a year of coffee consumption.  When you line up images like this, the rows really should have only 10 images each for the reader to easily understand the quantity.  So, there should be 52 cups to represent the whole year, but there are only 48 cups shown.

There are a handful of stand-alone statistics that are just shown in text, that could have been visualized.  The clock image shown next to the stats “24 minutes a day” should have had a highlighted portion showing 24 minutes.  I like the male/female symbols used on the coffee cups, and the Venn-diagram style of coffee blends is great.

I’m going to go pour myself my third cup of coffee this morning…

Found on Infographics Showcase, Infographic Pics and Infographipedia