About
Randy Krum
President of InfoNewt.
Data Visualization and Infographic Design

Infographic Design

Infographics Design | Presentations
Consulting | Data Visualizations

DFW DataViz Meetup

Join the DFW Data Visualization and Infographics Meetup Group if you're in the Dallas/Fort Worth area!

Search the Cool Infographics site

Custom Search

Subscriptions:


Feedburner

The Cool Infographics® Gallery:

How to add the
Cool Infographics button to your:

Cool Infographics iOS icon

- iPhone
- iPad
- iPod Touch


Read on Flipboard for iPad and iPhone

Featured in the Tech & Science category

Flipboard icon

Twitter Feed
From the Bookstore

Caffeine Poster

The Caffeine Poster infographic

Entries in Phone (13)

Tuesday
Oct232018

Smartphone Etiquette 2018

Smartphone Etiquette 2018 infographic

It is 2018 and our phones have become intricate to our daily lives. The Smartphone Etiquette 2018 infographic shows the results of a survey done by socilamediatoday.com to see what American's attitudes and behaviors are towards smartphones.

Smartphones have become a key part of our everyday interactive process, offering the entire internet, and our social sphere, at our fingertips at any given moment.

But just how much are you using your mobile device, and how immersive has it become? KDM Engineering interviewed a group of 2,000 Americans to find out, asking questions on how often people check their phones, how they use their devices in the workplace and what's acceptable mobile behavior in public. 

The responses will no doubt come as little surprise, though it's certainly impactful to see some of those behavioral trends highlighted in hard data.

You can check out the full results in the infographic below - and of particular note for marketers, look at which notification types users respond to most urgently.

A lot of good statistics here, but way too many of them are just shown as big numbers in text. That doesn't put the information into context for the readers.

Found on socialmediatoday.com

Thursday
Aug132015

Android Fragmentation Visualized

Android Fragmentation Visualized

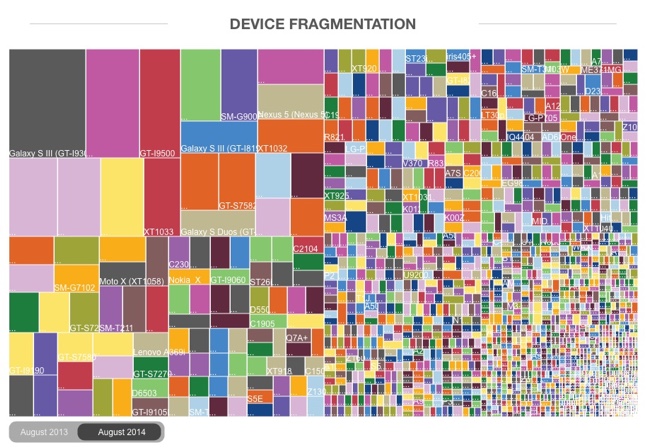
This one data visualization can demonstrate why mobile responsive web design is important: Android Fragmentation Visualized. OpenSource published a number of data visualizations, both static and interactive, that show the tremendous market fragmentation in the market of Android phones and devices. This treemap shows market share by device.

Fragmentation is both a strength and weakness of the Android ecosystem, a headache for developers that also provides the basis for Android’s global reach. Android devices come in all shapes and sizes, with vastly different performance levels and screen sizes. Furthermore, there are many different versions of Android that are concurrently active at any one time, adding another level of fragmentation. What this means is that developing apps that work across the whole range of Android devices can be extremely challenging and time-consuming.

Despite the problems, fragmentation also has a great number of benefits – for both developers and users. The availability of cheap Android phones (rarely running the most recent version) means that they have a much greater global reach than iOS, so app developers have a wider audience to build for. Android is successfully filling the gap left behind by the decline of Nokia’s Symbian – and in this report we look at the different shape of fragmentation in countries from different economic positions, as a way of showing that fragmentation benefits Android much more than it hurts it. Android is now the dominant mobile operating system and this is because of fragmentation, not in spite of it.

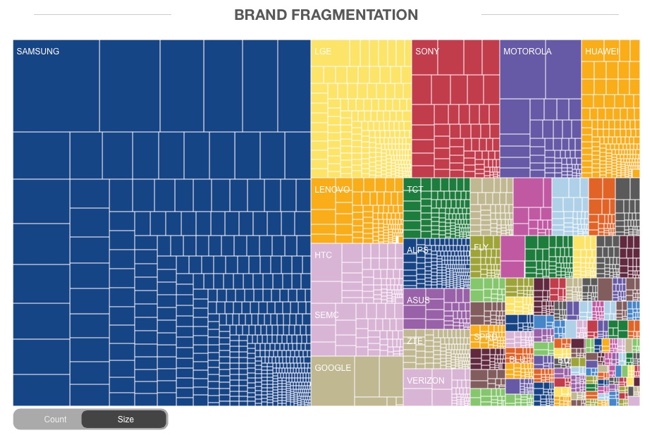
Here you can see the same treemap reorganized into brand clusters, still sized by market share:

Android Fragmentation Visualized

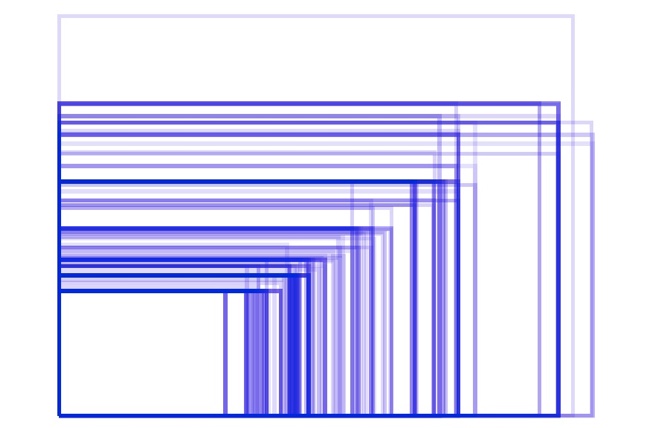
The hundreds of different Android screen sizes can be seen in this visualization:

In contrast, Apple currently only has FIVE devices and screen sizes for phone and tablets, but uses the same screen resolution on a couple of them:

Found on Business Insider

Wednesday
Jul292015

A History of Cell Phones and Cellphone Technology

A History of Cell Phones and Cellphone Technology infographic

Cellphone Technology has come a long way since the 80's. A History of Cell Phones and Cellphone Technology infographic from Lyca Mobile covers each generation of Cell Phones and adds some fun facts along the way. How many different generations have you owned?

This infographic covers the history of cell phones and cellphone technology from the 1st generation of cell phones in the 80’s to current high-speed 4G networks. 

There has been a lot of different cellphones since the 1980's; however, the infographic chose to separate the cellphones by broadband generations and then use just one easy to recognize cellphone from the time period. I also like how they stacked the uses for the cellphones. It was easy to recognize which features were new.

This design is purely informative. There's no call-to-action or asking the reader to do something with this information. However, they should have included the URL back to the infographic landing page so readers can find the full-size original design we people repost without the backlink to the Lyca website.

Thanks to David for sending in the link!

Thursday
Apr302015

Mobile Phone Size Evolution

Mobile Phone Size Evolution

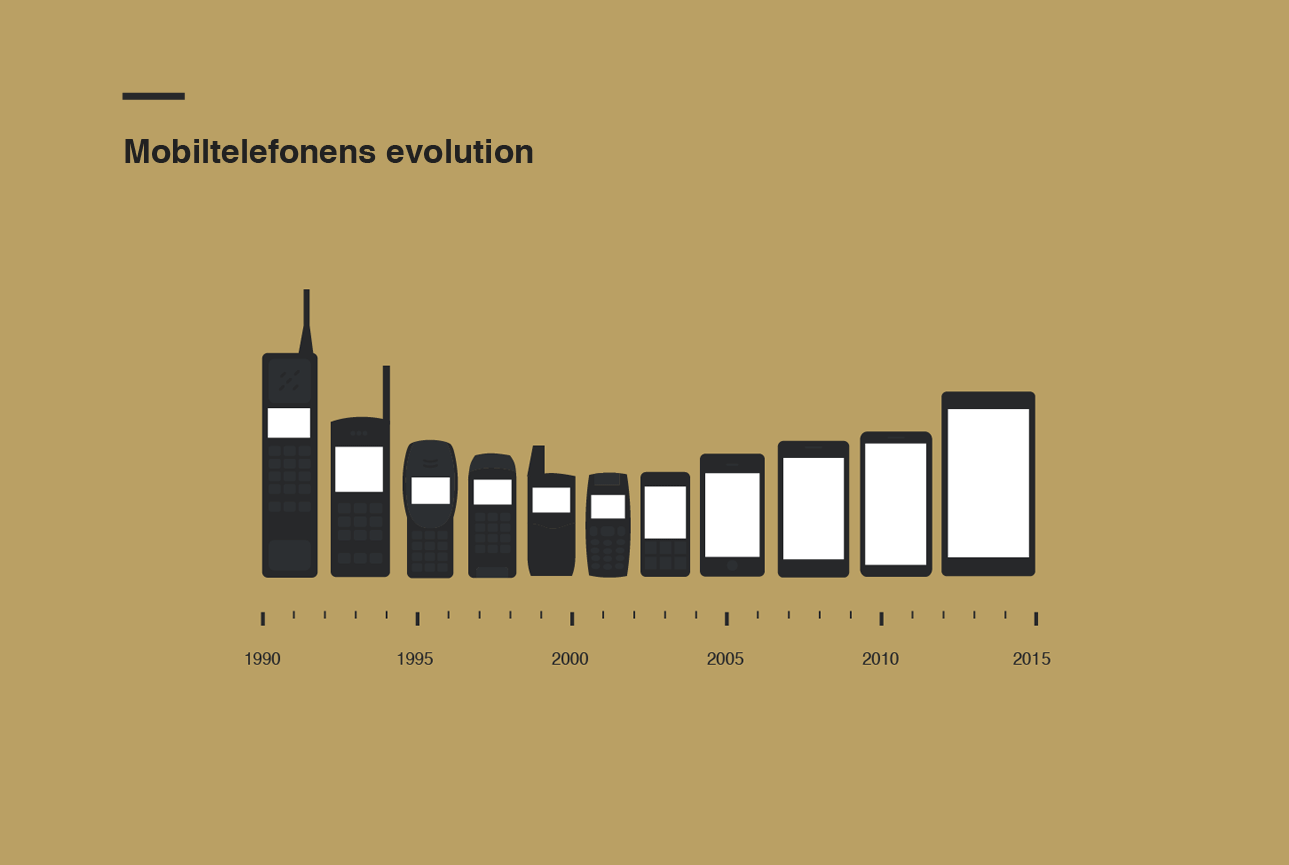
Great data visualization of the Evolution of Mobile Phone Sizes on the Future Trends page from 3 Danmark!

Simple, easy to understand.

Infographic and data visualization images are often shared without any links or accompanying text, so online images like this need to include some additional text with the source publishing and a URL in the image file itself.

Thursday
Aug292013

Consumer Attitudes to SMS Marketing and Texts Alerts

Consumer Attitudes to SMS Marketing and Texts Alerts infographic

The Consumer Attitudes to SMS Marketing and Texts Alerts infographic is the results of a survey done by Text Marketer. The survey was conducted to find out the consumers’ view on receiving text alerts from companies. 

The infographic is based on an exclusive survey of over 1,350 consumers in to their attitudes to SMS marketing. 

The results highlight that 84% of customers want to receive appointment reminders, 61% want order confirmations and 89% would like delivery notifications via text; showing there are a lot of ways to market through this channel that customers love. 

48% of consumers are also likely to respond to a text from a company they have previously purchased from. Consumers love special offers by text and like to be able to ask questions to companies via text messages.

Since the data is from their own survey research, there are no additional data sources cited.  The purpose of the first section is to establish the credibility of the data, but the total number of respondents alone isn’t enough.  Surveys like this target specific consumers, and use screener questions to target a specific portion of the population.  What type of consumers were surveyed for this report?

The visualizations of the data are clear, and the iPhone illustrations for the results of each question break apart the data nicely.  It’s a little hard for readers to understand that the lineup of iPhones is meant to add up to the total of 100% of respondents for each question.

The footer should include a copyright notice, and the URL back to the original infographic landing page so readers can find the full-size version if a link is not available.  A link to the source data would increase the credibility of the data too.  Instead, the landing page has a link to the home page of Text Marketer as the data source link, which means public access to the numeric data is not available.

Thanks to Mike for sending in the link!

Monday
Jun242013

Is Social Media Bad For Your Phone?

Is Social Media Bad for Your Phone? infographic

Is Social Media Bad For Your Phone? infographic from liGo gives us the price of being connected to social media on our phone.  Social media drains our phone, increases the number of car accidents, wears us down emotionaly, and has taken away some of our privacy.  You can stop the drain with a few of the infographic’s tips.

If you have a smartphone, then the chances are you’ve used social media on your mobile at one point or another. It’s great to be connected all the time, but what are the negative effects of social media on your mobile? We’ve developed an infographic to find out the answer…

Great design, with an unusual take on Social Media.

The doughnut charts are a little hard for readers to understand because they don’t start at one of the standard right angles (0, 90, 180 or 270 degrees).  By starting the segments at an odd location, it’s harder for the readers to understand how much of the permimeter is colored.

There should be the URL at the bottom that takes readers to the original full-size infographic.

Found on Infographic Journal

Monday
Nov262012

What Makes a Travel Writer?

What Makes a Travel Writer? infographic

For those who would love to travel and write, the What Makes a Travel Writer? infographic from hotelclub.com is the infographic for you. This infographic covers the ages and careers of these writers, and also what technology they use.

If you’ve ever wanted to become a travel writer, you’ve probably wondered about the tools and resources the pros use to make their jobs possible. The trade secrets of those who successfully turn international adventures into paychecks are an enticing mystery. Does the key lie in social networking? Is it finding the right technology that makes all the difference? Or have these professionals stumbled onto some obscure websites that the rest of us are ignorant about?

Unfortunately, there isn’t one explicit answer that will transform you into a travel writer overnight. It is a combination of all of these things that enable the professionals to do their jobs well enough to afford a warm meal and their next plane ticket.

So to gain some insight into the tricks of the trade, and hopefully get you one step closer to your dream job, we surveyed some of the best travel writers on the web about their working habits. We got the scoop on Twitter from three of the most ‘Followed’ travel tweeters in the business (@Paul_Steele@TravelEditor, and @DaveDTC); found out that Paris and NYC are two of the best places in the world to find (marketable) inspiration; and were warned against going any where near Birmingham or Malaga.

Find out what else we learned in our detailed infographic.

I really like this design.  I like that the infographic keeps the same, simple color scheme throughout to match the colors in the header. However, it lacks a border or a background color to help frame the infographic on a webpage with a white background.  The white background creates uncertainty of where it actually ends.

Most of the information is in percentages; however, it is all conveyed in different visual formats.  The stacked bars, pie charts and doughnut graphs correctly show them in comparison to the complete 100%.  The partially shaded shaped of film canisters, people icons and the world map aren’t quite correct.  The readers see the area colored of an object, and because of the odd shapes the designer had to guess the correct shading by just changing the height.  It’s close, but not actually correct.

A few other suggestions I would make:

  • The two age groups compared with the man & woman icons aren’t related to each other, so the comparison isn’t helpful information.
  • For the Male-Female comparison comparison in Travel Career, the icons need to be the same width for them the be accurate.  Visually it looks like 75% is at least double 53%, which obviously isn’t true.
  • The Tablet Brands statistics of “100% of male travelers use Amazon Kindle” isn’t support by the data to the left, and is a highly unbelievable stat.  
  • When lining up rows of icons, like in Blogging Platforms, the design should always use rows of 10 icons.
  • I’m sure the last circle in the Twitter Usage section was supposed to be <100 Twitter followers instead of >100.
  • There should be a URL at the end of the infographic linking to the original full-size version.

Thanks to Ally for sending in the link!

Tuesday
Sep182012

How Does A Touchscreen Phone Work?

How Does A Touchscreen Phone Work? infographic

This is the reason why your iPhone won’t work with gloves but your Samsung U600 will! The How Does A Touchscreen Phone Work? infographic from mycricket.com compares phones with the three different types of touch screens. 

Ever wonder why some touch screen phones cost more than others? Or why you can’t seem to get the touch screen on your smartphone to work if you’re wearing a glove? Most people don’t know that there are three different types of touch screen technologies available: resistive, capacitive, and infrared. Learn about the different benefits and capabilities to make sure you get the touch screen phone you’re looking for.

This is a really good comparison infographic design.  Each feature is clearly illustrated for the reader, the text descriptions are minimal and it’s very easy to read top-to-bottom.

I had trouble finding the original because the URL link to the original landing page was not included at the bottom of the design (always include the URL!), and there should be some type of copyright or Creative Common license.  Not really a problem, but I’m surprised the design doesn’t include any mention of the Cricket Wireless brand or logo.

Thanks to Sam for sending in the link!

Monday
Aug132012

Cellular Jerks: Where are your Mobile Manners?

Cellular Jerks infographic

So how in tune are you with your technology? Do you take calls on the toilet? Do you sleep with your phone on your bed? See what percent of the U.S. you fall into with the Cellular Jerks infographic from onlinecollege.org.

If you’re considering the pursuit on an online education, chances are you’re pretty plugged into the Internet and technology world.  Modern students everywhere are increasingly engaged with their tech devices, and with the rapid rise of mobile Internet access, many are even able to gain access to the materials and resources they need to study on the go.

 But this easy access might very well be both a blessing and a curse: The rise of mobile access has given rise to savvy, plugged-in individuals, but it may very well also have given rise to another being entirely, namely, the cellphone jerk.  Everyone seems to know someone or interact with a person who just doesn’t seem to have any mobile manners.  From loud conversations at inappropriate times to rude texting at an awkward moment, it seems like more and more people are getting lost in their own cell phone interactions. So attached are people to their cell phones that sometimes, those little devices end up in some interesting places.

 Don’t feel like you’re that addicted?  Check out the following infographic and see for yourself: You might be surprised to realize that you could be a cellular jerk, too.

I like this one because of the fun use of illustration to make the statistics more personal and can relate them to our everyday lives.

Many of the statistics are just shown in text instead of visualized, and most designers don’t understand that by not visualizing those values, it makes them visually “less important” to the readers.  This is especially true the further down the infographic you get, which also implies the project was rushed or the designer got lazy deeper into the design.

The clear Creative Commons license in the infographic is fantastic.  The URL directly to the original infographic landing page should have also been included.

Found on Online College.org 

Monday
Apr112011

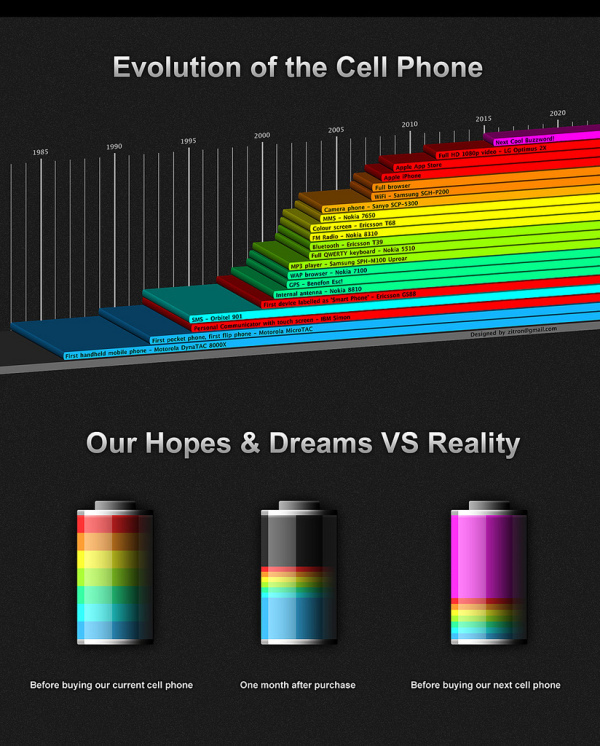
Evolution of the Cell Phone #infographic

A cool infographic design, the Evolution of the Cell Phone by Zitron takes a light-hearted look at the timeline of phone features and the phones that first had each feature.  The second part of the infographic, Our Hopes and Dreams, takes a humorous stab at how the reality of our cell phones rarely lives up to our expectations (until the next Buzzword comes along!).