About
Randy Krum
President of InfoNewt.
Data Visualization and Infographic Design

Infographic Design

Infographics Design | Presentations
Consulting | Data Visualizations

DFW DataViz Meetup

Join the DFW Data Visualization and Infographics Meetup Group if you're in the Dallas/Fort Worth area!

Search the Cool Infographics site

Custom Search

Subscriptions:


Feedburner

The Cool Infographics® Gallery:

How to add the
Cool Infographics button to your:

Cool Infographics iOS icon

- iPhone
- iPad
- iPod Touch


Read on Flipboard for iPad and iPhone

Featured in the Tech & Science category

Flipboard icon

Twitter Feed
From the Bookstore

Caffeine Poster

The Caffeine Poster infographic

Entries in space (46)

Monday
Aug212017

Eclipse: What You Need To Know

Eclipse: What You Need To Know infographic

What are your plans to view the eclipse today? The Eclipse: What You Need To Know infographic from Forbes contributor and designer Kevin Anderton.

On August the 21st 2017, there will be a solar eclipse in the sky over the United States. If you are like me, you are planning on enjoying this amazing site and you have probably also heard that there is some danger in viewing it. Here is some information that will help you safely enjoy the eclipse next Monday.


Monday
Jul242017

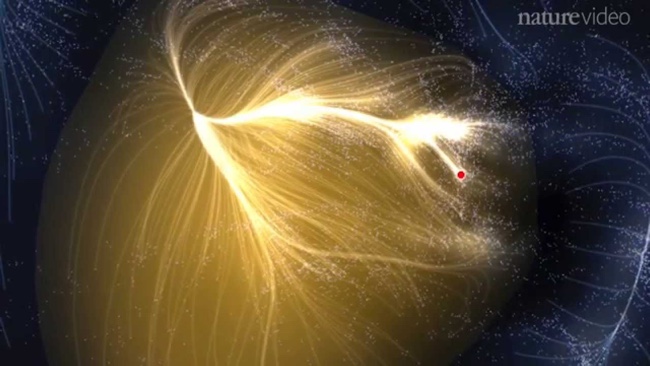
Laniakea: Visualizing Our Home Supercluster

Very cool new visualization of Laniakea: Our Home Supercluster, which is the supercluster of galaxies that includes the Milky Way. Check out the video and article from Nature.com.

This is potentially the most detailed map of the universe to date, and spans more than 500 million light-years and contains more than 100,000 galaxies. The lines shown in the visualization the paths of motion of the individual galaxies.


Tuesday
Jul112017

Fictional Travel Times Compared

Fictional Travel Times Compared Infographic

The Fictional Travel Times infographic from TravelMath compares the speeds from many fictional characters and vehicles from comics, TV and movies.

The universe is a big place – being faster than a speeding bullet is a crawling pace when it comes to interplanetary travel. Science fiction authors have needed to bend the laws of physics to create engines that are capable of going faster than light in order to complete these journeys in any reasonable amount of time. For this reason, there are a handful of superheroes who can travel faster than light, and in some cases, back in time.

See how your favorite superheroes and ships stacked up below, and read our methodology at the end to learn more about the science behind these fictional travel times.

What's your opinion on using Log scales in infographics?

Personally, I don't think enough people are data visualizaiton literate enough to visually understand log scales. Many readers will not understand why the bars don't seem to match the numbers, or won't read the numbers and assume the length of the bars is linear.

Thoughts?

Found on CBR.com

Tuesday
May022017

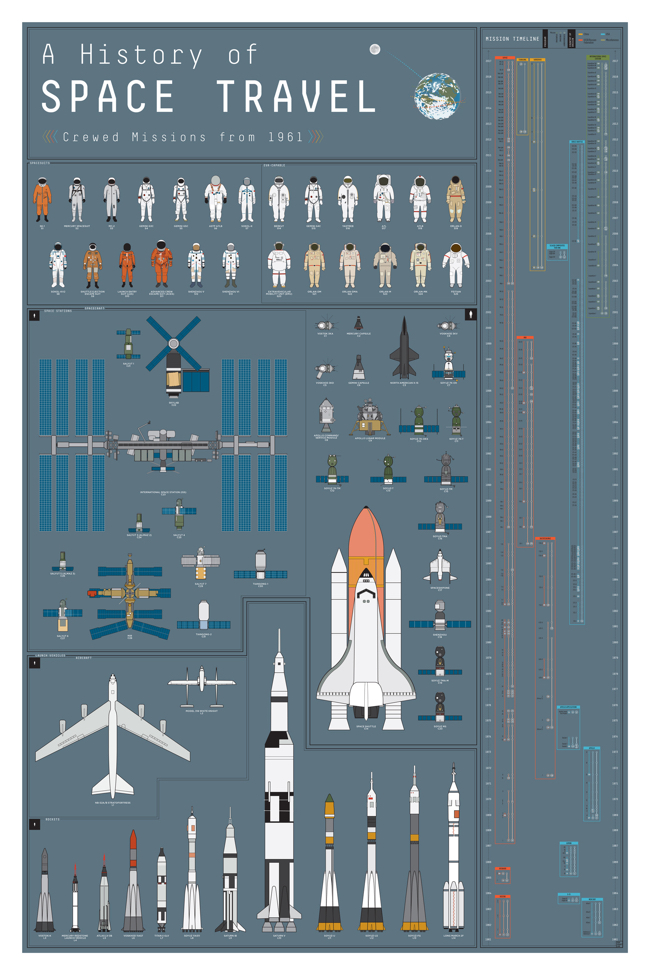
A History of Space Travel infographic poster

A History of Space Travel is a new infographic poster from Pop Chart Lab that covers the spacecraft, launch vehicles, space suits and mission timelines from countries all over Earth. Prints of this 24"x36" poster are available for $35 unframed, or more for framed options.

Make some space on your wall for our second infographic foray into the final frontier! This timeline of crewed space missions maps out over 400 extraterrestrial expeditions, spanning 1961 to present day. From the inaugural space race of Vostok vs. Mercury to the famed Apollo program to the International Space Station, this giant leap of a chart features stellar annotations for each mission, including full-color illustrations of all spacesuits and spacecraft. A simply stunning celestial survey, this chronicling of cosmic voyages is sure to have starry-eyed enthusiasts totally over the moon.

Tuesday
Oct272015

Asteroid ‘Spooky’ Will Flyby Earth on Halloween

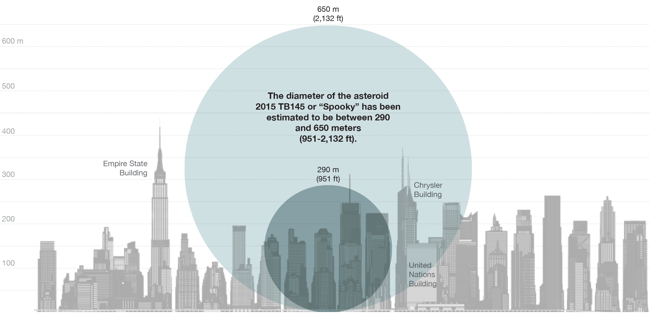
National Geographic has published a great data visualization that compares the estimated size of the asteroid "Spooky" discovered only a few weeks ago with the well-known skyscrapers in New York City, Asteroid Called ‘Spooky’ Will Buzz Earth on Halloween

Astronomers from NASA's Near Earth Object Program first spotted the incoming asteroid on October 10, just three weeks before its closest approach. It was too small and faint to detect until it came within the range of large survey telescopes.

Nicknamed Spooky, the asteroid (officially called 2015 TB145) is estimated to be about 950 to 2,100 feet wide (290 to 650 meters). Scientists won't be sure of its exact size until they can do radar measurements—and the most accurate will be on Halloween, when it passes the closest.

This is a perfect way to use data visualization to put the information into perspective for the audience. It would be nice to have more of the building identified.

Wednesday
May132015

The Slow Speed of Light

Riding Light from Alphonse Swinehart on Vimeo.


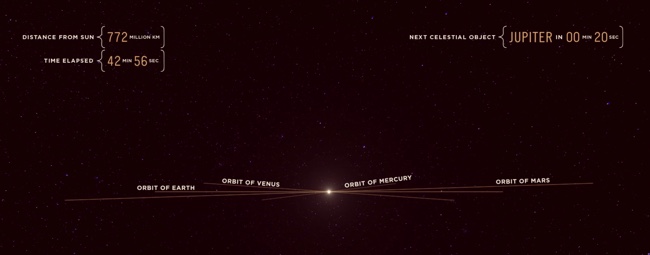
We think of the speed of light as incredibly fast, but in the video Riding Light, by Alphonse Swinehart, we ride along with light as it starts in our Sun and moves out past Jupiter in our solar system. The video is 45 minutes long and helps show both how large our solar system is, and that it still takes light a long time to travel these large distances.

In our terrestrial view of things, the speed of light seems incredibly fast. But as soon as you view it against the vast distances of the universe, it's unfortunately very slow. This animation illustrates, in realtime, the journey of a photon of light emitted from the surface of the sun and traveling across a portion of the solar system, from a human perspective.

I've taken liberties with certain things like the alignment of planets and asteroids, as well as ignoring the laws of relativity concerning what a photon actually "sees" or how time is experienced at the speed of light, but overall I've kept the size and distances of all the objects as accurate as possible. I also decided to end the animation just past Jupiter as I wanted to keep the running length below an hour.

During the course of the video, I also love the data visualziations shown during the flight, like how large the orbits of different planets appear to us as we move outward.

Also available on YouTube:

Monday
Feb092015

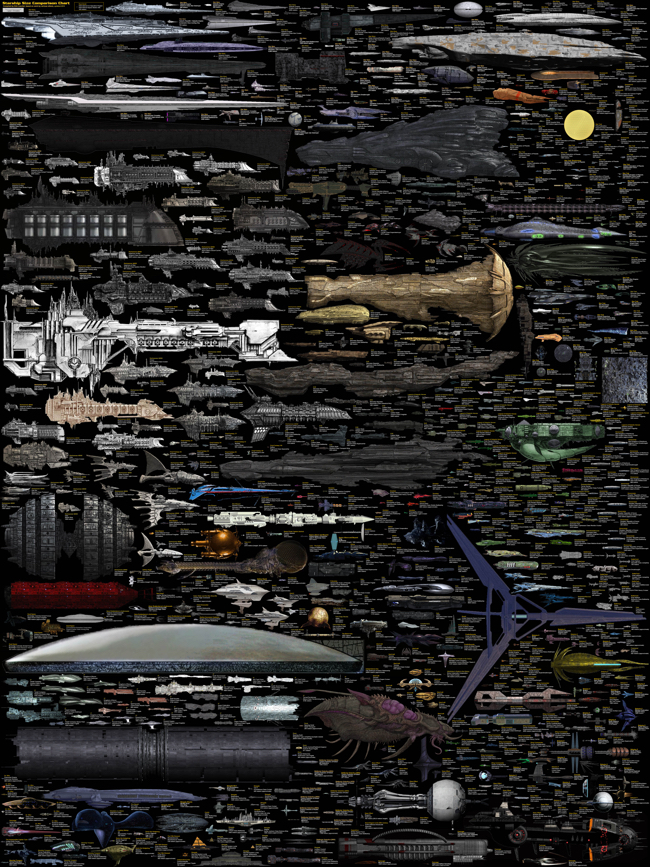
The Massive SciFi Starship Size Comparison Chart

The Final SciFi Starship Spaceship Size Comparison Chart infographic

The massive SciFi Starship Size Comparison Chart is one of my favorite infographic design projects. Designed by Dirk Loechel and shared on DeviantArt, this is a project he has been working on for years. I posted an earlier version of his design in 2013 here which was hugely popular. Dirk’s notes claim that this may be the last update.

The last update

For real this time: This is the final major content update, though if there are issues I’ll still fix them. I also haven’t forgotten I wanted to vectorize the writing. It’s still on the radar. But content-wise, I think that is about all I can put in. 

Also, I added the ISS. For scale. It’s on top, with a yellow frame so it’s relatively easy to find.

Lots of errors fixed, lots of new ships too. Well, off for now, but I’ll be replying in the comments more or less regularily. 

This is probably at least for the forseseeable future the last round of adding ships. I have pretty much all I wanted now (excepting some old scifi, and many Anime series, which tend to not have many usable images). Lots of new content.

And that’s it for now. Enjoy the new-and-improved chart! 

This is one of the visual designs that clearly demonstrates why visuals can be much more effective than text descriptions. Especially when it comes to comparing size and scale. You just don’t comprehend the scope when someone tells you that the Star Wars Executor Class Super Star Destroyer is 19,000 meters long. You have to see it in comparison to something you already know.

The images on DeviantArt are high enough in resolution, that you can download and print it out as a poster yourself to hang on your wall. The full-size poster resolution is 4,268 x 5,690 pixels. Most of the ships are clustered by franchise (Star Wars, Star Trek, Halo, Eve, Warhammer, etc.). As a reality check, the International Space Station (ISS) is included for reference.

Found on Geyser of Awesome, Nerd Approved and Nerdist

Wednesday
Oct152014

If the Moon Were Only 1 Pixel

If the Moon Were Only 1 Pixel infographic

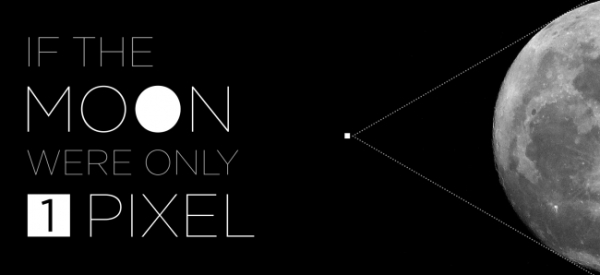
When we talk about outer space, we have a tendency to use comparisons that are not necessarily true, but still represent large distances. However, If the Moon Were 1 Pixel infographic created by Josh Worth uses pixels to accurately measure out the solar system. Explore the full interactive design here!

If the Moon Were Only 1 Pixel infographic

Picture from mic.com

I was talking about the planets with my 5-year-old daughter the other day. I was trying to explain how taking a summer vacation to Mars in the future will be a much bigger undertaking than a trip to Palm Springs (though equally as hot). I kept trying to describe the distance using metaphors like “if the earth was the size of a golf ball, then Mars would be across the soccer field” etc., but I realized I didn’t really know much about these distances, besides the fact that they were really large and hard to understand. Pictures in books, planetarium models, even telescopes are pretty misleading when it comes to judging just how big the universe can be. Are we doing ourselves a disservice by ignoring all the emptiness?

So I thought I would see if a computer screen could help make a map of a solar system that’s a bit more accurate (while teaching myself a few things about javascript, SVGs and viewports along the way).

Not that pixels are any better at representing scale than golfballs, but they’re our main way of interpreting most information these days, so why not the solar system?

I love this animated scale representation of the solar system. Just to fit on the same page, we usually see all of the planets close together in posters and text books. But in the long run, we lose grasp of how much empty space is truly around us.

Found on Mic.com

Friday
Sep272013

SciFi Starship Comparison Chart

SciFi Starship Comparison Chart infographic

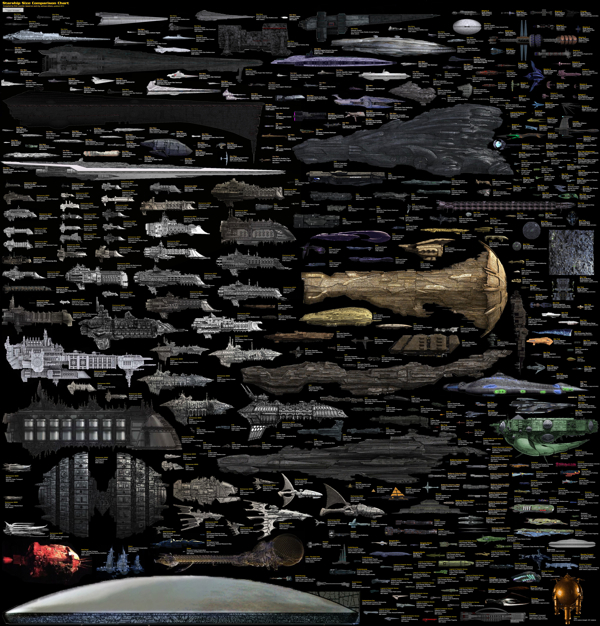
This is a massive Starship Size Comparison Chart, created by designer Dirk Loechel and posted on DeviantArt.

The design gathers ships from many different science fiction movies, tv shows and games, and sizes them down to a common scale so viewers can grasp the relative size of how large and small the ships they recognize are.

As this get shared heavily online, it would be nice to have the URL back to the original, full-size version included in the design.

I love this size comparison design!  The subtitle mentions that Dirk's design is "based on the work of others"  A much smaller Starship Size Comparison Chart was one of the first posts on Cool Infographics back in July of 2007, and that version is no longer available online.

Thanks to Mary Kaye for sending me the link!

Thursday
Jun272013

The Nearest Stars

The Nearest Stars infographic

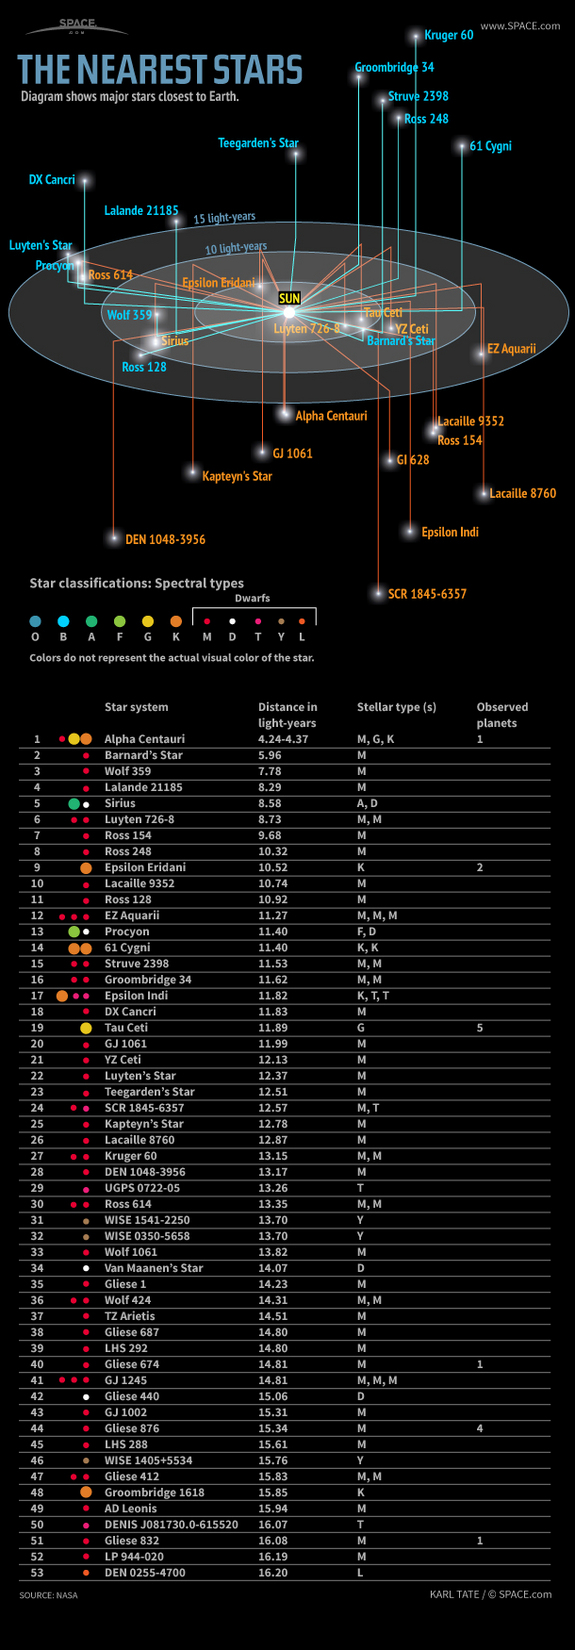
The Nearest Stars infographic from Space tracks the 53 closest stars to the earth. Their classification and distance is also included.

The nearest stars to Earth are in the Alpha Centauri triple-star system, about 4.37 light-years away. One of these stars, Proxima Centauri, is slightly closer, at 4.24 light-years.

Of all the stars closer than 15 light-years, only two are spectral type G, similar to our sun: Alpha Centauri A and Tau Ceti. The majority are M-type red dwarf stars.

Only nine of the stars in this area are bright enough to be seen by the naked human eye from Earth. These brightest stars include Alpha Centauri A and B, Sirius A, Epsilon Eridani, Procyon, 61 Cygni A and B, Epsilon Indi A and Tau Ceti.

Barnard’s Star, a red dwarf 5.96 light-years away, has the largest proper motion of any known star. This means that Barnard’s Star moves rapidly against the background of more distant stars, at a rate of 10.3 seconds of arc per Earth year.

Sirius A is the brightest star in Earth’s night sky, due to its intrinsic brightness and its proximity to us. Sirius B, a white dwarf star, is smaller than Earth but has a mass 98 percent that of our sun. 

In late 2012, astronomers discovered that Tau Ceti may host five planets including one within the star’s habitable zone. Tau Ceti is the nearest single G-type star like our sun (although the Alpha Centauri triple-star system also hosts a G-type star and is much closer).

The masses of Tau Ceti’s planets range from between two and six times the mass of Earth.

Great data from Space.com.  The infographic focuses on visualizing the distance of the stars from Earth. In that process, it caused some of the visual to be cluttered.  It’s always hard to convey 3D information on a 2D image.

From a data visualization standpoint, the lower table is unnecessary.  All of that information could have been conveyed in the star map illustration.  The color coding of the names in the map doesn’t match the color coding of the star classifications, and that’s confusing to readers.  It would have also helped to provide an explanation of why star systems can have multiple classifications.

If they wanted to keep the detailed table below, it should include more visual elements. The stellar types with the classification are redundant and can be combined.  The distances could have included bars to show the light years from Earth.  The number of observed planets could have used icons.

Found on Visual.ly