About
Randy Krum
President of InfoNewt.
Data Visualization and Infographic Design

Infographic Design

Infographics Design | Presentations
Consulting | Data Visualizations

DFW DataViz Meetup

Join the DFW Data Visualization and Infographics Meetup Group if you're in the Dallas/Fort Worth area!

Search the Cool Infographics site

Custom Search

Subscriptions:


Feedburner

The Cool Infographics® Gallery:

How to add the
Cool Infographics button to your:

Cool Infographics iOS icon

- iPhone
- iPad
- iPod Touch


Read on Flipboard for iPad and iPhone

Featured in the Tech & Science category

Flipboard icon

Twitter Feed
From the Bookstore

Caffeine Poster

The Caffeine Poster infographic

« EARTH, a visualization project | Main | Disney Live Action Movies: Best (And Worst) »
Monday
Jul242017

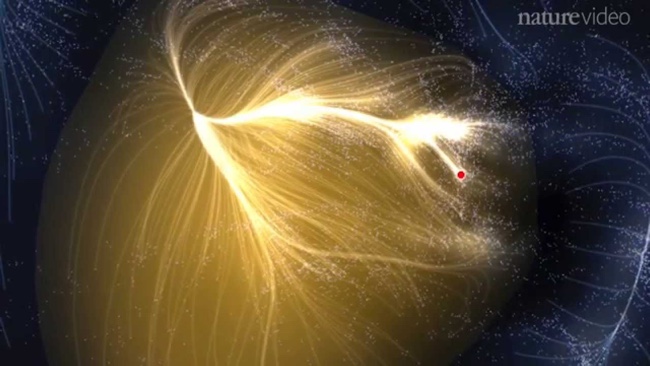
Laniakea: Visualizing Our Home Supercluster

Very cool new visualization of Laniakea: Our Home Supercluster, which is the supercluster of galaxies that includes the Milky Way. Check out the video and article from Nature.com.

This is potentially the most detailed map of the universe to date, and spans more than 500 million light-years and contains more than 100,000 galaxies. The lines shown in the visualization the paths of motion of the individual galaxies.


PrintView Printer Friendly Version

EmailEmail Article to Friend

Reader Comments

There are no comments for this journal entry. To create a new comment, use the form below.
Editor Permission Required
While we are migrating to a new site design, you must have editing permission for this entry in order to post comments.