About
Randy Krum
President of InfoNewt.
Data Visualization and Infographic Design

Infographic Design

Infographics Design | Presentations
Consulting | Data Visualizations

DFW DataViz Meetup

Join the DFW Data Visualization and Infographics Meetup Group if you're in the Dallas/Fort Worth area!

Search the Cool Infographics site

Custom Search

Subscriptions:


Feedburner

The Cool Infographics® Gallery:

How to add the
Cool Infographics button to your:

Cool Infographics iOS icon

- iPhone
- iPad
- iPod Touch


Read on Flipboard for iPad and iPhone

Featured in the Tech & Science category

Flipboard icon

Twitter Feed
From the Bookstore

Caffeine Poster

The Caffeine Poster infographic

Entries in personal (139)

Tuesday
May232017

How Do You Spend the Days of Your Life?

How the Average Working Adult Spends Days

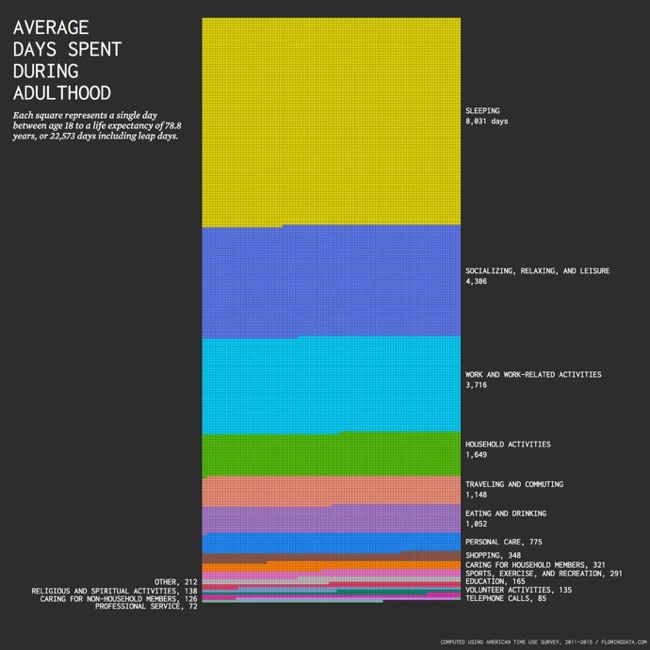
Nathan Yau from FlowingData has taken an in-depth look at the statistics behind How the Average Working Adult Spends Days in their lifetime.

There were some graphics going around that showed the total amount of time spent during an average person’s lifetime doing things. The numbers were pretty rough though.

For example, to calculate the number of days spent sleeping during a lifetime, it was assumed that the average person sleeps eight hours per day, and then estimates just extrapolated for life expectancy. But sleep patterns change as you age. You start to sleep less as you get older.

So I tried taking this into account using data from the American Time Use Survey. I still used averages, but I calculated averages for each year of life and then aggregated. Here’s what I got for adulthood (18 and older) — the time you’re presumably making your own choices. Employment and retirement are assumed.

Again, these are still averages for an adult who works and then retires around 65 years, so the same caveats apply as usual. Everyone’s own totals will be a bit different, especially as you compare across groups. For example, the time distribution for parents looks different from the distribution for those who never have kids. Similarly, some never enter the labor force whereas others work full-time.

The data is from the American Time Use Survey, which is made more easily available from IPUMS. After downloading data for 2011 through 2015, I tabulated and charted in R. Also, maybe you noticed that the number of squares doesn’t quite add up to 22,573. This is due to rounding, which offset the total above by three days.

I prefer data visualizations like this that show the actual number of days as squares (or other shapes/icons) instead of summarizing them together into a stacked bar chart or a doughnut chart. Seeing the full number of days represented gives the readfers a better understanding of the true magnitude of the values being shown

Found on Big Think

Friday
Feb172017

A Year of Driving 2016

A Year of Driving by Automatic infographic

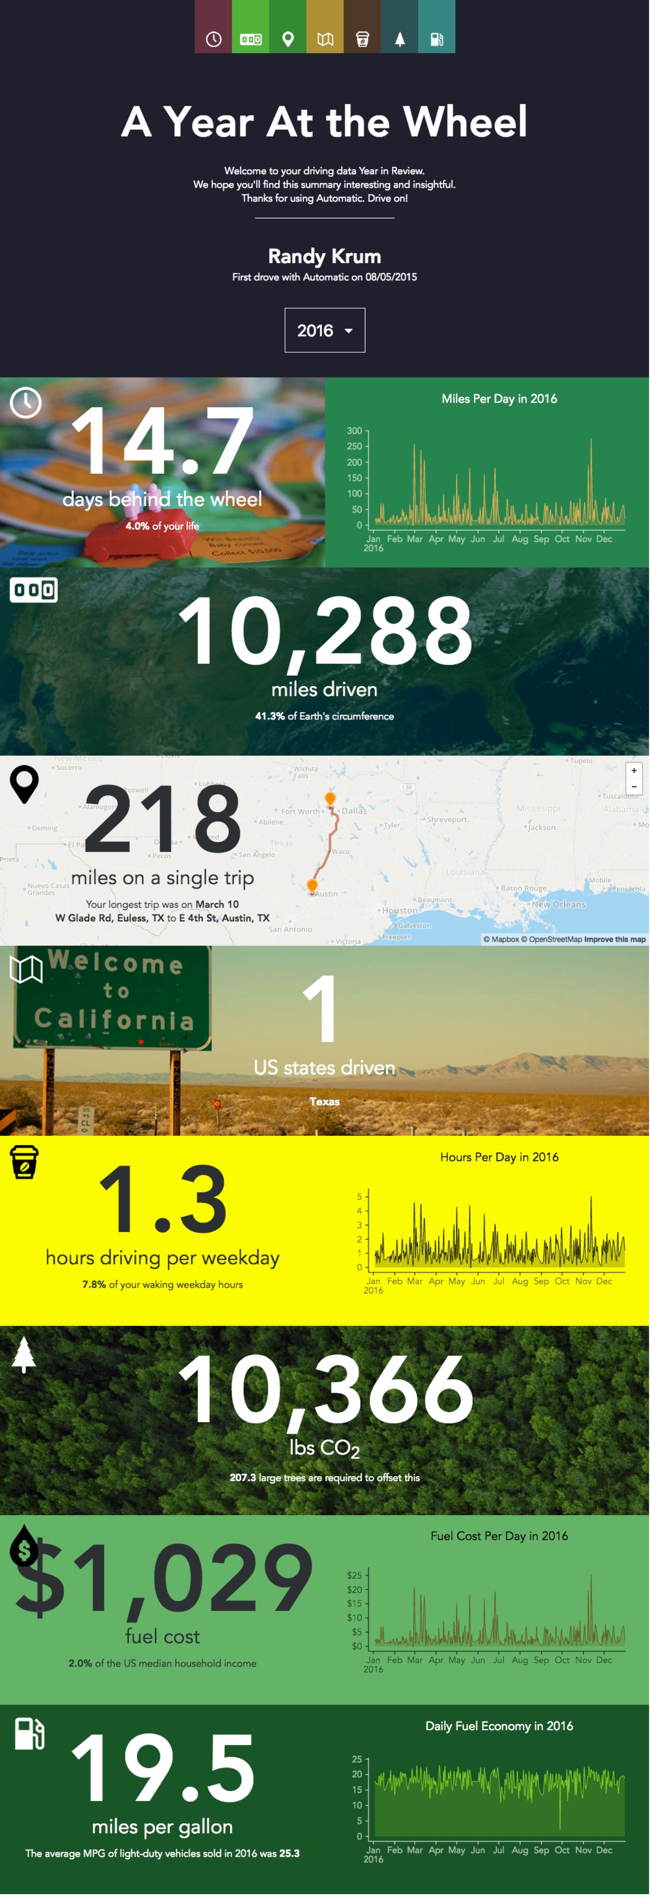
A Year At The Wheel. If you are an owner of an Automatic connected car adapter, they create a personalized infographic with your own custom data.

A number of companies have started creating personalized data visualizations and infographic for their customers, which is a trend that I really like. As part of Automatic Labs, the Year In Review graphics give you insights into your own personal driving history data that you couldn't see anywhere else. One of many ways they are experimenting making your personal big data useful.

Big fonts are not data visualizations! My biggest critique is that there are sections that just show the data value in a big font. They were too lazy to create visualizations for the comparisons. For example, they took the time to calculate that 10,366 lbs of CO2 would require 207 large trees to offset, but a visual of 207 tree icons would be way more impactful!

Friday
Jan062017

Does Coffee Really Make You More Productive at Work?

Does Coffee Really Make You More Productive at Work? infographic

63% of Americans can't get through the work day without coffee. Does Coffee Really Make You More Productive at Work? infographic explores our cultural obsession with coffee. Turns out that coffee boosts your speed, not your talent so tasks that require quality over quantity do not benefit from caffeine. Toll Free Forwarding tells us how and when to drink coffee for it to be most effective. 

Could you start the day without your morning cup of coffee?   Latest research shows that 61% of Americans can’t get through the day without a cup of java, and even that’s 2% down from 2013.   Let’s face it, ever since the Europeans discovered coffee in the 1600s, it’s been an infatuation of the western world.  This magic brew that makes you vibrant and productive isn’t just an addictive substance, it’s a cultural phenomenon.  

Coffee shops are often credited as the birthplace of the Enlightenment, the American and French Revolutions, and even the Shins!   But what role does coffee have in the workplace?  Does it actually make us more productive or is it mankind’s most effective placebo? This infographic goes in-depth to explain just how coffee affects our daily routine, and how we can nurture our caffeine fixes without over-doing it.   So sit back with your bagel and morning brew, and enjoy the only Infographic that dares to ask: “Does Coffee Really Make You More Productive at Work?”

There's a lot of good information in this design, and it's organized nicely in sequence from top-to-bottom. Most of the information is visualized with good, related illustrations or icons.

It's odd that this infographic comes from Toll Free Forwarding, a company whose business has nothing to do with coffee. This is a challenge for relevance in the SEO world, and if this infographic becomes popular, it still may not have a significant benefit to the publisher because it will be promoting keywords unrelated to their business.

Thanks to Jennie for sending in the link!

Thursday
Nov172016

Men's Hats - The Complete Guide

Men's Hats - The Complete Guide infographic

Can't find a hat that looks good on you or don't even know where to start? Samuel Windsor created the Men's Hats - The Complete Guide infographic to clear the confusion on the matter. Feel confident enough to talk the talk at a hat shop, as well as pick the right style for your face shape.

Hats give a man distinction, confidence and protection. This diagrammatic guide will help you find the perfect hat to top your appearance. Confused about what crown to request? Will a flat cap suit a square face? Do you know your bowlers from your boaters?

Nice clean design that does a great job of "show, don't tell". You understand the differences much faster with a visual design like this.

This is also a good design example of a Long Online Lifespan. Hat shapes, styles and face shapes don't change every year. This infographic will be popular and relevant for years to come.

Two things missing from the footer of the design:

  • URL to the origial landing page and website. How can readers find your website?
  • A copyright or Creative Commons license

Thanks to Matt for sending in the link!

Thursday
Jun092016

The U.S. Baby Bust

The U.S. Baby Bust fertility rate

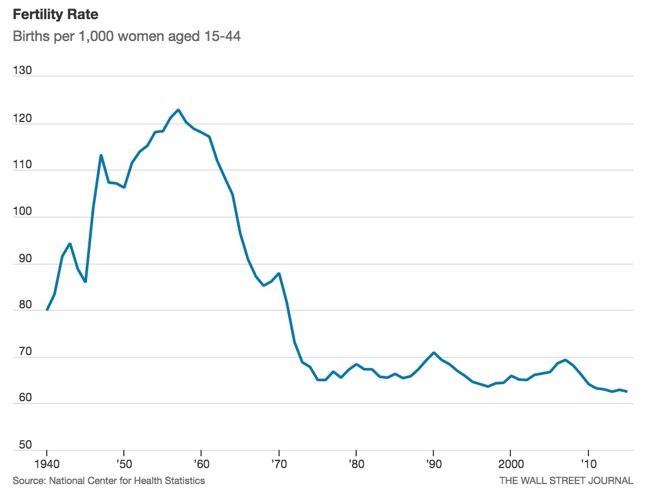
The U.S. Baby Bust is shown in 5 line charts by the Wall Street Journal. Sometimes a clean & simple line chart is the best way to show your data.

The general fertility rate fell in 2015 to tie the lowest level on record. Fertility, defined as the number of live births per 1,000 women ages 15-44, has never been lower than the rate recorded last year and in 2013.

It’s no surprise that Americans are having fewer babies than in the years after World War II, when there was an incredible baby boom. And it’s of course well known that people generally have smaller families today than in the past. Add the severe economic recession that began in 2007 to the picture, and you have the elements to push the birth rate to record lows.


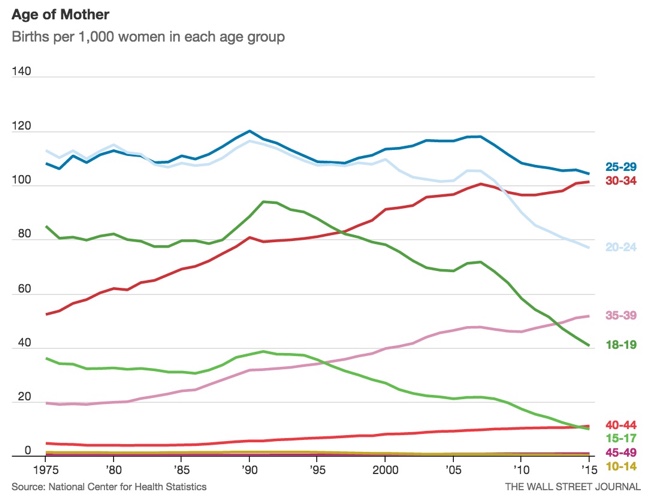
The U.S. Baby Bust age groups of mothers

In this second chart showing the various age groups, the rainbow of colors is a little distracting. One way to tell a specific story with this chart would be to only color the lines that have increased over time, and make the rest shades of gray. That would tell the story that the women in their 30's are the dominant growth age groups.

A separate chart highlighting the lines for teens and 20's would better tell the story of women putting off having children until they are older.

Go check out the WSJ article for the other observations they made from the data.

Monday
May232016

Dogs Hate Hugs

Dogs Hate Hugs infographic

The Dogs Hate Hugs infographic from Pet Insurance U reveals the surprising fact that dogs really don't like being hugged.

This infographic shows humans why, in spite of this whole hugging fiasco, dogs are still your best friends. Do dogs hate hugs? Researchers studied pictures of humans hugging dogs, and 81.6% of the dogs showed visible signs of distress, discomfort, stress or anxiety.

Designed by NowSourcing, this is a good example of an infographic highlighting an insight that is probably surprising to the audience. Infographics should share some insight or knowledge learned from data research that will actually teach the readers something new.

I have one major issue with the way they visualized their data. The statistic of "Oxytocin levels rise by 57.2% when dogs play with their owners" is visualized with a non-zero baseline, making the increase in the bar chart appear to by a 10x difference. This visualization is extremely misleading. Don't adjust the scale of the y-axis to over-emphasize a change in the data!

Thanks to Brian for sending in the link!

Tuesday
May102016

What's Your Ideal Workplace?

What's Your Ideal Workplace? infographic

Based on your own individual personality, the What's Your Ideal Workplace? infographic from Quill.com examines the best types of office environments to maximize your work performance.

Are you looking for a new position in a more fitting workplace? Or are you attempting to create an office setup that will maximize your employees’ skills? This infographic will help you match common work personality types with their ideal office spaces, from cubicles and open workspaces to co-working and work from home options.

Don’t know your work personality? Take the test.

Many companies are just beginning to realize that workplace design directly impacts employee performance, yet research shows that 3 in 4 U.S. workers are not in optimal workplace environments.

I love the connection to taking your own work personality test. This makes the infographic design personal and relevant to each individual reader. It's informative, but personal.

The illustration of each different workplace layout helps readers understand the differences almost instantly. It's a design with conceptual illustrations, but the statistics are also visualized, making them easier to understand as well. The personality color-coding is consistent throughout the design.

Great layout on the infographic landing page as well. Descriptive text with links, social sharing buttons, the full infographic and embed code at the bottom. The URL of the landing page is also included in the infographic image file itself, to make it easy to find the original, full-size version from sites that share but don't link. Everything needed to make it easy to find and easy to share.

Thanks to Cheryl for sharing the link!

Wednesday
Feb032016

Men's Dress Codes Made Simple

Men's Dress Codes Made Simple infographic

Men's Dress Codes Made Simple from Samuel Windsor will answer your questions about men's attire for any function.

Want to look the business? This visual guide to men’s dress codes helps you guarantee an impeccable appearance at any function.

Why can’t you wear a watch with white tie? Is a pinstripe suit or blazer best for business? Are brogues or Oxford shoes most suited to smart casual?

Our infographic below solves these and other dress code conundrums in seconds.

Simple use of illustrations to help make a dry topic significantly more engaging for readers. Infographics don't always need big, numerical datasets to be able to visualize information.

Thanks to Jenny for sending in the link!

Thursday
Oct082015

10 Ways to Fall Asleep on a Plane

10 Ways to Fall Asleep on a Plane infographic

Traveling can be exhausting, especially when you can't catch any sleep on the flight. However, Work the World has come up with not just one, but 10 Ways to Fall Asleep on a Plane! Whether you are traveling for business or for pleasure, you can be assured that your flight will be a restful one.

Trying to fall asleep on a plane can be one of the most frustrating experiences during your travels. After some serious research we decided to put an infographic together detailing the top ten ways to fall asleep on a plane. If you struggle to fall asleep in the air, read on for reassurance that it can be done.

Great informative infographic that uses a classic content marketing strategy of a Top 10 list, even if it's a little text heavy for a graphic. Icons and illustrations make each idea visual, which will help readers remember the information when they actually need it.

The footer properly included a Creative Common license, and detailed sources. The only thing missing is the URL to the infographic landing page so readers can find the original, full-size version on the Work The World site.

There's so much text in this one, I would make the additional recommendation to repeat the text on the infographic landing page below the infographic image itself. By also putting all of the text on the page, the search engines will be able to parse and index all of this good text data.

Found on Visual.ly

Monday
Jul272015

Robert Scoble's 22 Tips for Improving Your Facebook Feed

Robert Scoble's 22 Tips for Improving Your Facebook Feed infographic

Robert Scoble's 22 Tips for Improving Your Facebook Feed infographic from Joel Comm is a great summary of making your own Facebook feed useful. We all lead busy lives, but sometimes it's worth stepping back and making sure your tools are working for you the best way they can.

A few weeks ago, Robert Scoble published 22 tips for making your facebook feed better. It was some of the best, time-tested content I had read on the subject. I was so impressed that I created an infographic in order to spread his tips. With Scoble's permission, here are his 22 tips. Be sure to go to his page and show him some love! And, of course, would love for you to share this with others.

This is essentially a list infographic that includes some icons to add visual content. I'm generally opposed to a lot of text in an infographic design, but the content here is so valuable that the descriptions are necessary in the design. Sharing as an infographic image file, also makes the content easier to share online.

The footer should include the link to the infographic landing page so readers can easily find the original, full-size version when people repost the infographic without a backlink to the original.