About
Randy Krum
President of InfoNewt.
Data Visualization and Infographic Design

Infographic Design

Infographics Design | Presentations
Consulting | Data Visualizations

DFW DataViz Meetup

Join the DFW Data Visualization and Infographics Meetup Group if you're in the Dallas/Fort Worth area!

Search the Cool Infographics site

Custom Search

Subscriptions:


Feedburner

The Cool Infographics® Gallery:

How to add the
Cool Infographics button to your:

Cool Infographics iOS icon

- iPhone
- iPad
- iPod Touch


Read on Flipboard for iPad and iPhone

Featured in the Tech & Science category

Flipboard icon

Twitter Feed
From the Bookstore

Caffeine Poster

The Caffeine Poster infographic

Entries in Calendar (10)

Thursday
Jan112018

Abita Beer Release Calendar 2018

Abita Beer Release Calendar 2018

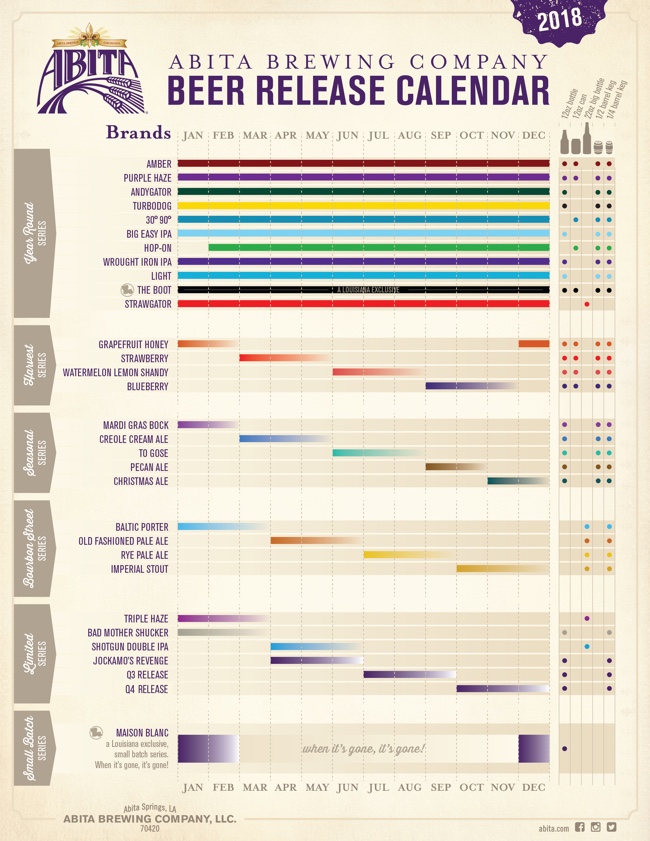
In case you're not familiar with Abita Beers, it's a fantastic brewery out of Louisiana. In addition to a core set of beers, they make a number of seasonal brews that are only available certain times of the year. This visual Beer Release Calendar is your visual guide to when you favorite brews are in season!

The new year is here and we're looking forward to another great year of brews! We've been hard at work behind the scenes planning for 2018 and wanted to share some of what we've been working on. Our 2018 Beer Release Calendar is everything we'll be releasing and boiled down to one single sheet. It's our brew bible! Of course, most of your favorites are back, but as you'll see we're bringing some beers you might recognize out of retirement and releasing a ton of new beers. In all, we'll brew and package 31 beers in 2018 and that's not counting the tons of beers we'll be experimenting with and releasing on our pilot system here at the brewery.

I really like this design. The colors come from the individual beer labels, and I appreciate the additional visualization of the available sizes. I appreciate the repeated guide to the monthly column at the bottom. The cursive font, rotated 90° is hard to read.

The gradient bars are a nice touch since those brews don't have a hard end date, they're only available until supply runs out. It looks like the designer accidentally left a few of those as gradient to white instead of gradient to the background tan color.

Thursday
Aug112016

Predicting iPhone Release Date With DataViz

Predicting iPhone Release Date With DataViz

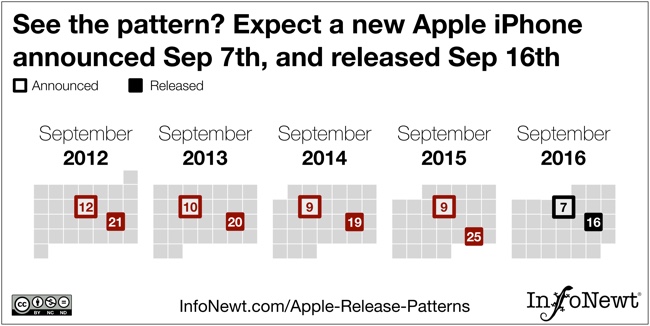
With no inside knowledge, I predict the new Apple iPhone announcement on September 7th, with an actual release on the Friday of the following week, on September 16th.

How do I know this? I fully expect Apple to stay true to their pattern for releasing iPhones every September. They have consistently had an announcement on a Tuesday or Wednesday early in September, followed by the actual release on the following Friday. (I think 2015 was an anomaly with an extra week before shipments)

We humans are still the best visual pattern recognition machines on the planet. Visual patterns are also one of the best ways to communicate an insight or a finding from within the data. In this visual, I've visualized just the important dates that show a clear pattern, and simplified the design to just the relevant information. You don't need the whole calendar or all of Apple's products to communicate this one insight about iPhones.

Check out all of my visualization of all of Apple's Release Patterns!

Friday
Jun062014

When Are Fruits and Vegetables in Season?

When Are Vegetables in Season? infographic

If your are an avid gardener or just prefer to know when your favorite fruits are in season, these two infographics will make your tastebuds happy with the When Are Fruits in Season? and When Are Vegetables in Season? infographics created by Greek Body Codex.

Ever wondered why sometimes your veggies taste fresh and full of flavor where other times it tastes dull and old? Some vegetables are seasonal and either don’t grow at all during certain months or don’t do well during certain times of the year. This infographic will show you when all of your favorite vegetables are in season and when they’ll taste the absolute best.

Both are good designs with a clear message.  Plotting out the calendar months in doughnut chart works nicely, and the bright colors make the overall design very visually appealing.

Thanks to Tom for sending in the link!

When Are Fruits and Vegetables in Season? infographic


Friday
Nov082013

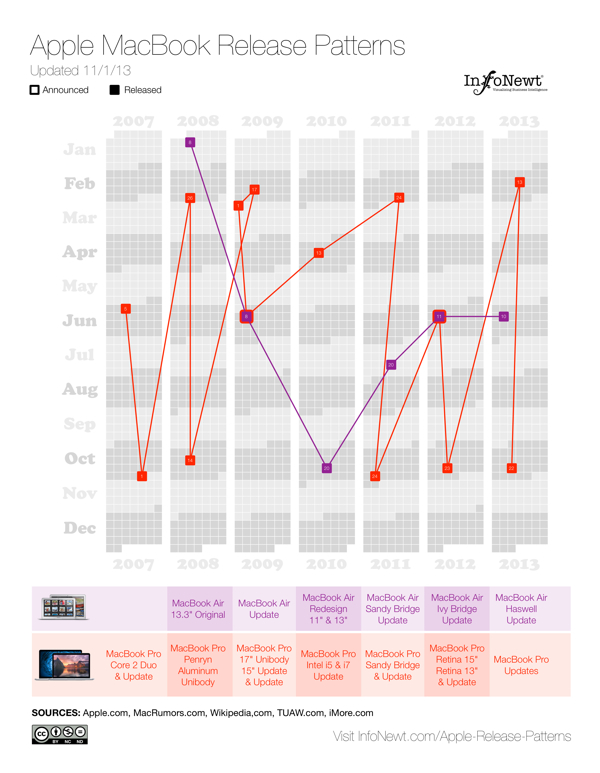
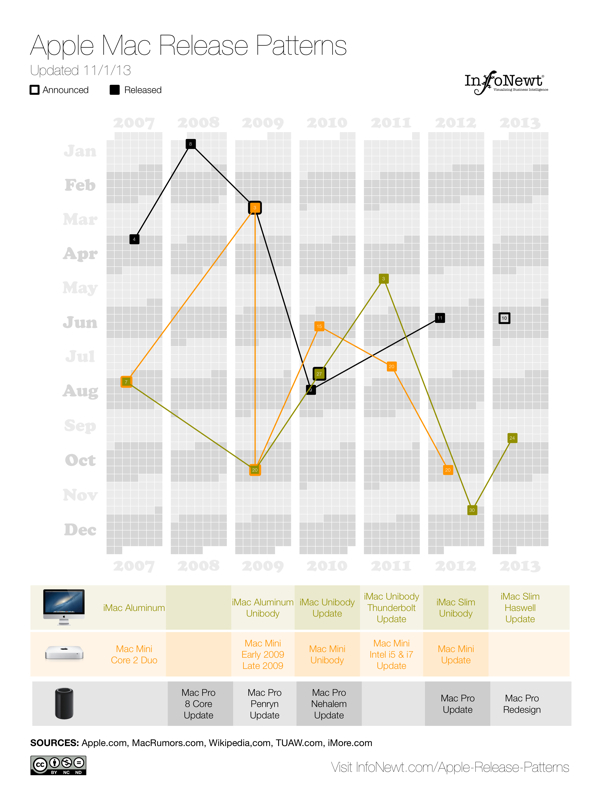
Apple Release Patterns

Apple Total Release Patterns infographic

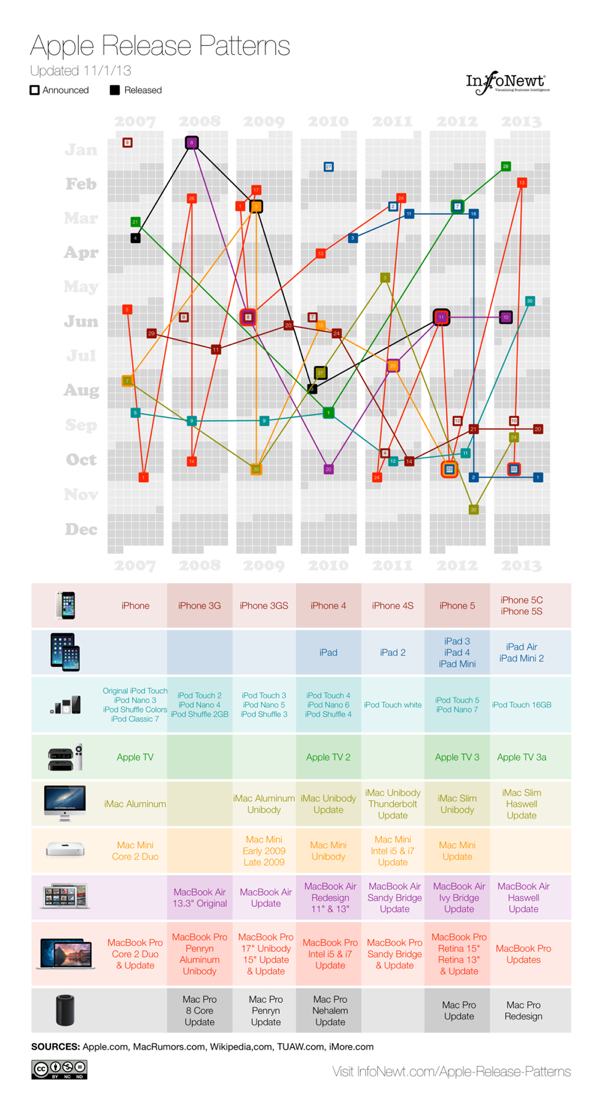
Apple Release Patterns is a new personal project of mine, and you can find the full-size original versions on a new, dedicated landing page on the InfoNewt.com site.  Every few months Apple releases a new product update or redesign, and the rumors start flying about what the upcoming product will be during the preceding weeks.  For better or worse, those speculations are often based on what was released in the same timeframe the prior year.

This data visualization lines up vertical columns for each year, starting with 2007.  I decided that anything further back wasn’t really relevant to Apple’s current practices.  Each product release is then mapped onto the calendar, showing a pattern (or lack of pattern) to the product releases.  If the product announcement was separate from the actual release date, I mapped that date as well.

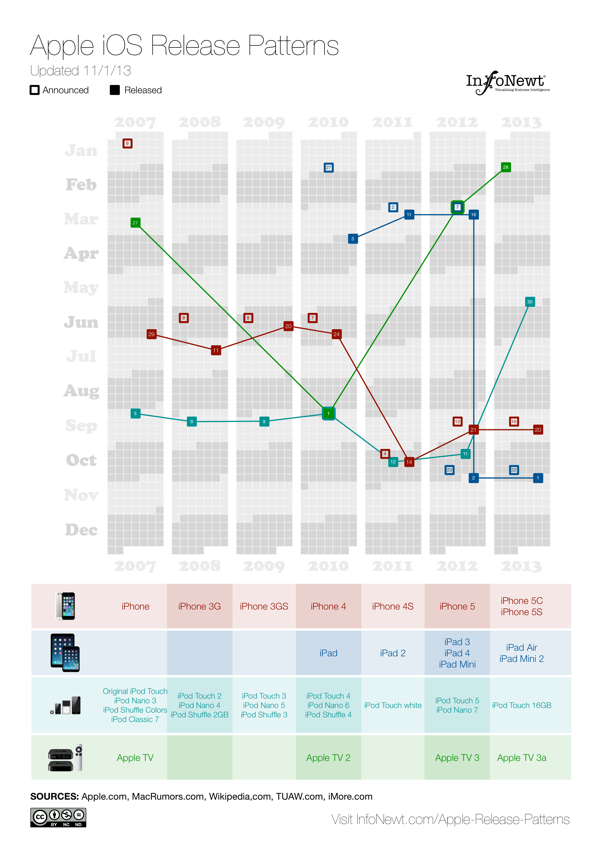
This data was ripe for a visualization.  When I tried to look at the historical dates of product releases, the information was scattered across multiple sites, confusing and difficult to gather.  Some information was contradictory, which required further investigation.  So, the data topic itself was a good target for a clear, easy-to-understand visualization.  However, the design with all of the products was too complicated visually to perceive any defining patterns.  So, I created separate versions that break out the products into 3 categories, and those are much easier for readers to see the patterns.

Apple iOS Release Patterns infographic

For iOS devices (iPod, iPad, iPhone and AppleTV) you can see the pattern shift in 2011 for most of the products to a Fall timeframe.  You can also see a recently consistent announcement date with the product release the following Friday.

Apple MacBook Release Patterns infographic

For Apple’s laptop line, the MacBooks, you can see the MacBook Air has become a regular release during the Worldwide Developers Conference (WWDC) in June, and the MacBook Pro gets fairly regular updates twice a year, usually just to update the internal specifications.

Apple Desktop Mac Release Patterns infographic

The desktop Mac line doesn’t seem to show much pattern at all.  They might get an update each year, but the timing is erratic.  Sometimes they are part of WWDC, sometimes part of the Fall iOS events, and sometimes completely on their own.

I’m going to keep updating these on the landing page as Apple releases new products in the future (upcoming iPad Mini 2 Retina and Mac Pro still need to start shipping this year).  I want these to become a valuable resource every time the Apple rumor mill heats up about the next product announcement.  If you use the embed code on the Apple Release Patterns landing page, your site will also display the updates automatically as they become available.

This is version 1.0.  I have some ideas and improvements I want to make in future versions, but I would love to hear your thoughts as well.  Post any suggestions or feedback in the comments below.

Tuesday
Sep102013

Our World Ski Calendar – Seasonal Ski Resorts around the World 

Our World Ski Calendar – Seasonal Ski Resorts around the World infographic

Avid Skier? Want to know where to go at anytime during the year? Our World Ski Calendar – Seasonal Ski Resorts around the World infographic from Monarch has all the financial and event information that you need to know to plan a ski trip during any month out of the year!

To celebrate our new ski flights we produced a world ski calendar so you can ski all year round across the world. For each destination we have provided some interesting stats plus individual piste information. Let us know your favourite ski destination by commenting below!

Thanks to Sam for sending in the link!

Friday
Jul192013

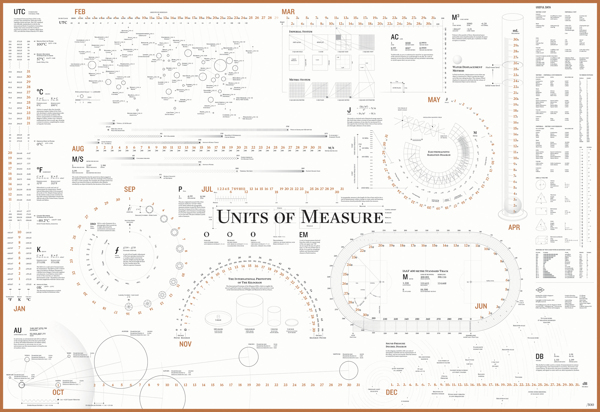
Units of Measure Calendar

An intriguing calendar that shows the date by using units of measurements commonly used. Designed by the team at ACRE in Singapore, you can buy your own Unit of Measure Calendar poster. There are two editions, a blue and black version as well as a black and copper.  

The idea of creating a calendar was always at the top of our heads. However, we needed an idea that was sound, that made sense. We went back to our roots for that big idea, and we stumbled upon the fact our agency is named after a unit of measure.

Things began to click into gear and the team worked to create a calendar that would highlight 12 units of measure . This brought a lot of symmetry to our design philosophy which melds sense and practicality together. This craft-centric calendar is designed to be practically functional as well as aesthetically pleasing. 

I do wish the high-resolution version was available to view online, but we can only see the gallery images.


Dimensions: 990 × 680 mm (39 × 26.75 in)

Found on Fast Co Design

Monday
Jul012013

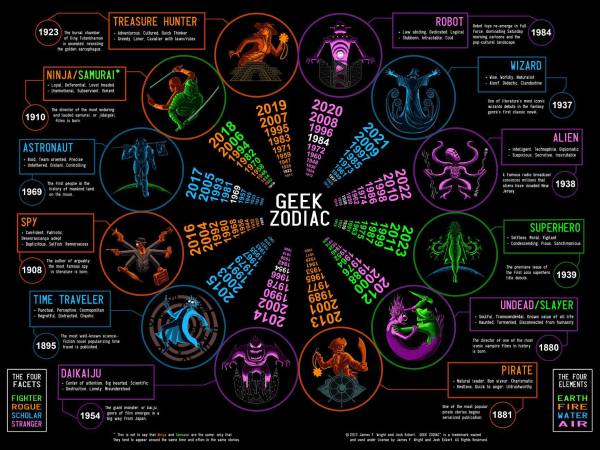
The Geek Zodiac

The Geek Zodiac infographic poster

Very cool poster of the 12 aspects of geekdom.  The Geek Zodiac was designed by James Wright & Joshua G. Eckert from the GeekZodiac.com.  

Soon to be available as a poster on The Geek Zodiac Store.

I was able to find the poster image on the Doctor Who and the T.A.R.D.I.S. feed on Facebook, but not on the GeekZodiac.com site.

Tuesday
Sep042012

2011 Wisconsin Crash Calendar & Interview

2011 Wisconsin Crash Calendar infographic

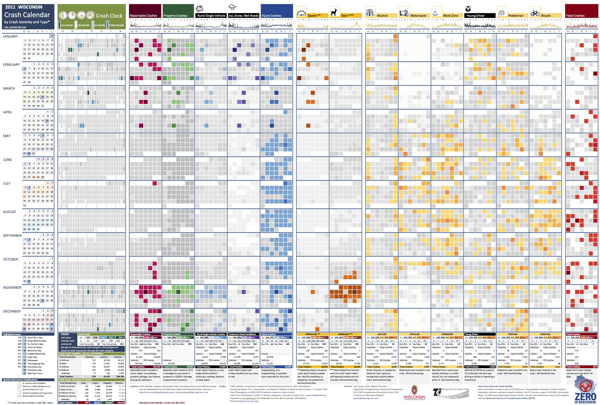
I love this infographic design!  Designed by Joni Graves, a Program Director at the University of Wisconsin-Madison Department of Engineering Professional Development (that’s a mouthful!).  I highly recommend downloading the PDF version and taking a closer look on your own.

The original version and a few variations are available on a couple different official sites:

The Wisconsin Bureau of Transportation Safety (BOTS) uses printed copies of the infographic calendar at meetings around the state with various groups to generate discussions about what causes crashes and how to interpret what the data shows.

This design is a great example of how visualizing the data allows the readers to see patterns in the data and much more easily understand the stories behind the data.  The color coding makes it easy to compare the data subsets, and the consistent layout to match a traditional paper calendar is very easy to follow.

There are so many findings you can quickly see in the big dataset.  Some are obvious, but many are surprising.  For example, you can clearly see…

  • Alcohol-related crashes happen primarily on weekends, and fairly consistently throughout the year.
  • Deer Season is clearly identified in Oct-Nov.
  • There was something special about July 1st…
  • Motorcycle, Work Zone and Bicycle crashes occur during the Summer months.
  • Ice, Snow, Wet Road crashes are highest in Jan-Feb, but what happened on April19th?  Late Winter storm?
  • Speed related crashes are primarily reported in the Winter months.
  • Fatal crashes are evenly spread throughout the year

Joni was also willing to answer some interview questions about this project and her design process:

Cool Infographics: What software applications did you use to create the Crash Calendar?

Joni Graves: EXCEL 2010 using Pivot Tables. Presentation advancements incorporate Microsoft’s PowerPivot using SharePoint.

Cool Infographics: Was the design created in cooperation with the Wisconsin Transportation Information Center, or was it an independent project? 

Joni Graves: I’m a Program Director at the UW-Madison Department of Engineering Professional Development and part of the WI LTAP (FHWA’s Local Transportation Assistance Program) / Wisconsin Transportation Information Center (TIC).

Cool Infographics: How long did the design take you to create?

Joni Graves: It’s a longer story, if you’re interested, but the skinny is that I started working on the Crash Calendar format in mid-April and previewed it at a meeting the end of the month. I had a learning curve with some of the intricacies, and spent about 200 hours on it during that two weeks! Since then it’s taken on a life of its own — and I am delighted by that!

Cool Infographics: Would you describe your design process?

Joni Graves: I would be happy to elaborate on this but, as an inveterate designer / tinkerer, I’ll confess that I’m always discovering some new way of formatting / displaying the data, and disappointed that there’s never enough time to do the new ideas justice …

Cool Infographics: What’s the most interesting thing you learned from the data?

Joni Graves: I’ve certainly enjoyed the design process! More importantly, it’s been incredibly satisfying to see people engage w/ the data using this intuitive representation, or to read their comments, because it’s apparent that it helps make the data far more accessible! And I have loved the comments / responses.

Cool Infographics: What was the hardest part behind designing the Crash Calendar?

Joni Graves: As I noted, there’s been a fascinating learning curve. But the hardest part has been stopping! As noted above, I’m always trying to “improve” it — and always running out of time.

Cool Infographics: What should we expect from future versions of the design?

Joni Graves: We currently have a multi-year version, a web-demo site, and a working 2012 version. I’m very excited about incorporating choropleth maps. Although it’s a very interesting “historic” document, the real goal is to provide a resource that is far more timely and potentially predictive for local users. 

I’m really excited about our plans to webize it, because the real idea is to expand it as a national project — using multi-year FARS data, WI data, and data from other interested states — and we really want to “unleash” it for others to actively use. 

Cool Infographics: Challenges?

Joni Graves: There’s been a wonderful response — and we are trying to figure out how to actually fund an expanded project w/ enhancements!

One additional thing to note was that Joni was inspired to create the whole design project by Nathan Yau’s post on Vehicles involved in fatal crashes in 2010 (which I posted about here earlier this year), and I think she has done a great job building Nathan’s initial visualization into some something much more powerful and effective.

Thanks to Joni for sharing!

Monday
Feb062012

Infographic Events Calendar 2011-2012

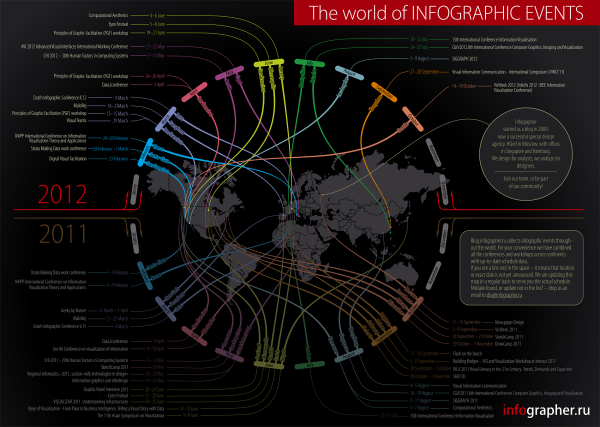
Outstanding calendar-map infographic from Infographer.ru, a Russian infographics site and design agency in Moscow (view in English).  The Infographic Events Calendar 2011-2012 shows many (but not all) visualization, data and infographic conferences and events around the globe.

For everyone who is interested in information design we prepared the events calendar. We found over 44 conferences and workshops, dedicated to infographics and visualization topic all over the world.

The idea to make this kind of ‘map-calendar’ of events appeared in our mind a long time ago, we started to collect data in 2011 and suddenly 2012 started. So we decided to combine both years and show the history for 2011 and actual events for 2012, which you can use for your personal planning.

They collected over 40 conferences and workshops dedicated to information visualization for last year and the upcoming schedule for 2012.  The calendar-map color codes the events by month and obviously connects them to the correct location on the world map.

If you know any corrections or additions to the event included, please post them in the comments!  I know they will be reading them, and would welcome all feedback.  Here are a few events I think they should add to their list:

  • South by Southwest Interactive, Austin, TX, March 9-13, 2012
  • TDWI World Conference (Tableau), Las Vegas, NV, February 13-15, 2012
  • Big Data 2012, Paris, France,  March 20-21, 2012

I like the text of the city name included in the connecting lines, and the months with no events are gray so they don’t add to the visual noise of the bright colors.  Somewhere on the design they should have included the URL for people to find their original posting.  When this get shared online, readers will have a hard time finding the original site.

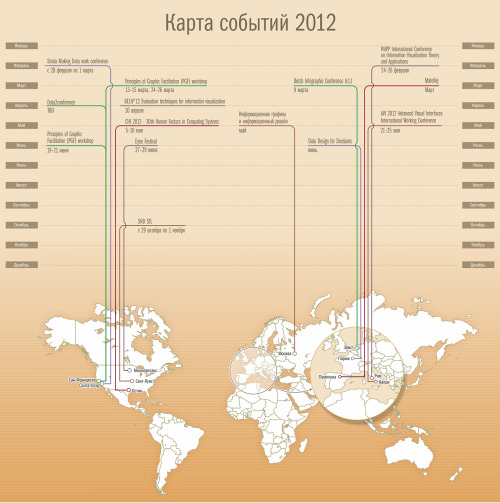
Infographer also posted some behind-the-scenes information about the development of the design.  Check out their early drafts in the complete blog post.

Thanks to Irina for sending in the link and posting the English translation of the development process!

Wednesday
Jan112012

Calendar Visualization of Fatal Car Crashes

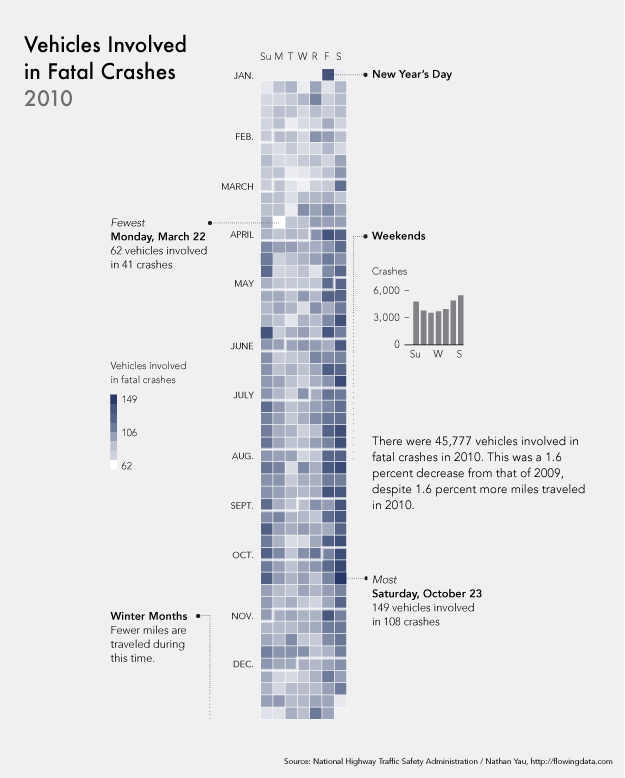
I really like this data visualization from Nathan Yau at FlowingData.comVehicles Involved in Fatal Crashes 2010 takes a new look at the statistics released by the U.S. National Highway Traffic Safety Administration.  Instead of plotting them on a traditional map, Nathan looked at the time data.

After seeing this map on The Guardian, I was curious about what other data was available from the National Highway Traffic Safety Association. It turns out there’s a lot and it’s relatively easy to access via FTP. What’s most surprising is that it’s detailed and fairly complete, with columns for weather, number of people involved, date and time of accidents, and a lot more.

The above shows vehicles involved in fatal crashes in 2010 (which is different from number of crashes or number of fatalities). This data was just released last month, at the end of 2011 oddly enough. It’s a calendar view with months stacked on top of one another and darker days indicate more vehicles involved.

- Nathan Yau

As was suggested by others in the comments on FlowingData, I agree that since the weekends have the higher incidence rate, starting the week with Monday and moving Sunday to the last column may show that a little bit clearer.

Nathan has made all of the data avaialble for anyone that would like to try a visualization themselves.  Student project?