Apple Release Patterns
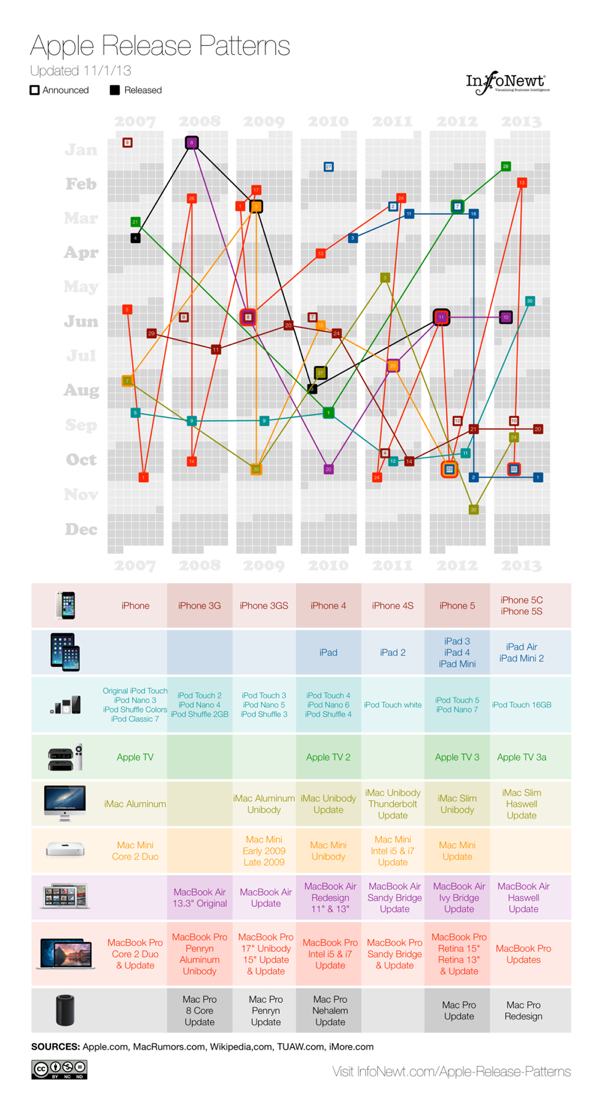
Apple Release Patterns is a new personal project of mine, and you can find the full-size original versions on a new, dedicated landing page on the InfoNewt.com site. Every few months Apple releases a new product update or redesign, and the rumors start flying about what the upcoming product will be during the preceding weeks. For better or worse, those speculations are often based on what was released in the same timeframe the prior year.
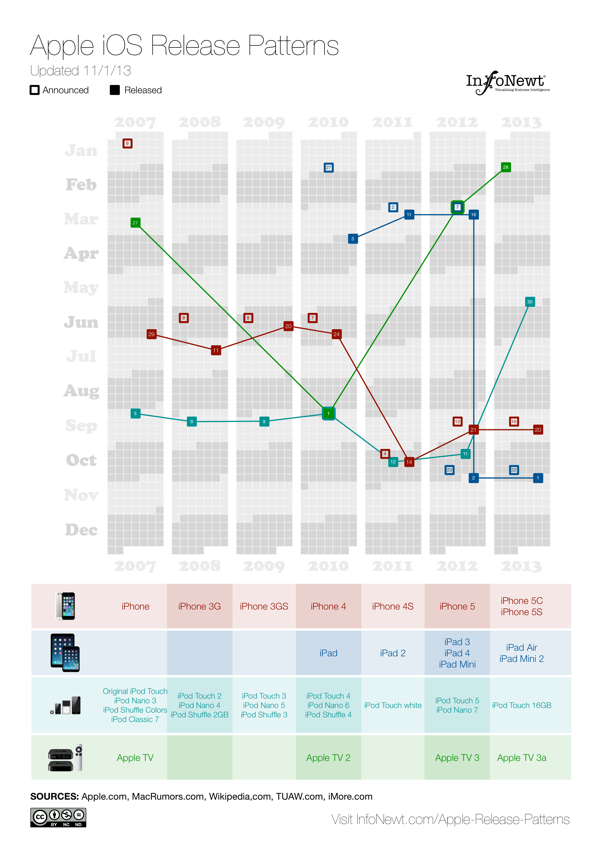
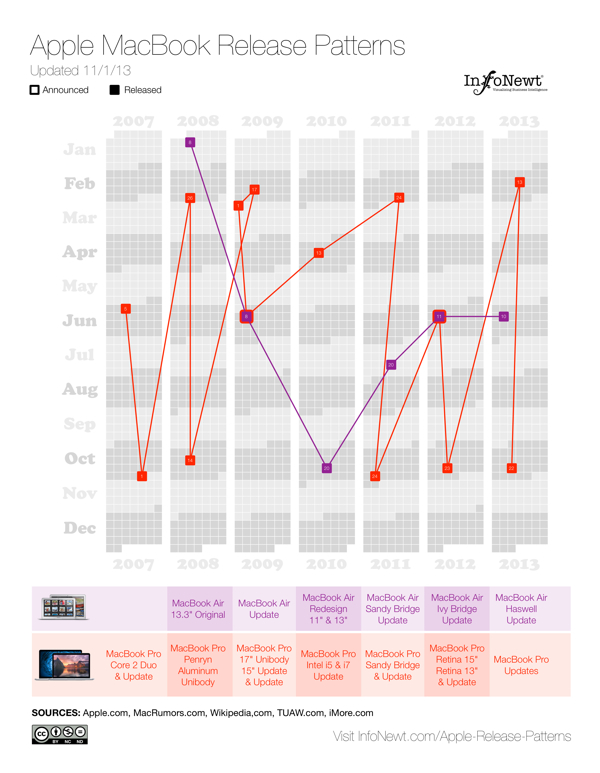
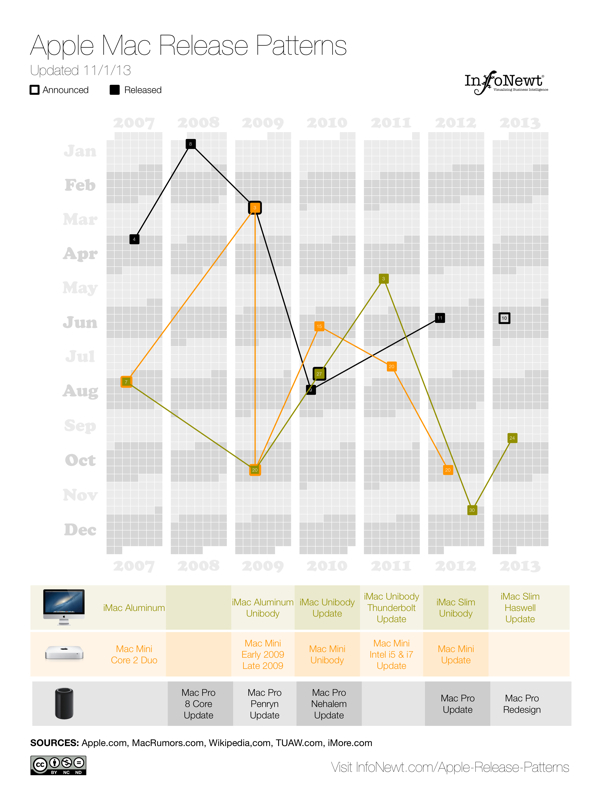
This data visualization lines up vertical columns for each year, starting with 2007. I decided that anything further back wasn’t really relevant to Apple’s current practices. Each product release is then mapped onto the calendar, showing a pattern (or lack of pattern) to the product releases. If the product announcement was separate from the actual release date, I mapped that date as well.
This data was ripe for a visualization. When I tried to look at the historical dates of product releases, the information was scattered across multiple sites, confusing and difficult to gather. Some information was contradictory, which required further investigation. So, the data topic itself was a good target for a clear, easy-to-understand visualization. However, the design with all of the products was too complicated visually to perceive any defining patterns. So, I created separate versions that break out the products into 3 categories, and those are much easier for readers to see the patterns.
For iOS devices (iPod, iPad, iPhone and AppleTV) you can see the pattern shift in 2011 for most of the products to a Fall timeframe. You can also see a recently consistent announcement date with the product release the following Friday.
For Apple’s laptop line, the MacBooks, you can see the MacBook Air has become a regular release during the Worldwide Developers Conference (WWDC) in June, and the MacBook Pro gets fairly regular updates twice a year, usually just to update the internal specifications.
The desktop Mac line doesn’t seem to show much pattern at all. They might get an update each year, but the timing is erratic. Sometimes they are part of WWDC, sometimes part of the Fall iOS events, and sometimes completely on their own.
I’m going to keep updating these on the landing page as Apple releases new products in the future (upcoming iPad Mini 2 Retina and Mac Pro still need to start shipping this year). I want these to become a valuable resource every time the Apple rumor mill heats up about the next product announcement. If you use the embed code on the Apple Release Patterns landing page, your site will also display the updates automatically as they become available.
This is version 1.0. I have some ideas and improvements I want to make in future versions, but I would love to hear your thoughts as well. Post any suggestions or feedback in the comments below.


 Randy
Randy


Reader Comments (2)
Basically it's not interesting to know in what year which model came out at what time, but only in which part of a year a model appeared on the market (or was announced).
Best, J.