About
Randy Krum
President of InfoNewt.
Data Visualization and Infographic Design

Infographic Design

Infographics Design | Presentations
Consulting | Data Visualizations

DFW DataViz Meetup

Join the DFW Data Visualization and Infographics Meetup Group if you're in the Dallas/Fort Worth area!

Search the Cool Infographics site

Custom Search

Subscriptions:


Feedburner

The Cool Infographics® Gallery:

How to add the
Cool Infographics button to your:

Cool Infographics iOS icon

- iPhone
- iPad
- iPod Touch


Read on Flipboard for iPad and iPhone

Featured in the Tech & Science category

Flipboard icon

Twitter Feed
From the Bookstore

Caffeine Poster

The Caffeine Poster infographic

Entries in Mac (4)

Friday
Nov082013

Apple Release Patterns

Apple Total Release Patterns infographic

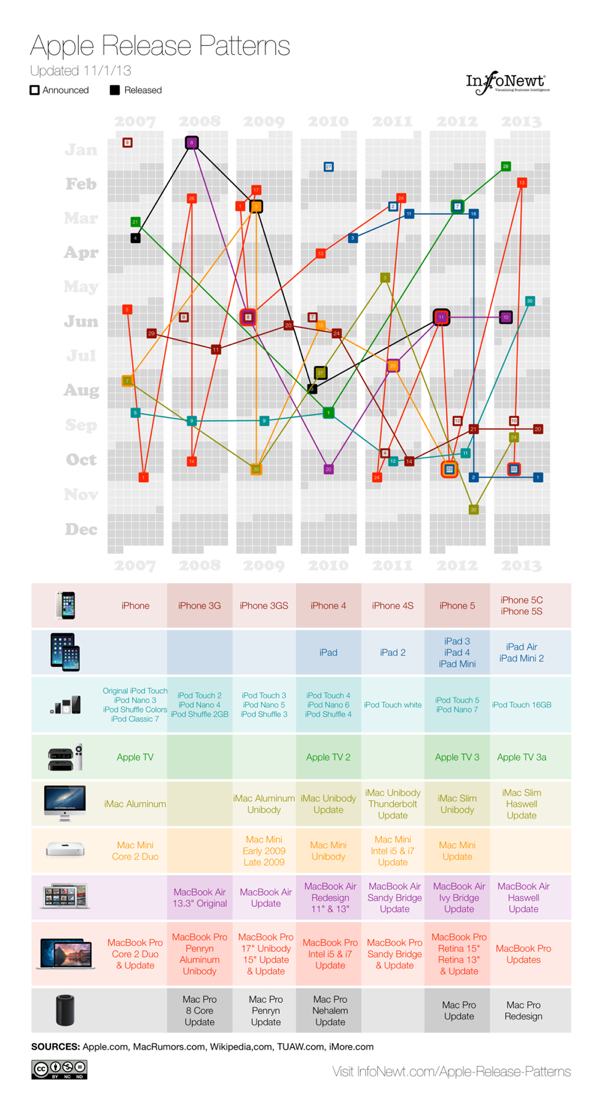
Apple Release Patterns is a new personal project of mine, and you can find the full-size original versions on a new, dedicated landing page on the InfoNewt.com site.  Every few months Apple releases a new product update or redesign, and the rumors start flying about what the upcoming product will be during the preceding weeks.  For better or worse, those speculations are often based on what was released in the same timeframe the prior year.

This data visualization lines up vertical columns for each year, starting with 2007.  I decided that anything further back wasn’t really relevant to Apple’s current practices.  Each product release is then mapped onto the calendar, showing a pattern (or lack of pattern) to the product releases.  If the product announcement was separate from the actual release date, I mapped that date as well.

This data was ripe for a visualization.  When I tried to look at the historical dates of product releases, the information was scattered across multiple sites, confusing and difficult to gather.  Some information was contradictory, which required further investigation.  So, the data topic itself was a good target for a clear, easy-to-understand visualization.  However, the design with all of the products was too complicated visually to perceive any defining patterns.  So, I created separate versions that break out the products into 3 categories, and those are much easier for readers to see the patterns.

Apple iOS Release Patterns infographic

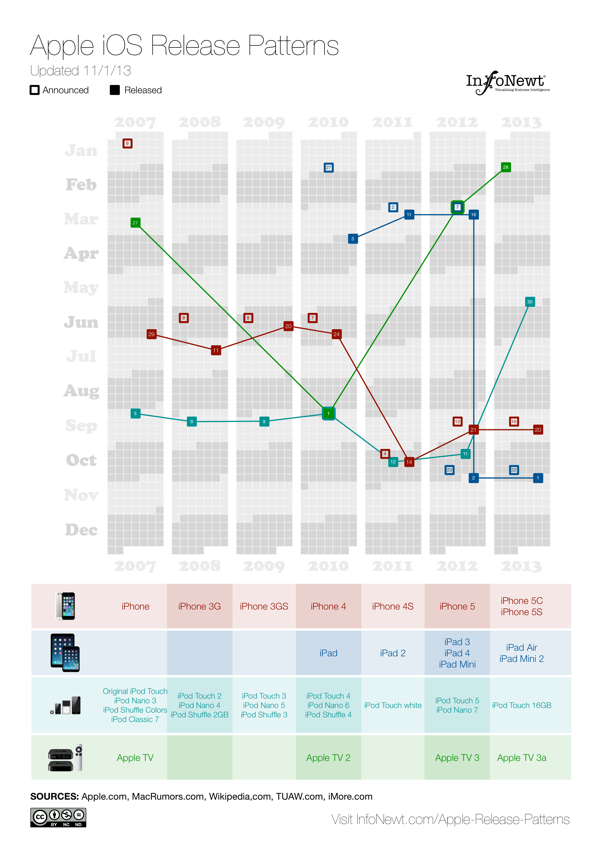
For iOS devices (iPod, iPad, iPhone and AppleTV) you can see the pattern shift in 2011 for most of the products to a Fall timeframe.  You can also see a recently consistent announcement date with the product release the following Friday.

Apple MacBook Release Patterns infographic

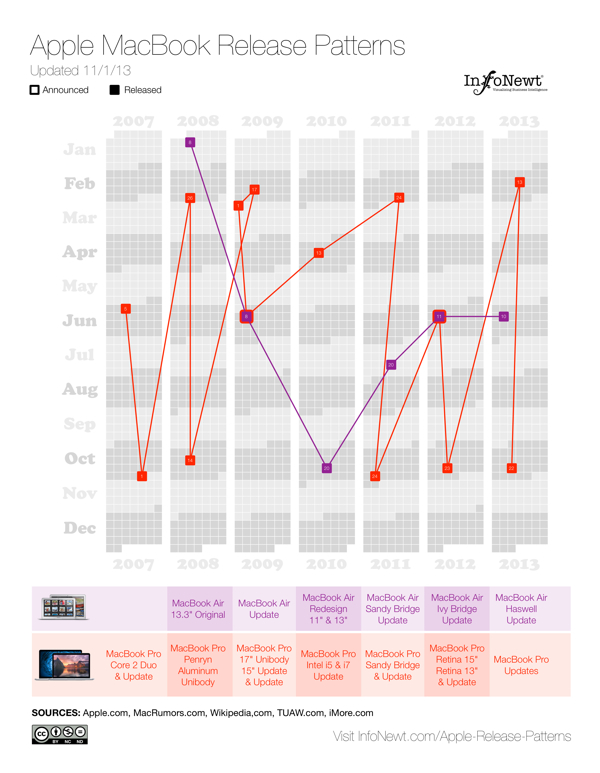
For Apple’s laptop line, the MacBooks, you can see the MacBook Air has become a regular release during the Worldwide Developers Conference (WWDC) in June, and the MacBook Pro gets fairly regular updates twice a year, usually just to update the internal specifications.

Apple Desktop Mac Release Patterns infographic

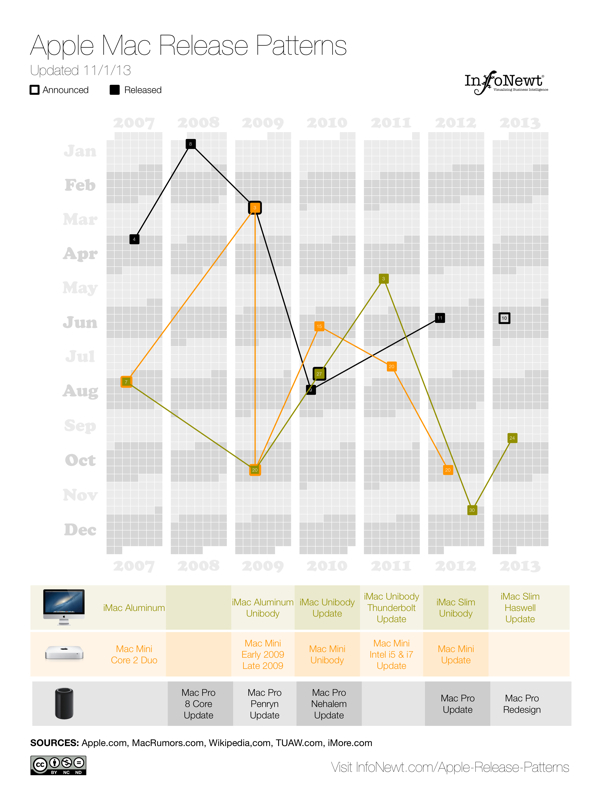
The desktop Mac line doesn’t seem to show much pattern at all.  They might get an update each year, but the timing is erratic.  Sometimes they are part of WWDC, sometimes part of the Fall iOS events, and sometimes completely on their own.

I’m going to keep updating these on the landing page as Apple releases new products in the future (upcoming iPad Mini 2 Retina and Mac Pro still need to start shipping this year).  I want these to become a valuable resource every time the Apple rumor mill heats up about the next product announcement.  If you use the embed code on the Apple Release Patterns landing page, your site will also display the updates automatically as they become available.

This is version 1.0.  I have some ideas and improvements I want to make in future versions, but I would love to hear your thoughts as well.  Post any suggestions or feedback in the comments below.

Monday
Jul012013

How Apple Are You?

How Apple Are You? infographic

Do you think you’re Apple’s number one fan? Take the test on the How Apple Are You? infographic from mackeeper.com to see how you match up! Fancy a new tattoo soon? How about an Apple?

You think you know everything about Apple? Would you call yourself an Apple Fan? How about checking the level of Apple in your blood, would you be up for that? Check out our awesome info-graphics and find out how Apple you are! Make sure you share this with your buddies!

I’ll admit I scored a 155, so I’m a fairly hardcore Apple fan.

Where’s the URL to the original infographic landing page?!?

Thanks to Shelli for sending in the link!

Friday
Jul222011

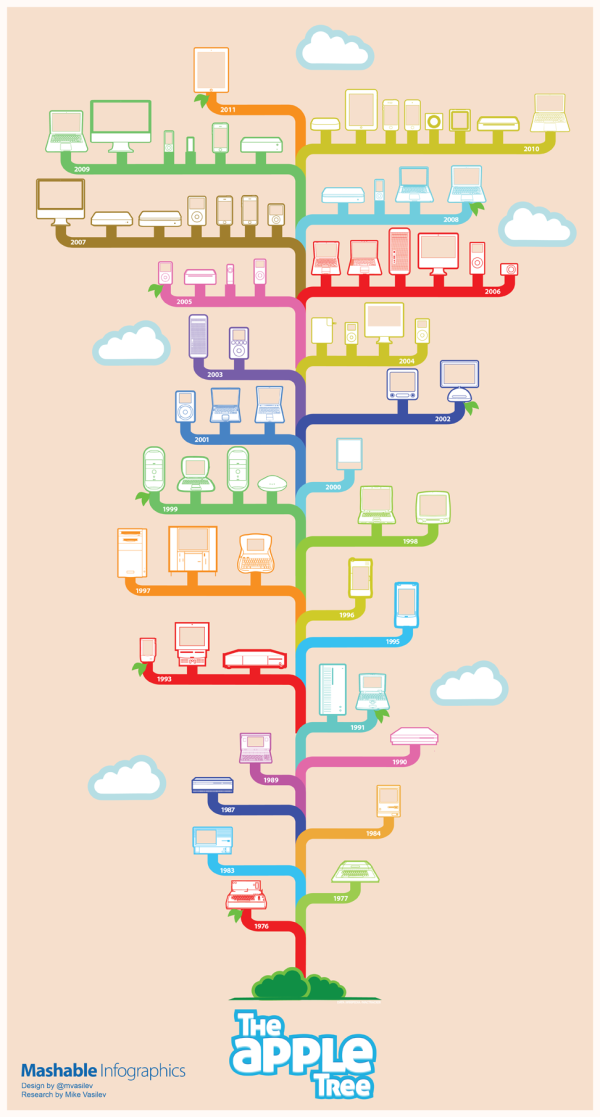
35 Years of Apple Products - Visual History

From Mashable come The Apple Tree, a visual, iconic timeline 35 years of Apple product releases.  Designed by Mike Vasilev (@mvasilev on Twitter).

When it comes to industrial design, few consumer electronics or computer makers have the legacy or influence of Apple, Inc. In the last 35 years, Apple has introduced a myriad of products and devices, some very successful, some, not so much.

Artist Mike Vasilev created this infographic for Mashable, highlighting the major Apple product releases and design changes from 1976 through 2011.

I love how recognizeable all of the product illustrations are.  I’ve owned way too many of these products over the years.

Found on Social Media Graphics.

Thursday
Apr282011

Self-Described Mac vs. PC People infographic

Profile of a Self-Described Mac Person vs. PC Person is a fun infographic looking at personality and preference differences.  Based on 388,315 survey respondents from Hunch.com, it illustrates topics like who throws parties, math aptitude, taste in art, cocktail drinks of choice and would they ride a Vespa or a Harley.

Our latest data project was to analyze how self-described Mac and PC people are different. The infographic below, designed by the talented folks at Column Five Media, breaks it down.

Back in ye olden days of Hunch — November 2009 — we explored the differences in personality, aesthetic tastes, and media preferences between Mac and PC users. Since then, the Hunch user base and question pool have grown many times over. The 2009 report started with more than 76,000 responses to its base “Mac or PC?” question. The same question now has nearly 400,000 responses. This is all in the context of the more than 80 million “Teach Hunch About You” questions which have been answered on Hunch to date.

From a research standpoint, even though the number of respondents is high, these are voluntary survey participants that haven’t gone through a screening process.  So while the results are fun, I don’t think they can be considered a statistically accurate representation of the population as a whole.

Very funny, and a great job by the design team at Column Five Media!  Found on FlowingData and Visual News