About
Randy Krum
President of InfoNewt.
Data Visualization and Infographic Design

Infographic Design

Infographics Design | Presentations
Consulting | Data Visualizations

DFW DataViz Meetup

Join the DFW Data Visualization and Infographics Meetup Group if you're in the Dallas/Fort Worth area!

Search the Cool Infographics site

Custom Search

Subscriptions:


Feedburner

The Cool Infographics® Gallery:

How to add the
Cool Infographics button to your:

Cool Infographics iOS icon

- iPhone
- iPad
- iPod Touch


Read on Flipboard for iPad and iPhone

Featured in the Tech & Science category

Flipboard icon

Twitter Feed
From the Bookstore

Caffeine Poster

The Caffeine Poster infographic

Entries in iOS (4)

Thursday
Oct152015

iOS Version Release Date History

iOS Version Release Date History

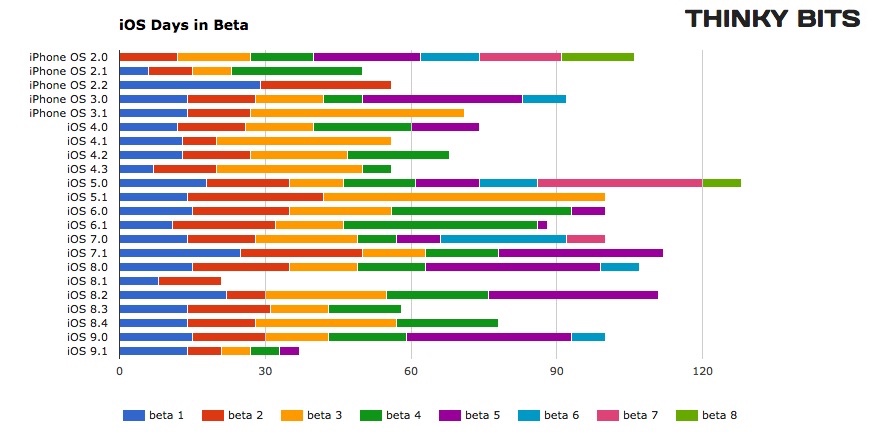
iOS Version Release Date History is a data visualization that shows how long each version of iOS has gone through beta versions. I really like this visualization by Will Hains and posted on his site Thinky Bits.

The design is still a work-in-progress, and it still requires me to go in and edit it every time a new beta is released, but it’s much less work than it used to be. And now, with the magic of Google’s Charts API, it’s interactive as well. The chart is 100% generated by Javascript in the browser, producing slick SVG images on-the-fly.

The stacked bar style clearly shows how long each version spend in the development process, and specifically shows how fast iOS 9.1 is being pushed through the system.

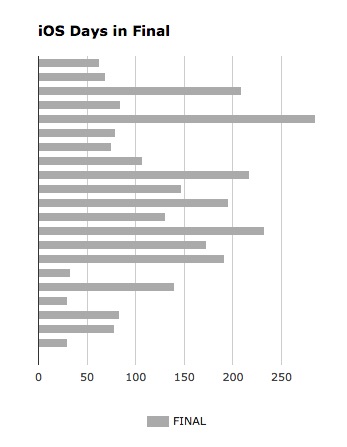
You can also see how long each version was the official current version in the wild, and the general trend to update iOS more frequently in Will's 2nd chart.

iOS Final Version Release Date History

Wednesday
Sep172014

The Evolution of iOS from iOS 1 - iOS 8

The Evolution of iOS from iOS 1 - iOS 8 infographic

On iOS 8 launch day, The Evolution of iOS from iOS 1- iOS 8 infographic is a timeline of the iOS systems from 7 Day Shop. The infographic shows the evolution of the home screen, app icons, and the most noteworthy features.

This week saw the launch of the highly anticipated iPhone 6, iPhone 6 Plus and iWatch. Apple also announced that iOS 8, the operating system that will run both of the new iPhones will be made available for download on September 9th, 2014.

In light of the evolutionary change of the iOS, we decided to dig a little deeper to the first ‘iPhone OS’ right through to it’s latest iteration iOS 8. It’s development both in the hardware and software front over just only 6 years is beyond remarkable.

We have charted the evolution of the home screen, app icons and the most noteworthy features of each iOS.

It’s a tall design with a lot of information, but the visuals help out tremendously.  There’s way too much text in this design, and they chose to make the font size too small to fit it all in.  For the new features added with each major upgrade I would remove the text descriptions, and just keep the titles.  Keep the design simple.

This is a good example of an informative infographic capitalizing on a hot trending topic. There’s no hard sales pitch or even a call-to-action. This makes people more willing to share the infographic, and 7DayShop.com just put their logo in the footer to claim credit and build their overall awareness and credibility. They should have included the URL link to the original infographic on their site to help readers find it. Especially on a design this big, because most blog and social shares will post a smaller thumbnail version.

Are the new features compelling you to upgrade to iOS 8? Did you order the new iPhone 6? Let me know in the comments!

Thanks to Kunie for sending in the link!

Friday
Nov082013

Apple Release Patterns

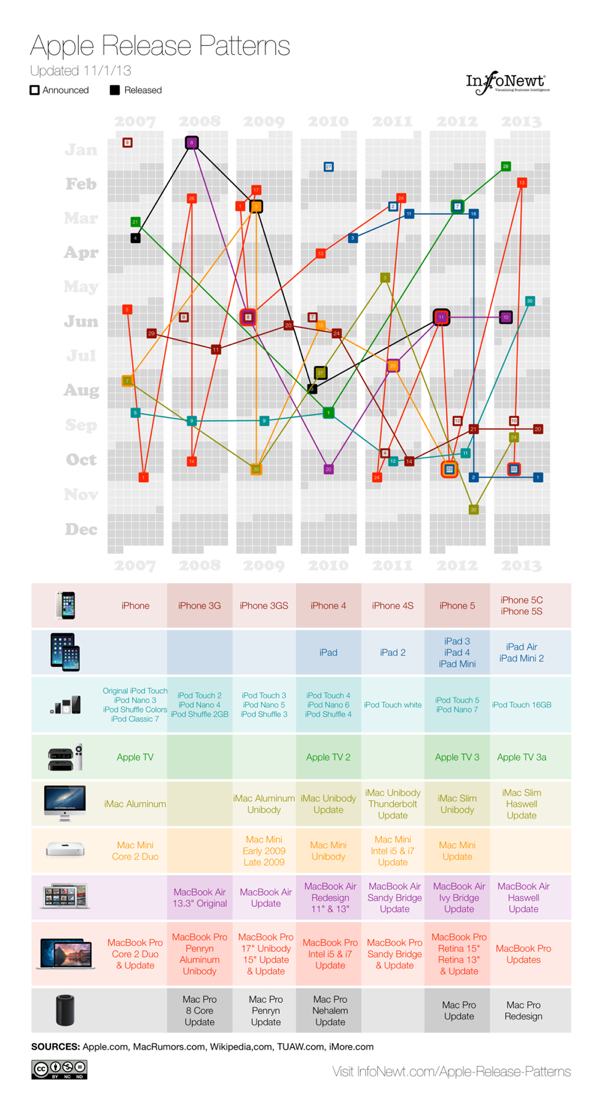
Apple Total Release Patterns infographic

Apple Release Patterns is a new personal project of mine, and you can find the full-size original versions on a new, dedicated landing page on the InfoNewt.com site.  Every few months Apple releases a new product update or redesign, and the rumors start flying about what the upcoming product will be during the preceding weeks.  For better or worse, those speculations are often based on what was released in the same timeframe the prior year.

This data visualization lines up vertical columns for each year, starting with 2007.  I decided that anything further back wasn’t really relevant to Apple’s current practices.  Each product release is then mapped onto the calendar, showing a pattern (or lack of pattern) to the product releases.  If the product announcement was separate from the actual release date, I mapped that date as well.

This data was ripe for a visualization.  When I tried to look at the historical dates of product releases, the information was scattered across multiple sites, confusing and difficult to gather.  Some information was contradictory, which required further investigation.  So, the data topic itself was a good target for a clear, easy-to-understand visualization.  However, the design with all of the products was too complicated visually to perceive any defining patterns.  So, I created separate versions that break out the products into 3 categories, and those are much easier for readers to see the patterns.
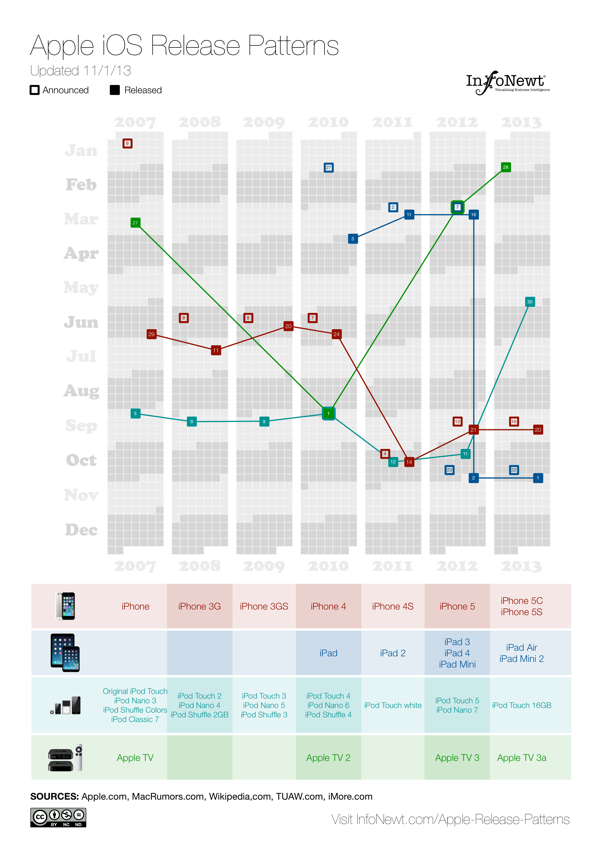
Apple iOS Release Patterns infographic

For iOS devices (iPod, iPad, iPhone and AppleTV) you can see the pattern shift in 2011 for most of the products to a Fall timeframe.  You can also see a recently consistent announcement date with the product release the following Friday.
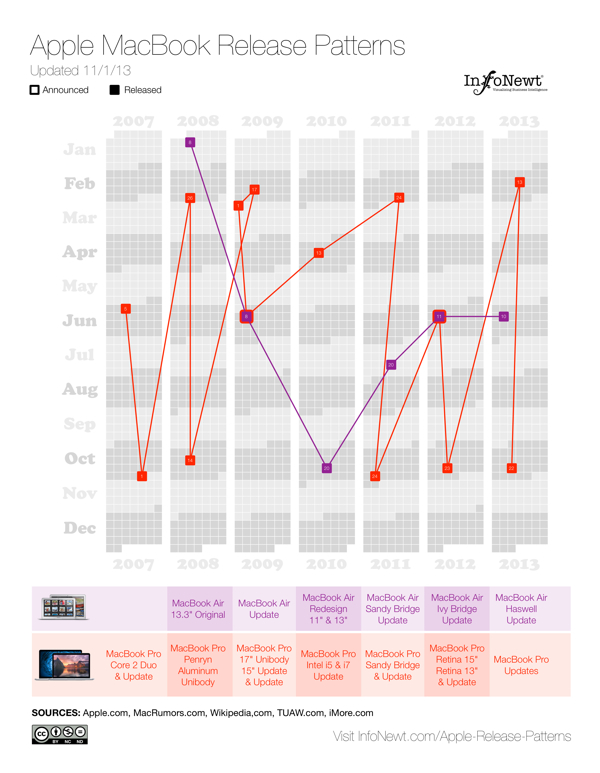
Apple MacBook Release Patterns infographic

For Apple’s laptop line, the MacBooks, you can see the MacBook Air has become a regular release during the Worldwide Developers Conference (WWDC) in June, and the MacBook Pro gets fairly regular updates twice a year, usually just to update the internal specifications.
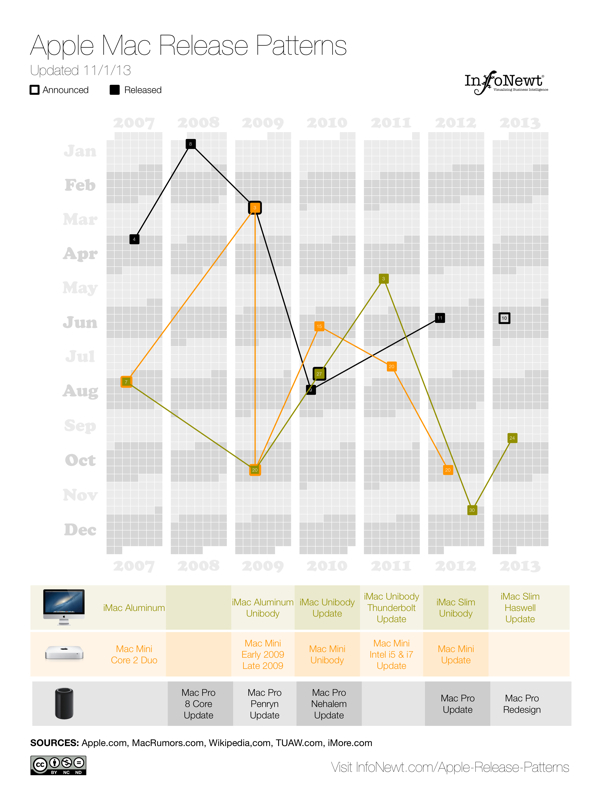
Apple Desktop Mac Release Patterns infographic

The desktop Mac line doesn’t seem to show much pattern at all.  They might get an update each year, but the timing is erratic.  Sometimes they are part of WWDC, sometimes part of the Fall iOS events, and sometimes completely on their own.

I’m going to keep updating these on the landing page as Apple releases new products in the future (upcoming iPad Mini 2 Retina and Mac Pro still need to start shipping this year).  I want these to become a valuable resource every time the Apple rumor mill heats up about the next product announcement.  If you use the embed code on the Apple Release Patterns landing page, your site will also display the updates automatically as they become available.

This is version 1.0.  I have some ideas and improvements I want to make in future versions, but I would love to hear your thoughts as well.  Post any suggestions or feedback in the comments below.

Monday
Jul292013

A #Sworcery Infographic


A Sword and Sworcery Infographic

Two years ago Superbrothers: Sword and Sworcery EP was one of the first great games released that was designed specifically for the Apple iPad. Designed by Capybara Games, the game was also later released on iPhone, Android, Windows PC, Linux and Mac based on the huge success of the iPad version.

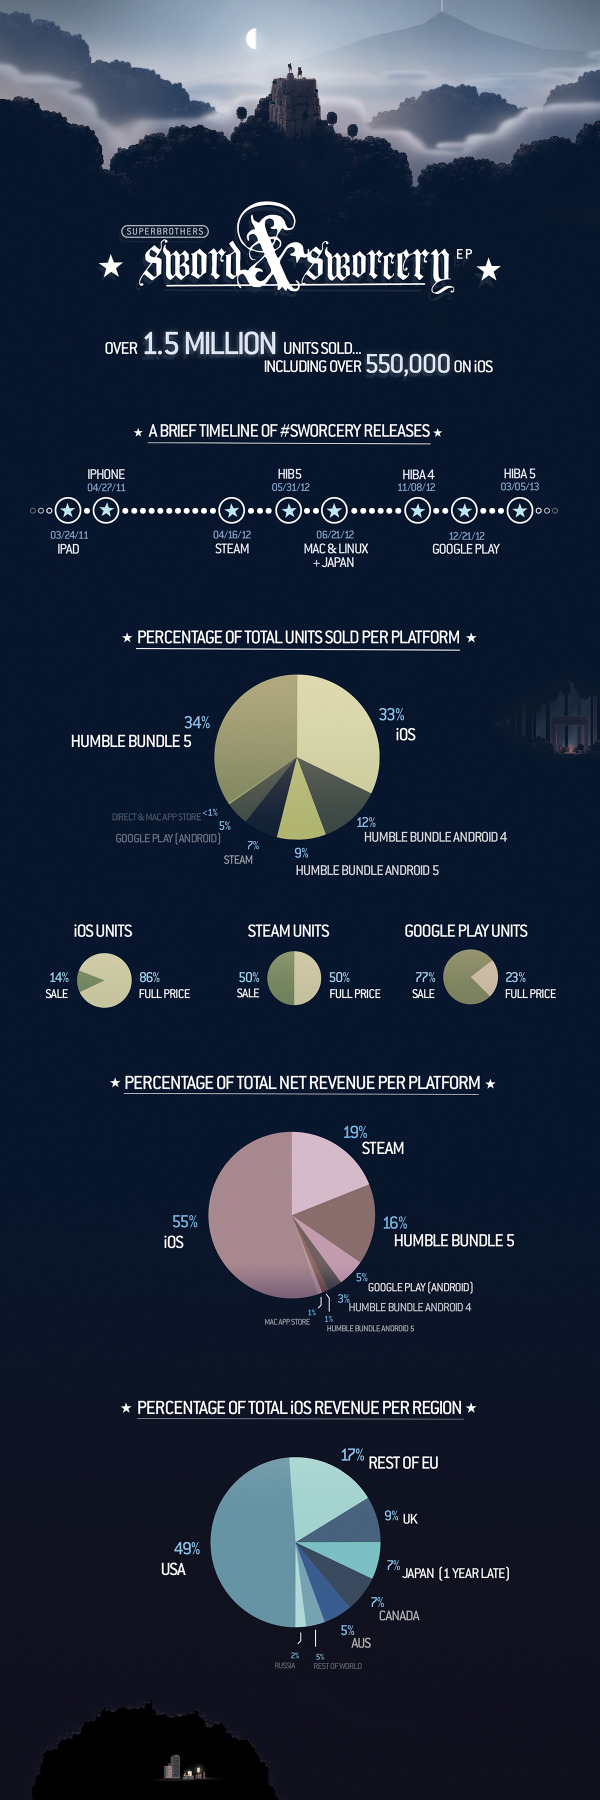
To celebrate the 2nd anniversary, Capybara Games released the Sword and Sworcery Infographic, and that’s cooler than a Trigon Trifecta!  (Also available on the SwordAndSworcery.com site)

From the Capybara Games site:


On March 24th, 2011 Superbrothers: Sword & Sworcery EP launched on iPad. The first hours after its release were exciting, stressful, celebratory and even terrifying (as game-centric twitter feeds exploded). We watched as the game hit the top 10 paid games chart before we were even featured. Leading up to launch we knew we had made something cool. After launch we knew there was an audience that appreciated it.

Over the next 2+ years, we brought the game to PC, Mac & Linux. We collaborated with the amazing folks from 8-4 to create a version specifically for Japan. With the help of Apportable, we brought the game to Android. We joined our close friends in the most successful Humble Indie Bundle of all time, and joined a great Android Bundle as well.

With over 1.5 million copies sold, it’s pretty obvious that #Sworcery has been a resounding success. And we’d like to share a few details of that success with you. There’s not that many titles out there that began on iOS and made their way to this many other platforms over time, so we hope that this info is helpful in some way/shape/form.


From such a visual game design, I would have liked to see the chart labels as icons of the companies instead of just text labels. Even better as 8-bit icons similar to the design of the game.


As I mention about many infographic designs, the URL to the original infographic landing page should be included in the footer of the design so readers can find the full-size version of the infographic. I had to shrink the infographic image to fit on the blog, like many people, and I always try to link back to the original source. Not everyone is good about linking, and you want the readers to be able to find their way back.

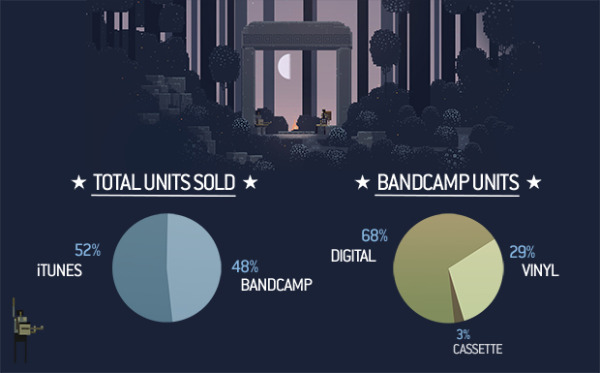
As a bonus mini-infographic, they also released some of the stats behind the music by rockstar & critically acclaimed composer Jim Guthrie soundtrack, Sword & Sworcery LP - The Ballad of the Space Babies, also available on the iTunes store.

Jim Guthrie Stats infographic

Found on The Verge and Daring Fireball.